CONDITION MONITORING OF VARIABLE SPEED WORM GEARBOX LUBRICATED WITH CONTAMINATED GEAR OIL
MAZNAN BIN ISMON
A thesis submitted in
Fulfillment of the requirement for the award of the
Degree of Master Mechanical Engineering
Faculty of Mechanical and Manufacturing Engineering
Universiti Tun Hussein Onn Malaysia
ABSTRACT
Vibration and temperature monitoring are the techniques for machinery maintenance and
fault diagnosis that could predict the gears and bearings failure. ,This research focuses on
the condition monitoring of worm gearbox lubricated with contaminated gear oil. Worm
gearbox consists of a spirally grooved screw moving against a toothed wheel. The main
objectives are to characterize vibration behavior of worm gear as h c t i o n contaminated
lubricant viscosity. Experimental test rig with inverter, electric motor and gearbox was
developed and employed for this research. New gear oil with IS0 VG 100,460 and 680
had been indentified to serve the sliding friction of both gears as a comparison to
contaminated oil. A predetermine speed of electric motof at 900, 1150 and 1400 W M
was introduced to the gearbox and a set of vibration instrumentations with ICP
accelerometer model PCB 393B04 was installed as to capture the vibration signal
generated. As to enhance the effectiveness of condition monitoring techniques,
temperature rising in the gear oil upon the testing period was monitored using PicoLog
USB TC-08 Data Logger and later to be analyzed. The experiment had revealed that oil
with higher viscosity will contribute to less vibration spectrum. At 900 RPM for IS0
VG100, IS0 VG460 and IS0 VG 680 the vibration reduction percentage within new and
contaminated gear oil were 5 1.02%, 24.66% and 5 1.3 0% respectively. The temperature
monitoring for IS0 VG100, 460 and 680 for new and contaminated oil were observed
within 34.97"C, 35.67"C and 39.27"C respectively. The higher viscosity the higher
TABLE OF CONTENTS
DECLARATION
DEDICATION
ACKNOWLEDGEMENT
ABSTRACT
CHAPTER 1
INTRODUCTION
1.1 Introduction
1.2 Problem Statement
1.3 Objective
1.4 Scope of study
1.5 Expected Result
1.6 Potential Contribution
CHAPTER 2
LITERATURE REVIEW AND THEORY
2.1 Introduction
2.2 Condition Monitoring Techniques
2.2.1 Vibration Analysis
2.2.2 Oil Sampling Analysis
2.2.3 Thermograph Monitoring
2.2.4 Acoustic Monitoring
2.2.5 Electric Motor Current Monitoring
2.3 Industrial Gearboxes
2.3.1 Wormgear
2.3.3 Parallel Gear Transmission System
2.4 Lubricant
2.4.1 Lubricant Viscosity Classification
2.4.2 The Impact of lubricant on mechanical vibration
2.4.3 Contamination Effect
2.4.4 Identifjmg lubricant Contamination
2.4.5 Lubricant Life Time
2.4.6 Oxidation in Lubricant
2.4.7 Oil Analysis
2.4.8 Wear particle analysis for machine condition
2.4.9 Lubrication viscosity
2.5 Theory
2.5.1 Introduction
2.5.2 Detection Defects with Vibration analysis
2.5.3 Vibration Standard and Criteria
CHAPTER 3
METHODOLOGY
3.1 Introduction
3.2 Preparing Test RigIExperimental setup
3.3 Lubricant of Gearbox
3.4 Instrumentations
3.5 Procedure and equipment
CHAPTER 4
ANALYSIS
4.1 Introduction
4.2 Rotational speed of output and input rotor
4.3 Vibration analysis
viii
4.5 Viscosity
4.6 Worm Gear Surface
4.7 Thermograph
CHAPTER 5
CONCLUSIONS
5.1 Introduction
5.2 Conclusion
REFERENCES
APPENDIX A
APPENDIX B
APPENDIX C
APPENDIX D
CHAPTER 1
INTRODUCTION I
1 1 Introduction
Industrial operations are much depending on the rotating equipment to ensure continuous
plant operation or production performance. The internal mechanical parts which have
widely contributed to a major breakdown in rotating equipment are known as gears and
bearings. On the other hand, lubricants are another factor to be considered as to ensure
the performance of gears and bearings are within optimum operating conditions. Any
unscheduled breakdown can easily burst the maintenance cost, lapses in production
schedule and even interfere the human casualties. As to minimize the unscheduled
breakdown, a proper maintenance practice and monitoring systems are required to detect
faults in the early stages and provide alert notification to the operators. The capabilities of
Condition Monitoring Systems provided it has been conducted correctly could extend the
life span of the rotating equipment. These could also reduce the maintenance cost and
avoid catastrophic failure to the gears and bearings.
Vibration and temperature monitoring are the techniques for machinery
techniques have their unique advantages and disadvantages associated with the
monitoring and fault diagnosis of machinery. When these techniques are conducted
independently, only a portion of machine faults are typically diagnosed. However,
practical experience has shown that by integrating these two techniques in a machine
condition monitoring program will provides better and more reliable information,
bringing significant cost benefits to industry.
1.2 Problem Statement
I
Gearboxes are classified as the rotating equipments at any industrial applications
worldwide and play an important role to the industrial performance. The major internal
components of the gearboxes are mainly named as shaft, gear, bearing and seal. The
challenge is now to seek further significant improvement in the technology and prolong
the life span of the internal component. The issue of wear and tear of the gears and
bearing are much related to the lubricant performance. Failures associated with gears
typically caused by gradual deterioration and wear. Such deterioration probably could
happened when rotating equipment are working within a condition of excessive load,
excessive vibration, high temperature, lack of lubrication or contaminated lubricant. Such
degradation process can be identify if a proper condition monitoring techniques is used to
detect and give sign of early warning.
Vibration and temperature monitoring are the most regularly measured condition
parameter in rotating machinery, and it is continuously monitored in many important
applications. The commonly monitored vibration parameters are displacement, velocity,
and acceleration Books and references of vibration analysis to gear fault diagnosis are
widely available, however in contrast there is limited references and information
pertaining to the monitoring of worm gearboxes performance. From the previous study,
Worm gearbox normally consist of one step speed reduction mechanism but capable for
higher reduction ratio. Worm gearbox could be both slow speed and high speed rotating
parts internally. Since the vibration analysis could predict the gear failure effectively, the
application need to be extend to the output shaft of worm gearboxes which typically has
great speed reduction compared to the input shaft. The limitation of vibration analysis to
low speed rotating machine has been described in Condition Monitoring of Worm Gears
(Elforjani et al., 2012). Further study still need to be conducted to analyse the correlation
between vibration, worm gear speed, lubricant characteristic and temperature.
1.3 Objective
The objective of this experiment is to characterize worm gears vibration behavior tested
with contaminated lubricant provided new oil as a baseline value. The analysis to be
extended up to the lubricant temperature and seek correlations within mechanical
vibration. t .
1.4 Scope of study
Scope of this study is to investigate the correlation between vibration and temperature
behavior within different gear oil viscosity characterisation. In order to obtain this, this
research will cover the following:
(i) Proposed the proper experimental rig to be set up related to vibrations
issues.
(ii) Study the viscosity classification of gear oil and preparing samples of
(iii) To investigate different operating conditions of an experimental rig,
consisting of a worm gearbox driven by an inverted electric motor.
(iv) To perform experimental test to obtain both data.
(v) To assess the sampling oil analysis charact
(vi) erisation for the contaminated oil.
(vii) To analyze the data and find the correlations of mechanical vibration and temperature.
1.5 Expected Result I
From the experimental rig, the worm gearbox will initially run under normal operating
conditions as a comparative test. A series of tests were then conducted corresponding to a
different input speed using the same contaminated lube oil. Vibration data will be
regularly collected but the temperature will be continuously captured using the PicoLog
Data Logger. The data produced by the PicoLog will ba compared with the vibration
spectra, in order to quantifl the effectiveness of the two condition monitoring techniques.
The results from this experiment will reveal more understanding on the dependent and
independent roles of vibration and temperature in predicting and diagnosing machine
faults.
The anticipated key issues will be pointed out in order to produce good condition
monitoring practise for worm gearbox. A prediction of gear oil failure and lifespan are
much depending on few characterizations. These are:
(i) The correlations of mechanical vibration and temperature will be much depending on operation speed.
1.6 Potential Contribution
So far, vibration-based condition monitoring of a worm gearboxes has been mostly
studied on the wear pattern. An attention to run the gearboxes with contaminated gear oil
need to be done to monitor the worm gear vibration behavior. Therefore, the first step in
successfully implementing of condition monitoring of worm gear is to establish the base-
CHAPTER 2
2.1 Introduction
Diagnosis and fault detection of gear transmission systems have attracted wide attention
in order to reduce breakdown in the industrial rotating m&hinery. Some researches had
been done as to develop the understanding and correlations of contaminated gear oil
which generally will contributed to gears failure. Introducing a proper condition
monitoring techniques will surely extend the life span of the rotating equipment.
Most of the industrial practice are much rely on the vibration spectral data
analysis as a primary tools for assessing machine condition beside to some others
predictive tools which available in the market (Yu, 201 1). In order to produce proper
report of individual machine, a scientific approach need to be considered. All the data
gathered by the analyst will be examined along with their deviation comparing to the
appropriate baseline values (Watts, 201 1). At the end, both parties which are end users
and analyst need to understand that the collected data are all facts but the resulting
diagnosis and or repair recommendation may be speculation. Some of the predictive tools
2.2 Condition Monitoring Techniques
The condition monitoring techniques philosophy consists of scheduling maintenance
activities only when a functional failure is detected. Mechanical and operational
conditions are periodically monitored, and when unhealthy trends are detected, the
troublesome parts in the machine are identified and scheduled for maintenance. The
machine would then be shut down at a time when it is most convenient, and the damaged
components would be replaced. If left unattended, these failures could result in costly
secondary failures. One of the advantages of this approach is that the maintenance events
can be scheduled in an orderly fashion. It allows for some lead-time to purchase parts for
the necessary repair work and thus reducing the need for a large inventory of spares.
Since maintenance work is only performed when needed, there is also a possible increase
in production capacity. A possible disadvantage is that maintenance work may actually
increase due to an incorrect assessment of the deterioration of machines. According to
(Serrato et al., 2007), 50-80% of bearing components faults are related to deficient
lubrication, resulting from inadequate lubricant use, lack or excess of lubricant. To track
k
the unhealthy trends in vibration, temperature or lubrication requires the facility to
acquire specialized equipment to monitor these parameters and provide training to
personnel (or hire skilled personnel).
Various condition monitoring methods can be used for the diagnosis gearbox and
gear failures. The methods are namely classified as vibration analysis, oil sampling
analysis, thermograph monitoring, acoustic monitoring and electric motor current
monitoring. Figure 1 below shows the summary of types and causes of gear failures.
SUMMARY
OF
TYPES 8 CAUSESOF
GEAR FAILURES...
Breakage. total 61.2
...
Fatigue breakage. teeth. .32 .8
Fatigue beakage. bore
...
.4.0...
Overload breakage. teeth 19.5 ... Overtoad breakage
.
bore .O.%...
Chipping. teeth 4.3
...
Surf- fatigue. total 20.3
pitltins
...
7.2...
SpalUllg .8.8
...
Pitling and spallirpg .6.3
...
Wear. Wal 13.2
...
Abrasive wear 10.3
...
Adbslve wear 2 9
...
Plastic flow. btal 6.3
...
Sewk-related causes, total 74-7
...
Improper assembly 11.2
...
Improper hlbrication 16.0
...
Contlnvd overloading 25.0
...
lrrpac-3 loading 8.9
...
Bearing failum 10.7
...
M i n material 1.4
...
Operator error .0.3
...
Abusive handling 1.2
t
...
Heat treatment. total 162
...
Excessive core hardM6S - 0 - 5... Insufficient core hardness 2 0
...
Excassive case depth .1.8
...
InsuMciea m e depth .4.8
...
Improper hardening 5.9
...
1rnproper tempering 1.0
...
Distodbn .0.2
...
Design-related causes. tdal. 6.9
...
Inproper design 2.8
...
lrrylpoper material selectton l.6
. . . .
Speciiiatiwl of unsuitatzle heat treatment 2.5
...
Manutmuring-@Wed causes. total 1.4
...
Grinding bums 0.7
Twt marks or mzsihes
...
0.7Material-related causes. toad
dl...-...
0.8. . .
Forging defects 0.1
...
Steel defects 0.5
... Mixed steel wrong compositlan 0.2
7!1%
can be 4nf1m by CUStamer
Figure 1 : Summary of types and causes of gear failures. (MTII Troubleshooting Gear
2.2.1 Vibration Analysis
Vibration analysis is the most widely used to predict rotating machinery failure in the
industrial application. Vibration analysis is often done based on the bearing vibration
signal measured by an accelerometer, usually piezoelectric sensor which convert the
vibration signal to electrical signal. Since the abnormal vibration of rotary machines is
the first sensory effect of rotary component failure, vibration analysis is widely employed
in the industry. The fault vibration signal generated by the interaction between a damaged
area and a rolling surface occurs regardless of the defect type. Consequently, a vibration
analysis can be employed for the diagnosis of all types of fAults, either localized or
distributed. Furthermore, low-cost sensors, accurate results, simple setups, specific
information on the damage location, and comparable rates of damage are other benefits of
the vibration measurement method.
2.2.2 Oil Sampling Analysis
The interpretation of oil sampling analysis method is based on the presence of metallic or
wear particles in the sampling lubricant collected (Wang, 2008). One of the most
common and simplest methods to apply the oil debris monitoring techniques is the
magnetic sump plug. The magnetic plug will captured the metallic debris fiom the
lubricant oil path flow. The amount of metallic debris captured will represent the wear
trend of the machine provided it has the baseline information. The limitations of wear
debris magnetic sump plug method are only on the metallic debris and not extend to the
other wear component such as seals and glands. To overcome the situation the oil
sampling analysis can be conducted, where the spectrographic analysis of the different
metallic elements and other wear components in the lubricant could be extracted and
would able to facilitate the location of the fault. The another enhanced method of wear
lubricating oil and grades particles by size and magnetic susceptibility on glass slide.
However the interpretation of the results is subjective and the ferrographic method cannot
be applied for on-line application, (Whittington et al., 1992) and (Roylance, 2005).
2.2.3 Thermograph Monitoring
Another method of condition monitoring is thermograph. Any defects occurred at bearing
or gears in the rotating equipment will generate excessive heat that would be easily
detected by the thermograph devices. Monitoring the temperature of a bearing housing or I
lubricant is the simplest method for fault detection in rotary machines.
Taking an example of mineral base gear oil which will begin to oxidize at
temperatures that consistently run at 7 1 "C, (MTII Troubleshooting Gear Drives 2008)
.
Afew parameters that will contribute to increase the gear oil temperature are excessive
sludge, low lubricant levels, oil contamination, bearing failure or damaged gear teeth.
Monitoring temperature differences at multiple gearbo~, thennograph devices will
display various heat image contour. The most problematic gearbox will have the
indication of high temperature which mainly due to lubricant, bearing and gears.
2.2.4 Acoustic Monitoring
The most effective acoustic-based bearing health monitoring is acoustic emission. It is a
transient impulse generated by the rapid release of strain energy in solid material under
mechanical or thermal stress (Vladimir, 1999). The detection of cracks is the prime
application of acoustic emission; therefore, this technique can be used as a tool for
sound can also be employed for detecting defects in bearings. Typically, the accuracy of
these methods depends on sound pressure and sound intensity data
2.2.5 Electric Motor Current Monitoring
The operating conditions of a machine can be monitored by analyzing the spectrum of the
motor current. The changes in the electric background noise are associated with the
changes in the mechanical components of the machine; therefore, fault signatures can be I
detected by motor current signal processing techniques.
2.3 Industrial Gearboxes
There are variety of gears composition and arrangement ak to meet the industrial needs.
Engineer has to put their kind attention to select the best gears arrangement either to
serve load, speed or direction. Figure 2 shows type of gears and some of the gears
: ~ 1 Sau; g a r (b s Rack and pInE?n
[image:17.525.128.439.61.633.2]f;b hiitpi ;ra+ I h I b2c~~ 1 1 1 ~ Z I I
2.3.1 Worm gear
A worm gear as shown in figure 3, consists of a spirally grooved screw moving against a toothed wheel. In this gear type, where the load is transmitted across sliding, rather than
rolling surfaces, compounded or EP oils are necessary to provide effective lubrication.
Worm gears operate under difficult conditions, presenting unique lubrication
demands. Worm gears are used in various industries and machinery applications. They I
are unique in their ability to achieve large speed reductions in a compact space. They can
transmit high loads at high-speed ratios. Ratios of 20:l up to 60:l and higher are
normally achieved.
There are three major types of worm gears:
(i) Non-throated - a helical gear with a straight worp. Tooth contact is a single
moving point on the worm drive. This leads to high unit loads and wear
(ii) Single-throated
-
has concave helical teeth which wrap around the worm. This leads to line contact, permitting higher loads without excessive wear.(iii) Double-throated
-
called a cone or hourglass. It has concave teeth both on the worm and helical gear. This increases from line contact area permitting [image:18.527.152.377.548.685.2]increased loading and lower wear.
Worm gears are commonly use in transmission design where its needs a compact,
high reduction and relatively low speed output (Sharif, 2006). Prediction of the wear
pattern in worm gears. The normal combination of hard/soft material is necessary as to
avoid scuffing since a high degree of sliding between tooth wheel and worm gears are
present. The usual configuration is hard steel for worm and a softer material like bronze
for wheel, but then the wear rate of bronze gear teeth is much higher- than that which
might be expected in conventional gearing systems. Anyway, the worn off bronze gear
can be replaced with a new one using the process of "bedding in
".
2.3.2 Planetary Gear Transmission System
Planetary gearboxes are typically used in applications requiring a large reduction in speed
at high loads, such as the final reduction in the main rotor gearbox of a industrial huge
stirrer tank. A typical planetary reduction gearbox has three or more planet gears each
meshing with a sun and a ring gear. The planetary gears are mounted onto the planetary
carrier and contained within an internal toothed ring gear. Drive is provided via the sun
gear, the ring gear is stationary and the axes of the planet gears are connected to a carrier
which rotates in relation to both the sun gear and ring gear. The planet carrier provides
the output of the planetary gear train. A single stage planetary gearset normally will
consists of a sun gear, a ring gear, several planets and a carrier.
2.3.3 Parallel Gear Transmission System
The parallel gear system consists of a pinion gear and a driven gear. The pinion gear has
a smaller number of teeth than the driven gear. Normally, a gear transmission system is
speed reduction gear transmission system, the pinion is connected with an input shaft,
and the driven gear is connected with an output shaft.
2.4 Lubricant
As a general rules, oil temperature of enclosed gear drives should never exceed 89 "C -
93 "C and the best service will be obtained with at temperatures in a range of 50°C -
60°C (MTII Troubleshooting Gear Drives, 2008).
2.4.1 Lubricant Viscosity Classification
Through the years, lubricant users have been treated to a number of ways to designate
viscosity grades of the lubricants used in manufacturing. They are:
t
(i) SAE (Society of Automotive Engineers) grades for gear oils and crankcases (engines)
(ii) AGMA (American Gear Manufacturers Association) grades for gear oils (iii) SUS (Saybolt Universal Seconds)
(iv) cSt (kinematic viscosity in centistokes), and (v) absolute viscosity
(vi) IS0 VG (International Standards Organization Viscosity Grade)
Viscosity is the measure of the oil's resistance to flow (shear stress) under certain
conditions. To simplify, the oil's viscosity represents the measure for which the oil wants
to stay put when pushed (sheared) by moving mechanical components. Some of the oil
There are two viewpoints of the resistance to flow that the machine designer is
interested in. One is the measure of how the fluid behaves under pressure, such as a
pressurized hydraulic line. This property is called absolute viscosity (also known as
dynamic viscosity) and is measured in centipoises (cP). The other consideration is how
the fluid behaves only under the force of gravity which is called as centistokes. The two
are related through the specific gravity of the fluid. To determine the centipoise of a fluid
it is necessary to multiply the viscosity of the fluid times the specific gravity of the fluid,
or measure it directly using an absolute viscometer. For the practitioner of industrial
lubrication, the centistoke is the measure that will occupy most of our attention.
Kinematic Viscosities
cst cst
@4WC @tWC AGMA Grade
S AE Crankcase
[image:21.526.97.431.287.654.2]Saybolt Viscosities
Figure 4: Comparative Viscosity Classification
2.4.2 The Impact of lubricant on mechanical vibration
The thicker the oil thickness causes the level of vibration decrease. Author (Serrato,
(2007), focus on three different viscosity grade (IS0 10, 32 and 68). Different I S 0 grade
viscosity or temperature variation changes the vibration of the roller bearing. Previous
study shows that oil temperature is proportional to the viscosity degree. High fiction
force (high viscosity) is related high loss of energy resulting in high heat generation. The
low viscosity lubricants cause high vibration level.
Faults on roller bearing found because of 50-80% related to deficient lubrication,
inadequate lubricant use, lack of lubricant, lubricant aging and presence of solid or liquid
contaminant. The vibration energy of a bearing depends on surface irregularities, external
loading, running speeds and lubricant viscosity. Lubricant viscosity causes reduction in
vibration energy.
The vibration level is smaller as oil viscosity degree becomes higher, in contrast
t
to the effect of temperature on oil viscosity. The testing time is major factor for gradual
decrease in film thickness. Oil film thickness becomes smaller when the viscosity grade
is changed to smaller values. Higher bearing vibration causes of smaller film thickness
which related to lower oil viscosity.
According to author (Sharma et al., 2008), the oil temperatures are maintained
within the recommended range. When the particles come in contact with high-
temperature zones these lead to formation of hard and abrasive particles. These on
contact with the components cause generation of wear particles causing W e r reduced
system performance. Therefore, to control wear and for increased performance, viscosity
2.4.3 Contamination Effect
Oil and wear debris analysis have proven in many instances to be a leading
indicator compared to vibration analysis to identify wear mechanisms and wear modes
present in a machine (Roylance, 1999). There are numerous types of wear mechanisms
such as adhesion, abrasion, fatigue, corrosion, erosion, and fretting. cbmmon examples
of failure modes include contamination, lubricant degradation, oxidation, load, and speed.
Wear debris analysis is the study of the chemical composition, colour, concentration, size
distribution and morphologies of wear particles. A particular wear mechanism typically
generates one or several types of wear debris, which can /be identified by their
characteristics (Kannan, 2003). There are six common particle types that are typically
found within machinery, corresponding to rubbing, cutting, laminar, fatigue, severe
sliding and spherical particles. For each particle type, there may be variations in size,
concentration, surface texture and colour depending on the severity, the rate of wear and
material source. Both vibration analysis and wear debris analysis have their unique
advantages and disadvantages associated with the monitoring and fault diagnosis of
machinery (Peng, 2010). For instance, vibration analysk is very adept at detecting
resonance. However, it is difficult to apply vibration analysis to monitor low speed
machinery (less than 5 rpm).
2.4.4 Identifying lubricant Contamination
If contamination is suspected, a sample of oil can be obtained in a translucent glass ware,
which is then allowed to sit overnight. When the glass ware is turned over, any
contaminant will remain visible on the bottom surface of the glass. Water contamination
in the lubricant can also be determined very quickly by placing a few drops of oil on a hot
plate. If the oil drops crackle or sizzle, there is water present. In many cases, any water, if
contamination by dirt, water or wear metals appears to be excessive, laboratory oil
analysis should be carried out to identify the wear element.
2.4.5 Lubricant Life Time
According to author (Goncalves et al., 2006), they are research about most important in
the maintenance of reducers are vibration analysis and wear particles. Lubricants
subdivided into mineral oil, additiveted oil and synthetic oil. Small changes in viscosity
I
will be affect temperature and the lubricant no longer able to provide full performance.
According to author (Goncalves et al., 2006), there are several test to identify
viscosity changes such as acid number (AN) and Fourier transform infrared spectroscopy
(FTIR) to conform incipient oxidation. Sign of water, soot or glycol ingress identify from
contaminant test. Ultracentrifuge test or gas chromatography (CG), to identify a change
in base oil chemistry. There are three types of data reading from graph.
(i) The pick to pick value. It is measured the maximum amplitude of the fundamental
wave that is useful.
(ii) Crest value (or pick value). It is measured short duration.
(iii) Effective value. The evaluation of the value of harmonic components directly
related to the vibration energy content
According to (Goncalves et al., 2006), fresh oil (IS0 320) was work for more 504
hour. When the previous oil replaced by IS0 150 was put to work 672 more hour and
vibration measures and oil samples were collected weekly. The result shows
inappropriate viscosity will cause problem in parts where vibration need more
Based on (Brouwer et al., 2012), the density of lubricants continuously changes
due to changes particle contain and temperature. Dynamics viscosity is true indicator of
oil quality. The film thickness of lubricants in an engine is governed by the oil viscosity.
Over the lifespan of the engine oil, the viscosity of the lubricant changes due to excessive
heat, soot, engine debris, and fluids such as antifreeze and fuel.
The analysis by (Amarnath et al., 2007) has concluded that film thickness
between lubricated contacts is very complex. It involves two rough surfaces in relative
motion separated by a lubricant film. This film, when subjected to high contact pressure
and sliding, due to difference in surface velocities and increase in temperature, undergoes
a change in its physical properties. Under typical operating conditions, the lubricant film
separating the contacts is very thin, usually of the same order of magnitude as the surface
roughness, which may cause breakdown of the lubricant film. This drastic fall in
lubricant film thickness is responsible for gear failure modes, micro- pitting, macro-
pitting, gear staining, scuffing and mild wear.
2.4.6 Oxidation in Lubricant
It is often difficult to determine if a gear lubricant is becoming discolored because gear
lubricants are normally very dark in color after some time in service. However if
discoloration is obvious, particularly if the gear drive has been running at high
2.4.7 Oil Analysis
Although there are many and varied analysis tests available, the tests necessary to
determine gear lubricant condition must include viscosity and acid number. Generally, an
increase of 10% or more in viscosity is an indication that the lubricant has reached the
end of its useful life. The general rule for acid number result is if the acid number has
doubled that of new oil, the lubricant has reached the end of its useful life. Increases in
viscosity and acid levels are definite indicators of oxidation, which suggest that sludge
and varnish will develop and flow will be reduced.
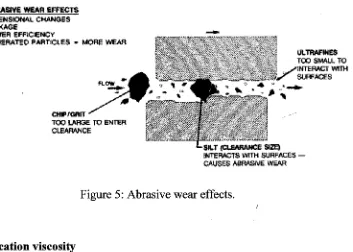
2.4.8 Wear particle analysis for machine condition
The most common technique for wear particle analysis is spectroscopic analysis which is
used to indicate the levels of ultra-fine particles in the 5-7pcrometer range. (Figure 5.)
Usually reported in parts-per-million (ppm), these particles include, among others, iron,
copper, aluminum or chromium, which indicate the metallurgical makeup of gear or
bearing components in a gear drive. This analysis also indicates the various levels of
metallic additives, such as phosphorus and zinc, which indicate typical extreme pressure
and anti-wear additives which may be present in the lubricant. Another element reported
may be silicon, which is an indicator of ingested dirt. It is important for operators of gear
drives to understand that these levels of wear metals are the result of wear, not
necessarily the cause of wear. These ultra-fme particles will reach certain levels in every
lubricated machine and unless there is a dramatic increase in one or more of the elements,
or a sudden change in overall wear rates, no action is deemed necessary. In other words,
the spectroscopic analysis results reported in ppm are not as important as are changes or
AEftA81VE WEAR EFFECTS
DIMENSKIN&L CHhNGES
L V ' t r n U E LXIwER EFFIC-Y
DSMERAtEO PARTICLES = MORE WAR
~AITEFL\CTS WITH SURFACES -
[image:27.526.105.458.67.319.2]CAUSES A B M V E WEAR
Figure 5: Abrasive wear effects. I
2.4.9 Lubrication viscosity
While selecting lubricant for an application there are two aspects to be considered which
are, the factors concerning engineering requirements and the factors concerning to the
service condition. Engineering requirement is more to tha proper selection of viscosity
grade while the service conditions factors are more to the selection of proper additive
package for the lubricant. The factors concerning to the engineering factors may include
load, speed, surface finish of the interacting surface and rise in temperature. According to
(Su et. al, 1992) concludes that vibration energy of a bearing depends on surface
irregularities, external loadings, running speed and lubricant viscosity. The viscosity of
the lubricant at the working temperature, load and the relative velocity of the interacting
surface have predominant effect in formation of thick film as to prevent direct contact
between the surface. Hence, a minimum viscosity oil grade is required in order to select a
proper lubricant to match with working temperature and relative velocity between the
interacting surface.
The problem exposed by the service condition of the application is addressed by
Different additive combinations are used for providing protection against rusting,
oxidation, scuffing and corrosion. The can also facilitate quick separation of water,
formation of uniform and stable emulsion as well as facilitate collapse of foams
whenever required.
2.5 Theory
2.5.1 Introduction I
Vibration analysis in particular has for some time been used as a predictive maintenance
procedure and as a support for machinery maintenance decisions as referred to several
readings. As a general rule, machines do not break down or fail without some form of
warning, which is indicated by an increased vibration level. By measuring and analysing
the vibration of a machine, it is possible to determine bot&the nature and severity of the
defect, and hence predict the machine's failure. The over- all vibration signal from a
machine is contributed from many components and structures to which it may be
coupled. However, mechanical defects produce characteristic vibrations at different
frequencies, which can be related to specific machine fault conditions. By analysing the
time and frequency spectrums, and using signal processing techniques, both the defect
and natural frequencies of the various structural components can be identified.
2.5.2 Detection Defects with Vibration analysis
Gears generate a meshing frequency equal to the number of teeth on the gear, multiplied
bearing frequency will not appear unless a bearing problem exists, gear mesh frequencies
will "always" be present even if the gear train is in good condition.
Gear drives with parallel shafts upon which are mounted one gear only will
always have only one fiequency. Double or multiple gear reduction units which have
more than one gear per shaft may have several different gear mesh frequencies and it is
for this reason that maintenance personnel should be familiar with the design and
construction of the gear drives in service, particularly shaft speeds and the number of
teeth on each gear. In order to monitor the rotating equipment, a few information should
be gathered which are:
/
1. A sketch of the gear drive noting the number of shafts, corresponding shaft speeds
and the number of teeth on each gear.
2. The bearing types and part numbers for all shaft support bearings.
3. The marked location of all measurement points (axial, radial and vertical) from
which vibration data can be obtained at bearing caps and shafts.
i
Gear drives are designed to maintain a constant velocity ratio between the gears.
A good gear combination requires that the normal to the common tangent at the contact
point between two gears passes through the pitch point which lies on the center to center
line of the two gears. Any variation may cause high vibrations due to poor machining,
contact wear, improper gear backlash, or any problem that would cause gear tooth
profiles to deviate from their proper geometry.
Gear mesh frequency is often affected by process variables such as changes in
loads and/or speeds and this frequency is modulated by sidebands indicating a problem.
When sidebands reach '/z the amplitude of the gear mesh fiequency, it indicates that the
REFERENCES
Arnamath.M., Sujatha.C., Swarnamani. S
.,
(2007). Experimental studies- on the effect ofreduction in gear tooth system, Tribology international, 42, pp.340-352.
BLP, (2012),. Boetech Lubricate Product
-
Data SheetBrouwer, M.D., Gupta, L.A., Sadeghi, F., Peroulis, D., Adams, D., (2012). High
temperature dynamics viscosity sensor for engine oil application, Sensors and
Actuators A:Physical, 173,pp. 102- 107.
Elforjani, M., Mba, D., Muhammad, A. Sire, A., (2012). Condition monitoring of worm gears.
Ghafari, S.H., (2007).A Fault Diagnosis System for Rotary Machinery Supported by
Rolling Element Bearings
4,
Goncalves, A.C., Cunha, R.C., Lago, D.F., (2006). Maintance of a reducer by vibration
and wear particles analysis, Applications and case study, 12, pp 1 1 8- 1 32.
Infrared Training Center, (2010). Themography Level 1 Course Manual
Myszka, D.H., (2012). Machines & Mechanisms Applied Kinematic Analysis.
Kanaan, H.Y., Al-Haddad, K., Roy, G.,(2003). Analysis of the electrochemical vibrations
in induction motor drives due to the imperfections of the mechanical transmission
system, Mathematics and Computers in Simulations, 63, pp.421-433.
Peng.Z., Kessissoglou.N.J., Cox.M., (2005). A study of the effect of contaminat particles
in lubricants using wear debris and vibration condition monitoring technique,
Roylance, B.J., Hunt, T.M., Wear Debris Analysis, Coxmoor Publishing Company,
Oxford, UK, 1999.
Serrato.R., Maru.M.M., Padovese.L.R.,(2007). Effect of lubricant viscosity grade on
mechanical vibration of roller bearings, Tribology International, 40, pp.1270-1275.
Sharif, K.J., Evans, H.P., Snidle, R.W., (2006). Prediction of the wear pattern in worm gears
Sharma, B.C., Gandhi .O.P., (2008). Performance evaluation and analysis of lubricating oil using parameter profile approach, Tribology International, 60(3), pp. 1 3 1
-
137.Su YT, Sheen YT, Lin MH, (1992). Signature analysis of roller bearing vibrations-
lubrication effect, Proceeding of the Institution of Mechanicbl Engineers Part C. J
Mech Eng Sci 1992;206
The Practical Handbook of Machinery Lubrication, 3rd Edition, L. Leugner, PP 63-69,
Vladimir, V., (1999). Detection and quantification of the gear tooth damage from the
vibration and acoustic signatures
C
Wang, R.Y., (2008) Bearing Fault Detection and Oil Debris Monitoring by Adaptive
Noise Cancellation
Watts, W., (20 1 1). Machinery vibration analysis - Facts V.S. Speculations
Whittington, H.W., Flynn, B.W., and Mills, G.H., 1992, An online wear debris monitor.
Measurement Science and Technology, vo1.3.
Yu, J., (201 1). Early Fault Detection for Gear Shaft and Planetary Gear Basedon Wavelet