Journal of Chemical and Pharmaceutical Research, 2019, 11(5):33-48
Research Article
CODEN (USA): JCPRC5
ISSN: 0975-7384
33
Nutritional, Biochemical and Histological Studies on the Effect of Inulin in
Chicory Roots on the Immune System of Male Rats
Fathy M Hassan
1, Alim F Alim
2, Ola S Ibrahim
1and Akmal S Gaballa
1*1Faculty of Specific Education, Zagazig University, Zagazig, Eygpt 2Faculty of Veterinary Medicine, Zagazig University, Zagazig, Eygpt
____________________________________________________________________________
ABSTRACT
In this research, the powdery dried chicory roots and pure inulin are used as food additives, separately to improve
the functions of the immune system disorders in forty male albino rats through the existing content of inulin. The
obtained experimental results after feeding for 42 days showed that the body weight gain, feed intake and feed
efficiency ratio of chicory roots (10%) group was the best in comparison to all other groups. Immunoglobulins
(IgM, IgG and NO) analyses recorded high significant differences between (-ve) and (+ve) control groups and all
the treated groups. The best IgM value (77.692 and 99.612 mg/dL) was recorded for chicory roots 10% and pure
inulin 1.0% with significant differences in comparison with (-ve) and (+ve) control group respectively.
Histopathological studies showed the liver portal triads were apparently normal with a few round cells infiltration,
Kidneys were apparently normal with preserved nephrons histomorphology and apparently normal spleen with
preserved lymphoid population of white pulp and normal sinusoids and lympho-reticular network of red pulp in
chicory roots (10%) group. The obtained results recommended using chicory roots (10%) in the production of
functional and medicinal food to enhance the nutritional quality and the physiological status of the formulated food.
Keywords: Chicory roots; Immune system; Inulin; IgM; IgG; NO; Liver; Kidney; Spleen
_____________________________________________________________________________
INTRODUCTION
The immunity may be categorized into subsystems, collectively with the innate immunity (naturally) and the
adaptive immunity (artificially) [1]. Immune system troubles can bring about maximum cancers, autoimmune
ailments and infections. Immune deficiency occurs even as the immune machine is a whole lot much less energetic
than conventional, or whilst the usage of the drug immunosuppressive [2]. Dexamethasone is Corticosteroids its
biologically energetic synthetic derivatives, further to its use in a spread of inflammatory ailments and autoimmune
ailments make it a number of the most commonplace pills [3]. Inulin is a heterogeneous aggregate of fructose
34
after starch it consists of 40 devices of fructose (β-form) associated with each different via (β-2→1 linkage) and
mayended with one glucose unit [5]. Inulin in flora plays an essential issue in abiotic pressure tolerance, and
itsosmoregulatory characteristic can defend plant life from drought, salt and cold stresses [6,7]. Inulin turn out to be
decided in masses of plant life like artichoke leaves are optionally to be had alternatives due to their full-size content
material cloth [8], agave, onions, leeks, plant trovh, garlic, wheat and asparagus [9]. Usually, inulin is extracted
commercially from chicory [10]. Currently, the essential approach for inulin extraction from flora is precipitation
through the usage of ethanol [11]. Chicory (Cichorium intybus) perennial herb of the asteraceae circle of relatives is
nearby to the Mediterranean region, mid Asia and northern Africa. Historically, chicory has become grown by
means of manner of the historical Egyptians as a medicinal plant in the treatment of some diseases [12]. Previous
studies have showed that the chicory roots have various medicinal homes. It is antioxidant [13,14], anti-maximum
cancers cancers [15], antimicrobial [16], antifungal [17], anti-inflammatory [18], anti-malarial [19], anti-allergy
[20], anti-hepatotoxicity [21] and antidiabetic [22,23].
This research, aimed to study the effect of inulin on the immune system and improve the body's functions, through
the use of chicory roots as a rich source of inulin and pure inulin, conducting chemical analyses of this plant, fatty
acids, flavonoid compounds. Male albino rats will be fed with different concentrations of these powdery dried plants
and pure inulin. Also, studing the effect of dexamethasone on the immunosuppressive in male rats by measuring the
levels of different immune proteins and other immunological parameters.
EXPERIMENTAL SECTION
Chemicals
The used chemicals and reagents in this study are of highest analytical grade. Pure inulin, Ethyl alcohol formalin and
all other chemicals were purchased from Industrial and Pharmaceutical Chemicals Co., Sharkia, Eygpt.
Dexamethasone was injected as solution (3 ampoules of 2 mL); Eash ampoule contains 8 mg and it was purchased
from Amriya for Pharmaceutical Industries, Alexandria, Egypt.
Plant Material
The roots of the chicory plant were obtained from a plantation in the new Salhiya city in Al Sharkia, Eygpt. Chicory
roots were well cleaned, then cut and dried under vacuum then, milled by innovative mill to give a fine powder.
HPLC Analysis of Flavonoids Compounds
This analysis was performed for the detection and quantification of particular flavonoids compounds present
following a modified method [24]. HPLC analysis was carried out using an Agilent 1200 series equipped with
quaternary pump, auto sampler and column comport ant set at 35°C, malti ware length detector set at 330 nm, 280
nm for detection of flavonoids compounds and phenols compounds, degaser column used for fractionation Zorbax
ODS, 4.6×250 mm and the flow rate of mobile phase during run was 1 mL/min.
Detection of Inulin and Sugars
Sugars standards all with a purity exceeding 99.0% were purchased from Sigma-Aldrich Chemicals Co. (St Louis,
35
Sample PreparationSamples were diluted 1:10 (w/v) as method described earlier [25] with deionized water and then filtered through a
0.22 μm filter membrane. An aliquot of 1.5 mL of these solutions was placed in vials for the analysis.
Equipmentand Operating Conditions
The chromatographic system Agilent (series 1200) coupled to the refractive index detector was equipped with a
quaternary pump, degasser and auto injector. The chromatographic data were acquired using the Agilent software.
The samples obtained as described above were analyzed using an Aminex-carbohydrate HPX-87 column under
isocratic condition with deionizes water. The flow rate was 0.5 mL/min. The column temperature was maintained at
85 °C and the detector at 50 °C. Sample detection was performed by comparing retention time's standards.The
chromatographic conditions according toa study [26] with some modifications.
Animal Selection
Forty normal male albino rats of Spargue Dawley strain, weighting 180 ± 5 g were obtained from Faculty of
Veterinary Medicine, Zagazig University, Eygpt. Each 5 rats were housed in stainless steel cage under controlled
condition. Diets were fed to rats in a special non-scattering feeding cup to avoid loss of food and contamination. Tap
water was provided to rats by mean of glass tubes projecting through wire cage from inverted bottles supported to
one side of the cage. Experimental animals were divided into two main groups as follows:
The first main group (5 rats) was fed basal diet for 6 weeks and was used as a negative control group.
The second main groups (35 rats) were fed basal diet with immunosuppressive (by dexamethasone intrapertoneal
injection. Each rat was injected by weight 7 times at 7 days; In addition, 10 mg/kg was administered to one of the
groups on the 8th [27]. Then the second main group was divided into seven sub groups (5 rats in cage)
Sub group (1) was fed basal diet for 6 weeks and used as a positive control group.
Sub groups (2, 3 and 4) were fed basal diet supplemented with 5, 10 and 20 g of powdery dried Chicory roots per
100 g diet for 6 weeks, respectively.
Sub groups (5, 6 and 7) were fed basal diet supplemented with 0.5, 1.0 and 2.0 g of standard pure inulin per 100 g
diet for 6 weeks, respectively.
Collection of Samples
At the end of experimental period, Rats were fasted for 12 hours and sacrificed under diethyl ether anesthetized.
Blood samples were collected in clean dry centrifuge tube from the hepatic portal vein. A part of blood was taken in
heparinized plastic vial and analyzed immediately to have a complete blood count (CBC). After that samples were
centrifuged at 4000/min, Serum separated in clean glass well-stoppered and stored at (20°C) until analyzed.
Estimation
Blood (5 mL) was collected from the vein at the beginning and end of the experiment. Erythrocytes and plasma were
separated, plasma glucose [28], serum urea nitrogen [29], serum creatinine [30,31], WBC count, Hb, RBC count,
Platelet counts (PLC) were estimated the results of CBC [32], determination of IgM and IgG [33], Nitric oxide (NO)
36
Statistical AnalysisStatistical analysis was expressed as mean ± SE. The data were statistically analyzed by completely randomized
design with [36] in relation to the following model: Yij=µ+Ti+Eij where, µ is the overall mean, Ti is the fixed effect
of ith treatments, and Eij is the random error. Means were tested for significant differences using Duncan's Multiple
Range test [37].
Histopathological Investigations
Small specimens of the organs liver, kidneys and spleen were taken from the experimental animals, fixed in neutral
buffered formalin, dehydrated in ascending concentration of ethanol (70.80 and 90%), cleared in xylene and
embedded in paraffin. Sections of (4-6) µm thickness were prepared and stained with hematoxylin and eosin
according to the method of a study [38].
RESULTS AND DISCUSSION
Chemical Composition of Chicory Roots
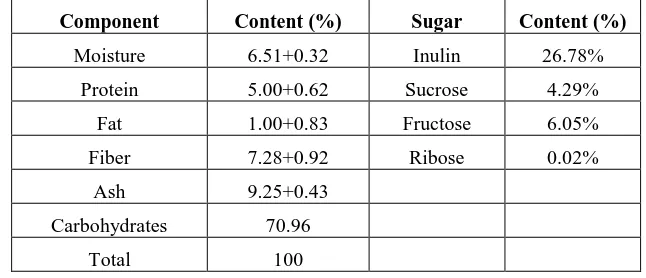
Data presented in Table 1 showed the chemical composition of chicory roots, the moisture, protein, fat, ash, fiber,
carbohydrate and inulin contents of chicory roots in the dry form were found as 6.51%, 5.00%, 1.00%, 9.25%,
7.28%, 33.82% respectively. These data agreed quite well with the results of Jurgonbski [39]. However, the
moisture, protein, fat, ash, fiber, carbohydrate and inulin contents of chicory roots in the dry form were found as
6.61%, 5.60%, 1.73%, 8.30%, 7.82% and 69.94% respectively.The data presented inTable 1 summarize the sugars
of chicory roots, sucrose 4.285%, fructose 6.050% and ribose 0.022% [40,41]. Our analyzed data of inulin in
[image:4.612.143.466.436.575.2]chicory roots (26.78 %) agreed with its percent (15-20%) presented by Mérillon and Ramawat [42].
Table 1. Chemical composition of chicory roots and content of sugars (g/100 g dry weight basis)
Component Content (%) Sugar Content (%)
Moisture 6.51+0.32 Inulin 26.78%
Protein 5.00+0.62 Sucrose 4.29%
Fat 1.00+0.83 Fructose 6.05%
Fiber 7.28+0.92 Ribose 0.02%
Ash 9.25+0.43
Carbohydrates 70.96
Total 100
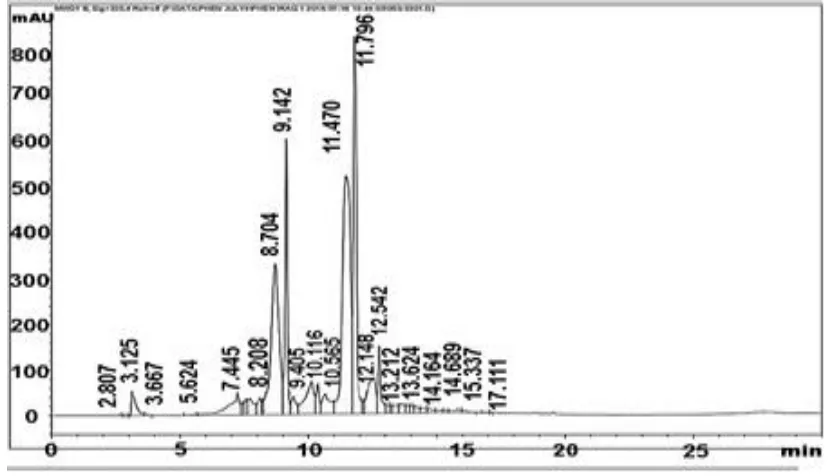
Total Flavonoids Compounds
HPLC analysis indicate the presence of Apigenin 6-arabinose 8-galactose, Apigenin 6-rhamnose 8-glucose, Luteolin
7-glucose, Naringin, Rutin, Hespirdin, Apigenin 7-α neohisperoside, Quercetrin, Quercetin, Kamp.3,
(2-p-coumaroyl) glucose, Acacetin-neo. Rutinoside, Naringenin, Hespirtin, Kampferol and Apegnin (Figure 1 and Table
37
[image:5.612.167.446.334.619.2]Figure 1. HPLC chromatogram total flavonoids in chicory roots Table 2. Total flavonoid compounds of chicory roots
Flavonoids
Chicory roots conc. (ppm)
Apigenin-6-arabinose-8-galactose 37.96
Apigenin 6-rhamnose-8-glucose 11.59
Luteolin-7-glucose 74.85
Naringin 259.33
Rutin 20.37
Hespirdin 1008.88
Apigenin-7-O-neohisperoside 3.61
Quercetrin 21.77
Quercetin 0.67
Kamp.-3, (2-p-coumaroyl)glucose 56.1
Acacetin-neo.rutinoside 10.44
Naringenin 0.17
Hespirtin 3.43
Kaempferol 2.07
Apegnin 2.94
Total 3530.81
Effect of Chicory Roots and Pure Inulin on Body Weight
The mean values of body weight gain percent, feed intake and feed efficiency ratio of rats fed diet supplemented
with different levels of chicory roots, (5.0, 10.0 and 20.0 g/100 g deit), and pure inulin (0.5, 1.0 and 2.0 g/100 g deit)
for 6 weeks are summarized in Table 3. After feeding, the body weight gain percent recorded the highest values
(47.34 ± 1.98%) by (-ve) control group, while the value significantly decreased to reach (17.37 ± 1.34%) for (+ve)
38
comparison with the (-ve) and (+ve) control groups, the body weight gain percent of chicory roots group (10%) was
the best result (25.96 ± 1.31%) in the three groups of chicory (5.0%, 10.0%, 20.0%) and pure inulin group (1.0%)
recorded the best result (13.76 ± 0.70%) in the three groups of pure inulin (0.5, 1.0 and 2.0 g/100 g diet). As for feed
intake revealed that negative control (764.45 ± 7.39 g) is higher than (p ≤ 0.05) positive control (633.31 ± 17.54 g).
When added chicory roots and pure inulin separately, the feed intake increase by the six levels of these groups, the
feed intake (711.43 ± 16.99 g) of male rats were fed diet contains chicory roots (10%) had the best efficiency in feed
utilization and the highest weight gain during the experimental. Finally, we could conclude that the feed efficiency
ratio of chicory roots (10%) group was the best results in comparison with the feed efficiency ratio of positive
control and other group of rats except negative control group which recorded the highest value of feed efficiency
ratio. This results agreement with [43] the weights of the animals were shown to be reduced in comparison with the
negative and positive control. This might be attributed to the effect of dexamethasone used which is in agreement
[image:6.612.103.508.315.520.2]with the studies reported earlier.
Table 3. Body weight gain percent, total feed intake and feed efficiency of rats fed on diets supplemented with different levels of chicory roots and pure inulin
Treatments body weight gain % Total feed intake (g) Feed efficiency ratio
(-ve) control 47.34 ± 1.98a 764.45 ± 7.39a 0.112 ± 0.002a
(+ve) control 17.37 ± 1.34d 633.31 ± 17.54b 0.045 ± 0.006d
Chicory roots 5% 16.12 ± 1.26d 681.27 ± 17.48ab 0.046 ± 0.001d
Chicory roots 10% 25.96 ± 1.31bc 711.43 ± 16.99ab 0.071 ± 0.002bc
Chicory roots 20% 9.61 ± 1.75f 623.44 ± 36.79b 0.016 ± 0.003f
Inulin 0.5% 9.36 ± 0.55f 620.34 ± 35.74b 0.028 ± 0.001e
Inulin 1.0% 13.76 ± 0.70de 673.60 ± 22.86b 0.040 ± 0.002d
Inulin 2.0% 10.22 ± 1.45ef 672.48 ± 41.94b 0.028 ± 0.003e Mean values of five rats ± Standard Errors.
a, b, c and d of small letters in the same column are significantly differences (P ≤ 0.05)
Effect of Chicory Roots and Pure Inulin on Fasting Serum-Glucose
The data obtained are present in Figure 2, there was a high significant difference between (-ve) control and all
groups. And showed that the highest fasting serum-glucose value was (295.68 ± 12.78mg/dL) of treated groups
recorded for pure inulin (2.0%), while the lowest value (125.504 ± 3.44mg/dL) was recorded for chicory roots 10%
in comparison with (-ve) and (+ve) control groups. These results are in accordance with [44] when treated rats with
Cichorium intybus (chicory), the level of sugar decreased to normal value. This effect might be due to the active
inulin in this plant. This is due to hormonal level of glucagons and insulin, that way regulating lipid and
39
Figure 2. Fasting serum glucose of rats fed on diets supplemented with different levels of chicory roots and pure inulin
Effect of Chicory Roots and Pure Inulin on Kidneys Functions
The data are summarized in Table 4, showed a high significant difference (p ≤ 0.05) between (-ve) control and other
groups' values except groups which fed on chicory roots 10% (0.825 ± 0.052 and 32.432 ± 2.382 mg/dL) and pure
inulin 1.0% (0.980 ± 0.056 and 54.98 ± 2.637 mg/dL) recorded the best results in comparison with (-ve) and (+ve)
control groups for creatinine and urea, respectively.
Table 4. Kidney functions of rats fed diet supplemented with different levels of chicory roots and pure inulin
Mean values of five rats ± Standard Errors.
a, b, c, d and e of small letters in the same column are significantly differences (p ≤ 0.05)
Effect of Chicory Roots and Pure Inulin on HB, RBCs, Platelets and WBCs
The data tabulated in Table 5, showed that the lowest value (10.384 ± 0.839 g/dL) of HB for the all groups recorded
for (-ve) control group, while all groups recorded an increase and a clear improvement in the concentration of HB
for the treated groups and the best result (15.958 ± 0.728g/dL) was recorded by chicory roots (10%) in comparison
with the (+ve) and (-ve) control groups. On the other hand, the highest RBCs value (4.506 ± 0.306 μL) was recorded
by (+ve) control group, while a high significant difference (p ≤ 0.05) between (-ve) and other groups' values except
groups which fed on chicory roots10% (4.034 ± 0.335 μL) and pure inulin 1.0% (4.294 ± 0.357 μL) recorded the
best results in comparison with (-ve) and (+ve) control groups, respectively. In case of Platelets, the highest levels
(475.4 ± 26.464μL) was recorded by (+ve) control group, while other groups were decreased in comparison with
(+ve) control group except chicory roots 10 % was recorded the best results (208.6 ± 24.115μL) in comparison to
(-ve) and (+(-ve) control groups, and the highest WBCs value (13.316 ± 0.908μL) recorded by (+(-ve) control group, Treatments Creatinine (mg/dL) Urea (mg/dL)
(-ve) control 0.814 ± 0.075de 31.212 ± 2.725d
(+ve) control 2.014 ± 0.099a 68.392 ± 2.825a
Chicory roots 5% 0.996 ± 0.066de 40.502 ± 3.987c
Chicory roots 10% 0.825 ± 0.052e 32.432 ± 2.382d
Chicory roots 20% 1.264 ± 0.039c 37.146 ± 2.742cd
Inulin 0.5% 1.442 ± 0.065c 60.382 ± 3.998ab
Inulin 1.0% 0.980 ± 0.056d 54.980 ± 2.637b
[image:7.612.155.459.347.488.2]40
while the best result (6.086 ± 0.608 μL) recorded by chicory roots 10% with significant differences in comparison
with (-ve) and (+ve) control groups. Finally, we could conclude that the hemoglobin (HB), red blood cells count
(RBCs), Platelets and white blood cells count (WBCs) of chicory roots (10%) was the best result in comparison with
the other groups, the significant reduction of WBC and lymphocytes counts observed in the study [45]. These results
were a good indicator of the improvement of the immune system in food supported chicory roots at a concentration
[image:8.612.77.535.188.336.2]of 10%.
Table 5. HB, RBCs, platelets and WBCs of rats fed on diet supplemented with different levels of chicory roots and pure inulin
Treatments HB (g/dL) RBCs (×10⁶/μL) Platelets (×103/μl) WBCs (×103/μL)
-ve control 18.008 ± 0.936a 4.506 ± 0.306ab 184.4 ± 27.520c 7.142 ± 0.630b
+ve control 10.384 ± 0.839b 2.896 ± 0.130ab 475.4 ± 26.464a 13.316 ± 0.908a
Chicory roots 5% 14.728 ± 1.103ab 5.201 ± 0.236a 312.8 ± 19.127b 4.894 ± 0.339cd
Chicory roots 10% 15.958 ± 0.728ab 4.034 ± 0.335ab 208.6 ± 24.115bc 6.086 ± 0.608bcd
Chicory roots 20% 14.732 ± 1.007ab 6.098 ± 0.311a 352.8 ± 16.259b 5.172 ± 0.357cd
Inulin 0.5% 13.116 ± 1.041ab 5.594 ± 0.415a 369.8 ± 34.292ab 4.696 ± 0.443cd
Inulin 1% 14.234 ± 1.019ab 4.294 ± 0.357ab 259.2 ± 28.815bc 6.644 ± 0.801bc
Inulin 2% 13.08 ± 1.254ab 3.514 ± 0.231ab 360.6 ± 36.586ab 5.36 ± 0.474d Mean values of five rats ± Standard Errors.
a, b, c and d of small letters in the same column are significantly differences (p ≤ 0.05)
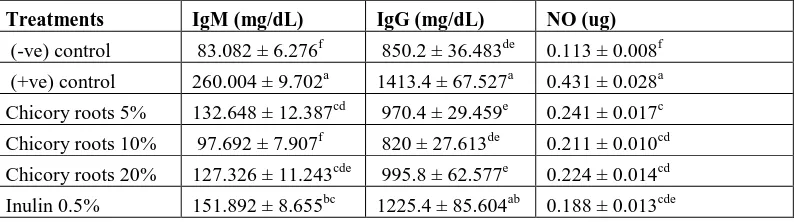
Effect of Chicory Roots and Pure Inulin on IgM, IgG and Nitric oxide (NO)
The data results Table 6, indicated that the highest IgM value was (260.004 ± 9.702 mg/dL) recorded for (+ve)
control group, While the other groups recorded decrease a significant compared to the (+ve) control group except
chicory roots 10% was recorded the best results (97.692 ± 7.907mg/dL)compared to negative control group, As for
IgG value was (860 ± 27.613 mg/dL) for group 4 which fed on 10% chicory roots, then decreased significantly
followed by group 3 (970.4 ± 29.459 mg/dL) which fed on 5% chicory roots and group 7 (983.8 ± 83.104 mg/dL)
which fed on 1.0% pure inulin. Note that the lowest value recorded by the negative control group. The results
showed a significant improvement in the NO level of the groups fed on chicory roots and pure inulin, compared with
the positive group which recorded (0.431 ± 0.028ug) the highest value, while the negative group recoded (0.113 ±
0.008 ug) the lowest value of NO levels but the best result compared all groups recorded by group 7 which fed 1.0%
pure inulin (0.174 ± 0.025ug) in comparison with the three groups of pure inulin. Also the best result compared all
groups recorded by group 4 which fed 10% chicory roots (0.211 ± 0.010 ug) in comparison with the three groups of
chicory roots.
Table 6. Immunoglobulins (IgM, IgG and NO) of rats fed on different levels of chicory roots and pure inulin
Treatments IgM (mg/dL) IgG (mg/dL) NO (ug)
(-ve) control 83.082 ± 6.276f 850.2 ± 36.483de 0.113 ± 0.008f
(+ve) control 260.004 ± 9.702a 1413.4 ± 67.527a 0.431 ± 0.028a
Chicory roots 5% 132.648 ± 12.387cd 970.4 ± 29.459e 0.241 ± 0.017c
Chicory roots 10% 97.692 ± 7.907f 820 ± 27.613de 0.211 ± 0.010cd
Chicory roots 20% 127.326 ± 11.243cde 995.8 ± 62.577e 0.224 ± 0.014cd
[image:8.612.109.506.602.713.2]41
Inulin 1.0% 100.612 ± 9.864def 983.8 ± 83.104cd 0.174 ± 0.025de
Inulin 2.0% 146.668 ± 13.233c 1141.6 ± 57.066bc 0.251 ± 0.030bc Mean values of five rats ± Standard Errors.
a, b, c and d of small letters in the same column are significantly differences (p ≤ 0.05).
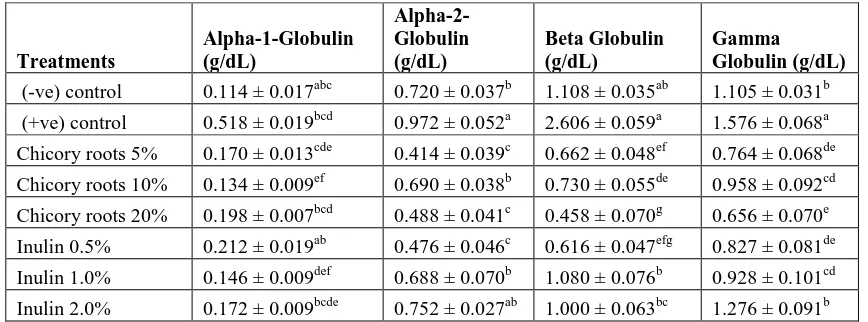
Effect of Chicory Roots and Pure Inulin on Protein Electrophoresis
The data results in Table 7, showed the highest Alpha-1-Globulin value (0.518 ± 0.019 g/dL) of for the groups
recorded for (+ve) control group, while the all groups were recorded decrease a significant compared to the (+ve)
control group except chicory roots 10% was recorded the best results (0.134 ± 0.009g/dL) compared to (-ve) control
group. The highest Alpha-2-Globulin value (0.972 ± 0.052g/dL) for the groups recorded for (+ve) control group,
while the all groups were recorded decrease a significant compared to the (+ve) control group except chicory roots
10% was recorded the best results (0.414 ± 0.039g/dL) compared to (-ve) control group. The highest Beta Globulin
value (2.606 ± 0.059 g/dL) of the groups recorded for (+ve) control group, while the lowest value (0.458 ± 0.070
g/dL) recorded for chicory (20%) group, but the best results (1.080 ± 0.063 g/dL) was recorded by chicory roots
10% group compared to (-ve) control group. The highest Gamma Globulin value (1.576 ± 0.068g/dL) was recorded
for (+ve) control group while the best results (0.958 ± 0.092g/dL) recorded for chicory roots 10% with significant
[image:9.612.90.524.371.532.2]differences in comparison with (-ve) control group.
Table 7. Protein electrophoresis (Alpha-1-Globulin, Alpha-2-Globulin, Beta Globulin and Gamma Globulin) of rats fed on different levels of chicory roots and pure inulin
Treatments Alpha-1-Globulin (g/dL) Alpha-2-Globulin (g/dL) Beta Globulin (g/dL) Gamma Globulin (g/dL)
(-ve) control 0.114 ± 0.017abc 0.720 ± 0.037b 1.108 ± 0.035ab 1.105 ± 0.031b
(+ve) control 0.518 ± 0.019bcd 0.972 ± 0.052a 2.606 ± 0.059a 1.576 ± 0.068a
Chicory roots 5% 0.170 ± 0.013cde 0.414 ± 0.039c 0.662 ± 0.048ef 0.764 ± 0.068de
Chicory roots 10% 0.134 ± 0.009ef 0.690 ± 0.038b 0.730 ± 0.055de 0.958 ± 0.092cd
Chicory roots 20% 0.198 ± 0.007bcd 0.488 ± 0.041c 0.458 ± 0.070g 0.656 ± 0.070e
Inulin 0.5% 0.212 ± 0.019ab 0.476 ± 0.046c 0.616 ± 0.047efg 0.827 ± 0.081de
Inulin 1.0% 0.146 ± 0.009def 0.688 ± 0.070b 1.080 ± 0.076b 0.928 ± 0.101cd
Inulin 2.0% 0.172 ± 0.009bcde 0.752 ± 0.027ab 1.000 ± 0.063bc 1.276 ± 0.091b Mean values of five rats ± Standard Errors.
a, b, c, d, e, f and g of small letters in the same column are significantly differences (p ≤ 0.05)
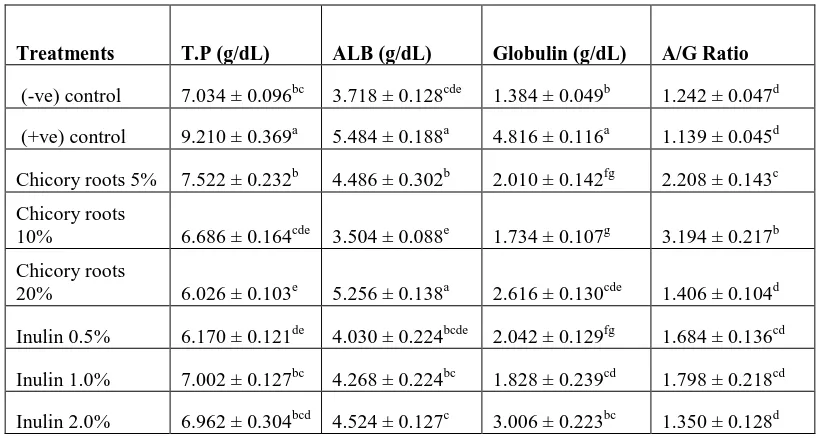
The data results in Table 8, stated that the highest T.P value (9.210 ± 0.369 g/dL) of the groups recorded for (+ve)
control group, while the best results (7.002 ± 0.127g/dL) recorded for pure inulin 1.0% with significant differences
in comparison with (-ve) and (+ve) control groups. The highest ALB value (5.484 ± 0.188g/dL) for the treated
groups recorded for (+ve) control group, while the best value (3.504 ± 0.088g/dL) recorded for chicory roots 10%
with significant differences in comparison with (-ve) and (+ve) control groups. The highest Globulin value (4.816 ±
0.116 g/dL) of the groups recorded for (+ve) control group, while the best results (1.734 ± 0.107 g/dL) recorded for
chicory roots 10% group with significant differences in comparison with (-ve) and (+ve) control groups. On the
42
the lowest value (1.139 ± 0.045 ratio) recorded for (+ve) control group with significant differences in comparison
[image:10.612.101.512.118.337.2]with (-ve) control group.
Table 8. Protein electrophoresis (T.P, ALB, Globulin and A/G Ratio) of rats fed on different levels of chicory roots and pure inulin
Treatments T.P (g/dL) ALB (g/dL) Globulin (g/dL) A/G Ratio
(-ve) control 7.034 ± 0.096bc 3.718 ± 0.128cde 1.384 ± 0.049b 1.242 ± 0.047d
(+ve) control 9.210 ± 0.369a 5.484 ± 0.188a 4.816 ± 0.116a 1.139 ± 0.045d
Chicory roots 5% 7.522 ± 0.232b 4.486 ± 0.302b 2.010 ± 0.142fg 2.208 ± 0.143c
Chicory roots
10% 6.686 ± 0.164cde 3.504 ± 0.088e 1.734 ± 0.107g 3.194 ± 0.217b
Chicory roots
20% 6.026 ± 0.103e 5.256 ± 0.138a 2.616 ± 0.130cde 1.406 ± 0.104d
Inulin 0.5% 6.170 ± 0.121de 4.030 ± 0.224bcde 2.042 ± 0.129fg 1.684 ± 0.136cd
Inulin 1.0% 7.002 ± 0.127bc 4.268 ± 0.224bc 1.828 ± 0.239cd 1.798 ± 0.218cd
Inulin 2.0% 6.962 ± 0.304bcd 4.524 ± 0.127c 3.006 ± 0.223bc 1.350 ± 0.128d Mean values of five rats ± Standard Errors.
a, b, c, d, e, f and g of small letters in the same column are significantly differences (p ≤ 0.05).
Histopathological Examination
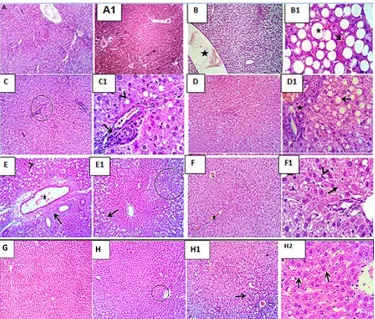
The liver of rats for (-ve) group showed the normal hepatic morphological structures (Photo A&A1), Examined
sections revealed normal hepatic morphological structure with preserved lobular, portal and interlobular components
and preserved vascular and biliary structures. (Photo B) liver of rats for (+ve) group showed congestion of portal
blood vessels (star) and (Photo B1) macrosteatosis (star) and dilated sinusoids (arrow). (Photo C&C1) Liver of rats
for chicory roots (5%) group showed hepatic parenchyma with macrosteatosis (arrow head) and portal triads round
cells infiltrations (arrow). (Photo D&D1) Liver of rats for chicory roots (10%) group showed micro and
macrosteatosis in some hepatic parenchyma (arrow) with a few round cells infiltration in portal area (star). (Photo
E&E1) Liver of rats for chicory roots (20%) group showed micro and macrosteatosis (arrow head).The portal triads
showed mild infiltration of round cells (arrow). Portal blood vessels are moderately dilated (star).The fatty change
seen mostly periphero-lobular (arrow) and periportal (circle). (Photo F&F1) Liver of rats for pure inulin (0.5%)
group showed congested hepatic blood vessels (stars), macrosteatosis (open arrow), and vacuolar degeneration
(closed arrow) and hypertrophied kuffer cells (arrow head). (Photo G) Liver of rats for pure inulin (1.0%) group
showed absolutely healthy liver (normal liver). (Photo H) Liver of rats for pure inulin (2.0%) group showed
periportal (circle), (Photo H1) normal hepatic parenchyma with some degenerative changes as fatty change (open
43
Figure 3. Liver photo micrograph of male rats: (Photo A&A1) of -ve group, (Photo B&B1) +ve group, (Photo C&C1) chicory roots (5%) group, (Photo D&D1) chicory roots (10%) group, (Photo E&E1) chicory roots (20%) group, (Photo F&F1) pure inulin (0.5%) group, (Photo G) pure inulin (1.0%) group and (Photo H,H1&H2) pure inulin (2.0%) group.
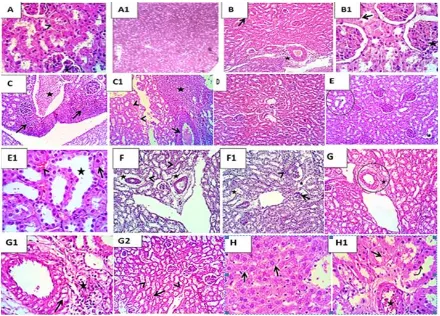
The kidneys of rats for (-ve) group showed the normal renal epithelium (arrow head) and glomeruli (star) (Photo
A&A1). (Photo B) Kidneys of rats for (+ve) group showed mild congestion of renal blood vessels and intertubular
capillaries (arrow). Perivascular edema (star), (Photo B1) degenerative changes in some tubular epithelium (arrow),
with hyper trophied mesangial cells (star). (Photo C) Kidneys of rats for chicory roots (5%) group showed
congestion of renal blood vessels (arrow) with peri vascular aggregation of lymphocytes and neutrophils (star) and
degenerative changes (arrow heads) in some renal tubular epithelium, (Photo C1) Acute pyelitis with dilated blood
vessels (star) and moderate infiltration of lymphocytes and neutrophils (arrows). (Photo D) Kidneys of rats for
chicory roots (10%) group showed normal renal parenchyma (star). (Photo E&E1) Kidneys of rats for chicory roots
(20%) group showed cystic dilatation of a few cortical tubules (star) with cloudy swelling of some renal epithelial
cell (arrow) and mild congestion of intertubular capillaries (arrow heads). (Photo F) of rats for pure inulin (0.5%)
group showed large number of renal tubular epithelium in cortex and medulla with degenerative and necrotic
changes (arrow heads), some blood vessels shows perivascular edema (stars). (Photo F1) Moderate number of the
collecting tubules arecystically dilated (stars). shrinked glomeruli are seen (open arrow). (Photo G&G1) Kidneys of
rats for pure inulin (1.0%) group showed some of the renal blood vessels vacuolated tunica media (open arrow) with
44
medullary tubular epithelium (arrow heads) with hyaline cast (open arrow). (Photo H) Kidneys of rats for pure inulin
(2.0%) group showing hydropic degeneration (open arrows), Degenerative changes in the cortical tubular epithelium
[image:12.612.86.526.139.455.2](curved arrow), necrotic some tubular epithelium (open arrow), congested renal blood vessels (star) (Photo H1)
(Figure 4).
Figure 4. Kidneys photo micrograph of male rats: (Photo A&A1) of -ve group, (Photo B&B1) +ve group, (Photo C&C1) chicory roots (5%) group, (Photo D) chicory roots (10%) group, (Photo E&E1) chicory roots (20%) group, (Photo F&F1) pure inulin (0.5%) group,
(Photo G,G1&G2) pure inulin (1.0%) group and (Photo H&H1) pure inulin (2.0%) group
The spleen of rats for (-ve) group showed normally arranged lymphoid cells of white pulp (circle), central aretiole
(arrow head) and splenic sinusodes (arrow) (Photo A&A1). (Photo B) Spleen of rats for (+ve) group showed
lymphoid hyperplasia of the white pulp with prominent germinal centers (star), mantle (arrow head) and marginal
zones (arrow). (Photo B1) showed some cells mitotic divisions (arrows). (Photo B2) showed the red pulp moderately
congested sinusoids (arrow heads) and (Photo B3) massive infiltration of immature lymphocytes (arrows). (Photo C)
Spleen of rats for chicory roots (5%) group showed white pulp lymphoid hyperplasia with prominent germinal
center (star). (Photo C1) showed the red pulp moderate congestion (arrow) and infiltration of large number of
mature and immature lymphocytes (stars). (Photo D) Spleen of rats for chicory roots (10%) group showed normal
preserved lymphoid population of white pulp, normal sinusoids and lympho-reticular network of red pulp. (Photo E)
Spleen of rats for chicory roots (20%) group showing moderately proliferated lymphoid population of the white pulp
(stars). (Photo E1) showed the red pulp congested sinusoids (star) normal population of megakaryocytes (arrow).
45
F1) showed the red pulp moderate infiltration of mature (open arrow) and immature lymphocytes (arrow head).
(Photo G) Spleen of rats for pure inulin (1.0%) group showed mild to moderate proliferation of the lymphoid
population of the white pulp (star). (Photo G1) the red pulp is massively replaced by infiltration of large number of
mature (open arrow) and immature lymphocytes (arrow head). (Photo H) Spleen of rats for pure inulin (2.0%) group
Showed mild pyelitis (open arrow) and mild to moderate proliferation of the white pulp lymphoid population (star).
(Photo H1) the red pulp is massively and nearly totally replaced by infiltrated mature and immature lymphocytes
[image:13.612.118.494.189.648.2](open arrows) (Figure 5).
Figure 5. Spleen photo micrograph of male rats: (Photo A&A1) of -ve group, (Photo B,B1,B&B3) +ve group, (Photo C&C1) chicory roots (5%) group, (Photo D) chicory roots (10%) group, (Photo E&E1) chicory roots (20%) group, (Photo F&F1) pure inulin (0.5%) group,
46
CONCLUSIONSIn conclusion, results showed that chicory roots group (10%) is the best results in all treatment groups for the
following chemical analyzes which include (Fasting serum-glucose, Kidney functions, Red Blood Cells, HB,
Platelets, white Blood Cells, immunoglobulins (IgM, IgG and NO) and Protein electrophoresis (Alpha-1-Globulin,
Alpha-2-Globulin, Beta Globulin, Gamma Globulin, T.P, ALB, Globulin and A/G Ratio). We can say that the
improvement of results probably refer to a presence inulin and many chemical compounds such as flavonoids found
in chicory roots the beneficial of the immune system.
REFERENCES
[1]
G Beck; GS Habitat. Sci Am 1996, 275(5), 6066.[2]
KJ O'Byrne; AG Dalgleish. Br J Cancer. 2001, 85(4). 473483.[3]
LL Bruton; JS Lazo; KL Parker. Goodman& Gilman’S the Pharmacological Basis of Therapeutics. 11thEdn, 2006.
[4]
KR Niness. J Nutr. 1999, 129(7), 1402S1406S.[5]
R Srikanth; CH Reddy; G Siddartha; MJ Ramaiah; KB Uppuluri. Carbohydr Polym.2015, 120, 102114.[6]
AC Apolinário; BP de Lima Damasceno; NE de Macêdo Beltrão; A Pessoa; A Converti, JA da Silva.Carbohydr Polym. 2014, 101, 368-378
[7]
T Ritsema; S Smeekens. Curr Opin Plant Biol. 2003, 6, 223-230[8]
LY Wei; JH Wang; XD Zheng; D Teng; YL Yang; CG Cai; TH Feng; F Zhang. J Food Eng. 2007, 79,1087-1093.
[9]
MG Lopez; NA Mancilla-Margalli; G Mendoza-Diaz. J Agric Food Chem. 2003, 51, 7835-7840.[10]
A Van Laere; W Van den Ende. Plant Cell Environ. 2002, 25, 803-813.[11]
Z Zhu; J He; G Liu; FJ Barba; M Koubaa; L Ding; O Bals; N Grimi; E Vorobiev. Innov Food Sci EmergTechnol. 2016, 33, 1-9.
[12]
LM Munoz Centeno. Spanish medicinal Plants: Cichorium intybus L. Boletin de la Real SociedadEspanola de Historia Natural. 2004, 99, 41-47.
[13]
C Cavin; M Delannoy; A Malnoe; E Debefve; A Touche; D Courtois; B Schilter. Biochem. and Biophys.Res. Commun. 2005, 327(3), 742-749.
[14]
D Heimler; L Isolani; P Vignolini; A Romani. Food Chem. 2009, 114(3), 765-770.[15]
N Ahmed, J. Diab. and Metab. 2009, 17, 105-109.[16]
HM Kim; HW Kim; YS Lyu; JH Won; DK Kim; YM Lee; E Morii; T Jippo; Y Kitamura; NH An.Pharmacol Res. 1999, 40(1), 61-65.
[17]
H Nishimura; A Satoh. Mukerji, K.G. (Ed.), Biological Control of Plant Pathogens and Diseases. Springer,Netherlands, 2006, 177-180.
47
[19]
TA Bischoff; CJ Kelley; Y Karchesy; M Laurantos; P Nguyen-Dinh; AG Arefi. J Ethnopharmacol. 2004,95(2-3), 455-457.
[20]
G Gazzani; M Daglia; A Papetti; C Gregotti. J Pharm Biomed Anal. 2000, 23(1), 127-133.[21]
B Ahmed; TA Al-Howiriny; AB Siddiqui. J Ethnopharmacol. 2003, 87(2), 237-240.[22]
J Petrovic; A Stanojkovic; LJ Comic; S Curcic. Fitoterapia. 2004, 75(7-8), 737-739.[23]
PN Pushparaj; HK Low; J Manikandan; BKH Tan; CH Tan. J Ethnopharmacol. 2007, 111(2), 430-434.[24]
P Mattila; J Astola; J Kumpulainen. J Agric Food Chem. 2000, 48(12). 5834-5841.[25]
F Chinnici; U Spinabelli; C Riponi; A Amati. J Food Compos. Anal. 2005, 18, 121-130.[26]
AA Zielinski; CM Braga; IM Demiate; FL Beltrame; A Nogueira; G Wosiacki. Food Sci TechnolCampinas. 2014, 34(1), 38-43.
[27]
SB Anafi; HO Kwanashie JA Anuka. Niger. J Pharm Sci. 2014, 13(2), 20-27[28]
Kaplan; Princeton, Glucose trinder. Spinreact, S, A, cart Santa Coloma 7E17176 Sante stevede bas (G L)Spian. 1969.
[29]
SR Crouch; CJ Patton. Anal chem. 1977, 49, 464-469.[30]
J Bartles; M Bohmer; C Heirli. Clin. Chem Acta. 1972, 37, 193.[31]
RL Larsen; WC Pitman. J Clin Chem. 1972, (42), 209.[32]
AD Dacia, J Lewis, Practical Hematology Churchill Livingstone. 11th Ed. New York. 1998.[33]
W Skoug Jonh; AJ Pesce; LA Kaplan, Methods in Clinical Chemisitry, the CV Mosby Co., St Louis MO. 1988.34(2), 309-315.
[34]
NS Bryan; MB Grisham, Methods to Detect Nitric Oxide and its Metabolites in Biological Samples, FreeRadic Biol Med.1. 2007,43(5), 645-657.
[35]
X Theodore; MD O’connell; J Timoth; MD Horita; MD Barsam Kasravi. American Family Physician. 2005,71, (1), 105-112.
[36]
SAS, SAS Institute Inc., Cary, NC, USA. In: NOTE: SAS Proprietary Software Version 9.00 (TS M0). 2004.[37]
DB Duncan. Biometrics. 1955, 11, 1-42.[38]
SK Suvarna; C Layton; JD Bancroft. Bancroft's Theory and Practice of Histological Techniques. 7th Ed, 2013.[39]
A Jurgonbski; J Milala; J Jusbkiewicz; Z Zdunbczyk; B Król. Food Technol Biotechnol.2011, 49(1), 40-47.[40]
A.O.A.C. Official Methods Analysis of the Association of Analytcial Chemists.18th Ed., Washington, D.C.,U.S.A, 2005.
[41]
AAF Zielinski; CM Bragai; IM Demiatei; FL Beltrame; A Nogurira; G Wosiacki. Food Sci Technol Campinas.2014, 34(1), 38-43.