Journal of Chemical and Pharmaceutical Research, 2016, 8(5):792-803
Research Article
ISSN : 0975-7384
CODEN(USA) : JCPRC5
Biodegradation of Phenol by Using Conventional Activated Sludge Process
Samira Darvishi, Mohammad Hossein Sarrafzadeh* and Mohammad Reza Mehrnia
School of Chemical Engineering, College of Engineering, University of Tehran, Tehran, Iran, P.O.Box 11155-4563 _____________________________________________________________________________________________
ABSTRACT
The biological activity of activated sludge in the presence of synthetic wastewater containing pollutant of phenol was investigated. The wastewater was a mixture of molasses, phenol, urea, and ammonium phosphate. Two types of synthetic wastewater were prepared with a total COD of 1000 mg/l, the first one contained molasses, and the second one was a mixture of molasses and phenol. For the sludge fed with the mixture of molasses and phenol, the phenolic COD was gradually increased from 100 to 1000 mg/l within 10 days, and the COD changes, phenol concentration, and Colony Forming Units (CFUs) per unit volume in 24-hour intervals were monitored. The results showed that the changes in the COD and the CFUs follow the same pattern in the presence and absence of phenol, and phenol removal is complete for the phenol-contained wastewater. The impact of shock loads of phenol on the phenol removal performance was examined by feeding sludge by the wastewater of phenolic COD of 500, 700, 800 and 1000 mg/l. It was observed that for the wastewater containing only phenol (and not molasses), increasing the phenol concentration from 216 to 423 mg/l decreased the COD degradation from 90% to 5% in 24 hours. Meanwhile, phenol degradation in the aforementioned intervals decreased from 100% to 5%. At the same time, the response to shock loads of high concentration of phenol in presence of other sources of carbon besides phenol was investigated by feeding other sludge by the wastewater of the a COD of 1000, 1400, 1600 and 2000 mg/l due to phenol and molasses with the same COD proportion. The results indicated that for the wastewater containing both phenol and molasses, increasing the phenol concentration from 216 to 430 mg/l decreased the COD degradation from 92% to 62% in 24 hours.
Keywords: activated sludge, biological activity, wastewater, phenol removal, shock.
_____________________________________________________________________________________________
INTRODUCTION
studies show that the combination of various biological species biodegrade phenol faster than the pure species [6] and have a higher resistance against shocks[7]. A wide range of literature is available on phenol biodegradation kinetics with pure cultures of bacteria, such as Pseudomonas putida, Pseudomonas fluoroescens, Acinetobacter, Trichosporon cutaneum and Candida tropicalis [8,9].Only a few studies have been conducted using mixed cultures [10]. The specifications of wastewater from different petrochemical industries indicate the significant role of olefin plants in the high pollution production. Phenol is one of the most pollutant materials that exist in the wastewater of olefin plants of petrochemical industries, which is produced during the thermal cracking process in furnaces, and releases to the wastewater[27]. Wastewater in petrochemical industry is currently treated using conventional activated sludge process with pretreatment of oil/water separation [11]. The advantage of the stirred tank reactor that used in this process is that operating it and adjusting its retention time is simple[12].This paper studies the biodegradation of phenol pollutant existing in the model wastewater of petrochemical units by using activated sludge and by taking into account the changes in COD, concentration of phenol, and cellular activity.
EXPERIMENTAL SECTION
Activated sludge obtained from the wastewater treatment unit of Mobin Petrochemical Company, Centralized Utility Unit located in Assaluyeh (Iran). Phenol with an analytical grade was purchased from Merck Company. Beet molasses obtained from Isfahan Sugar Company. Figure 1 depicts some pictures of various types of microorganisms that exist in the activated sludge used in this study, taken by an optic microscope. The presence of the species shown in Figure a, entitled rotifer, is indicative of the desired conditions of the activated sludge. Rotifers may be used in the assessment of biotic quality of the activated sludge process. This series of microbial groups provide rapid indication of the state of the sludge [13].
In the first stage, 5 litres of sludge was carried to a vessel made of glass from the main storage tank. In addition to feeding and blowing air, phenol added to the sludge gradually in order to adapt sludge to the pollutant. In the next stage, a shock was imposed to the activated sludge by feeding high concentrations of phenol. In order to get close to the real conditions of treatment of biological wastewaters produced in petrochemical industries, it is necessary that the feed that is added to the sludge fed by molasses or by molasses and phenol to have a pollution load or COD similar to the wastewater that enters the effluent treatment unit of olefin plants. The COD of wastewater entering the treatment unit is equal to 1000 mg/l while phenol concentration is 5 mg/l. In order to prepare an appropriate ratio of carbon, nitrogen and phosphorous for the activated sludge, the optimum ratio of COD:P:N was adjusted to 100:5:1 [14]. Beet molasses, urea, and ammonium phosphate are the sources of carbon, nitrogen, and phosphorous respectively. Ammonium phosphate and urea were added to the sludge at concentrations equal to 21.7 and 100.2 mg/l, respectively. The pH of activated sludge was between 8 and 9 in all tests. In average, one gram of molasses provides COD equal to 637 mg/l in one litre of water while one gram of phenol provides COD equal to 2200 mg/l. COD test was carried out through ASTM 1252 by using digestion reactor type 45600 and spectrophotometer type DR2400 (Hach Company) [26].
High performance liquid chromatography (HPLC) was used to measure the concentration of phenol (Prostar 325, Varian). Firstly, solutions with determined concentrations were prepared by using distilled water and filtered sludge, and they were analysed. Each sample left completely the column of the device after 10 minutes in each analysis. The device was calibrated by using the solutions, and the phenol concentration of the samples was measured. Results show that this method has desirable accuracy and repeatability for measuring the concentration of phenol. The characteristics of HPLC method have been listed below:
Column type: Licrosorb 7 – RP C18, Solvents: ACN 50%, H2O 50%, Solvent flow: 2 ml/min,
UV Detector wavelength: 254 nm, Standards concentrations: 960 mg/l, 140 mg/l,
73 mg/l.
WTW Company to adjust temperature between 25 and 40°C, automatic pipette type WITEG to hold 100-1000 µl of activated sludge solutions, and test tube shaker to homogenise activated sludge solutions.
Taking into consideration the initial results obtained from heterotrophic plate count through spread plate method, the formation of colonies caused by the medium of thinned solutions of activated sludge, which were easily countable, needed more than seven days at temperatures lower than 25°C and five days at temperatures higher than 37°C.
Although at low concentrations of the pollutant, the number of colony forming units at higher temperatures is generally more than the one at lower temperatures, when the concentration increases up to the critical concentration, where the number of active microorganisms decreases significantly as a result, the number of colony forming units reduces [28]. However, the difference is not noticeable, and the number of the forming colony units does not depend on the temperature at high concentrations of the pollutant. Therefore, a temperature of 37°C and a time of five days were chosen in order to carry out the HPC test.
RESULTS AND DISCUSSION
3.1. Effect of Gradual Increase of Phenol Concentration in Synthetic Wastewater
Figure 2 shows a schematic view of the main storage tank of sludge and the separated sludge vessel. In all experiments of Section 3-1, the synthetic wastewaters entered the process with a total COD of 1000 mg/l including molasses or a mixture of molasses and phenol. The COD caused by phenol was increased from 100 to 1000 mg/l in 10 days during the feeding of the separated sludge. By assuming the COD of the feed equal to 1 g/l, the F/M ratio was calculated to be 0.3 and 0.2 during the two days, and the average value of the ratio was calculated 0.25 (kg COD/(kg MLSS. day)). Since the changes in COD, phenol concentration, and CFUs indicate the biodegradation of phenol, the changes in each of these parameters have been studied as following and a general analysis has been presented at the end of this section.
3.1.1. Changes in COD
Figure 3 demonstrates COD changes measured for the activated sludge in the main storage tank and the separated sludge vessel, which were fed by molasses and a mixture of molasses and phenol respectively, during the 10 days of the experiment. Every maximum point shows the value of COD after feeding on each day, and the minimum points after the maximum points show the value 24 hours after the feeding on the previous day.
Chart of COD removal percentage versus time was drawn in Figure 4 in order to study the changes in the removal ability of the sludge fed by molasses and phenol. As is seen in Figure 4, changes in the removal percentage of COD are almost similar in the both sludge fed by molasses, and by molasses and phenol together. In both samples, the maximum removal of pollution load occurred on the third day of the experiment while the minimum amount took place on the sixth day.
Figure 1- some pictures of various types of microorganisms that exist in the activated sludge (was received from the effluent treatment unit of Mobin Petrochemical Company); Figure a: rotifer
Figure 2- a schematic view of the tank of sludge, which were fed by molasses, and a mixture of molasses and phenol
Figure 3- COD changes for the activated sludge were fed by molasses and a mixture of molasses and phenol
It seems that the COD removal was higher in the presence of phenol, and the result of increasing phenol concentration to 500 mg/l was that the difference between COD removal percentage by the sludge fed by molasses and phenol and the one by the sludge fed by molasses increased to 28%. The average error values calculated for COD removal percentage were ±0.8% and ±3% for the sludge fed by molasses and for the sludge fed by molasses and phenol, respectively. The operation of a sequential batch reactor (SBR) was investigated in a work. COD removal rates up to 93% were measured, corresponding to COD effluent values lower than 400 mg/L[15].
3.1.2. Changes in Phenol Concentration
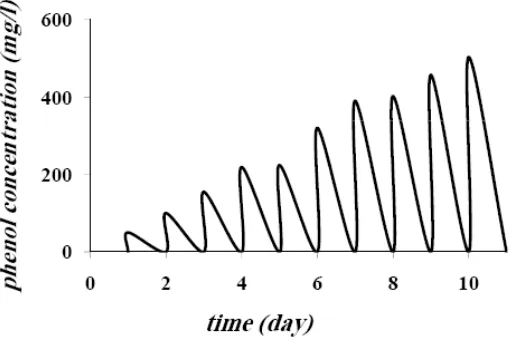
Since the changes in COD somehow represent the changes in total concentration of carbon sources including beet molasses and phenol, phenol concentration was measured at the same time the changes in COD was measured. The changes are shown in Figure 5. Taking into account the increase in phenol concentration in the feed stream and the increase in the ratio of COD caused by phenol to COD during the 10 days of the experiment, the whole amount of phenol was removed by the sludge on each day and the sludge showed a high ability to remove phenol at a concentration up to 503 mg/l. Complete removal of phenol by a membrane bioreactor has been reported at a concentration range of 0.5-3 mg/l in the inlet wastewater stream [2]. Also The maximum phenol degradation capacities was found 3.2 g/(l .days) for the stirred tank bioreactor (CSTB) and4 g/(l days) for the fluidized bed bioreactor(FBB) [16].In addition, it confirms the possibility of phenol removal at concentrations higher than 503 mg/l. The concentration of phenol in the inlet wastewater stream in the effluent treatment units of the petrochemical plants, especially olefin plants, may reach 80 mg/l at critical situations, which is by far less than the concentration used in this research.
3.1.3. Changes in CFUs
The ability to remove pollution load depends to the type of microorganisms present in the activated sludge. Such microorganisms have been studied quantitatively and qualitatively with the help of heterotrophic plate count. The number of colony forming units (CFUs) per a unit of sample volume in the presence and absence of phenol has been compared in Figure 6.
The number of colonies reduced significantly on the fourth day of the experiment in the both samples of sludge fed by molasses and by molasses and phenol. After an increase in the number of colonies between the fourth and the fifth day, the number of the colonies in the sludge fed by molasses decreased after the seventh day and it approximately reached zero.
[image:6.595.164.422.527.700.2]The number of colonies in the sludge fed by molasses and phenol reduced after an increase between the fourth and fifth day, and their number remained constant at a low value. It seems that the number of bacteria that were the cause of phenol removal was less than the number of the colonised bacteria. The number of colonies reduced simultaneously in the both sludge samples fed by molasses and by molasses and phenol. The reason may be the elimination of the bacteria that did not play any role in the removal of phenol. The CFUs value was equal to 5×10¹³ per microlitter of sludge for the sludge fed by molasses and phenol between the seventh and the tenth day of the experiment, which was approximately 10 times more than the value for the sludge fed by molasses. The difference proves that the presence of phenol increased the number of species that are effective in the removal of phenol. In a research by use of phenol a solo carbon source, due to the removal progress and decrease in phenol concentration, the inhibition will decrease and phenol consumption mostly leads to synthesis new cells [17].
3.1.4. Overall View to Biodegradation of Phenol
By comparing the trend of changes in COD and CFUs in the sludge samples fed by molasses and by molasses and phenol in Figures 4 and 6, it seems that the presence of phenol did not generally have any negative effect on the biological behaviour of the microorganisms. Researches show that the activated sludge process is suitable for the removal of phenol from wastewater at various concentrations. For example, a COD removal of 85-90% and full removal of phenol have been observed in a fixed bed bioreactor with hydraulic residence time of 8 hours for the treatment of wastewater with a COD value of 510 mg/l and a relatively low initial phenol concentration of 30 mg/l [18].
Figure 6- The number of colony forming units (CFUs) per a unit of sample volume in the presence and absence of phenol
In another study, the maximum amount of phenol removal was reported at a concentration of 4.9 g/l in a fixed bed aerobic bioreactor while the concentration of phenol gradually increased from 0.19 to 5.17 g/l in 400 days [19]. It shows that the removal of phenol decreases at concentrations higher than 5 g/l.
3.2. Effect of Shock
In this stage, imposing a shock on the fresh activated sludge that was obtained from Mobin Petrochemical Effluent treatment Unit was studied by providing wastewater with high concentrations of phenol.
Taking into account the explanations in Section 3-1, as the concentration of phenol gradually increased to 500 mg/l, COD and phenol removal percentages were 70% and 100%, respectively. Therefore, in order to impose shocks, wastewaters were added to 1-lit vessels containing fresh sludge with approximate concentrations of 227, 318, 363, and 454 mg/l, which is equivalent to 500, 700, 800, and 1000 mg/l of COD caused by phenol. In order to study the effect of shock when another source of carbon except phenol is available, wastewaters with total COD of 1000, 1400, 1600, and 2000 mg/l were added to vessels containing similar sludge. Half of the total COD was caused by phenol and the rest was caused by molasses. Since MLSS value does not vary significantly in a short period of time, its value was measured for a random sample, and it was equal to 5 g/l. Samples were taken from each vessel containing sludge at three time intervals: immediately after the feeding, 24 hours after the feeding, and 48 hours after the feeding, then COD values and phenol concentration were measured in each sample. Results obtained from COD tests and phenol concentration have similar amount of phenol immediately after the feeding in the samples taken from the sludge fed by molasses and by molasses and phenol. In order to study the phenol and COD removal ability of the activated sludge, phenol and COD removal percentages were calculated 24 hours and 48 hours after the feeding.
3.2.1 COD Removal Percentage
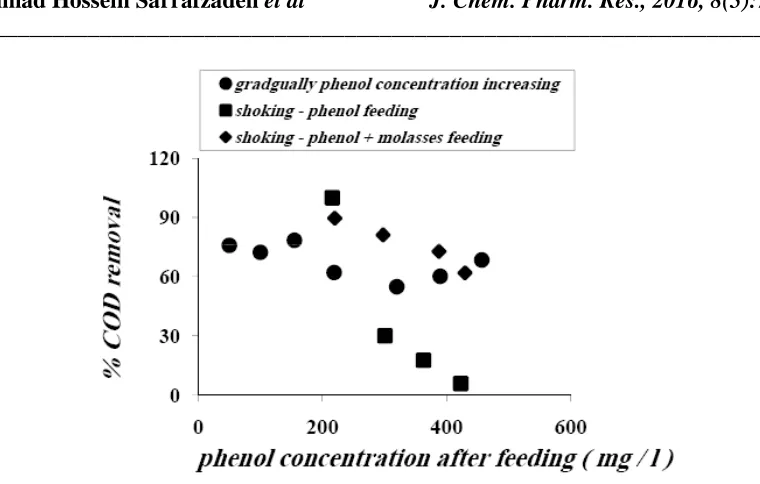
Figure 7 shows the COD removal percentage versus the initial concentration of phenol.
As is seen in the figure, the following facts happen in the two types of the activated sludge.
1.As the initial concentration of phenol increases from 216 to 423 mg/l, COD removal ability of the sludge fed only by phenol decreases from 90% to 4% at 24 and 48 hours after the feeding. COD removal completes in 24 hours at an initial phenol concentration of 216 mg/l. As the initial concentration increases to 301 mg/l, the amount of removal decreases considerably in 24 hours but it does not vary at 48 hours. At an initial concentration of 363 mg/l, the amount of removal decreases intensely after 24 and 48 hours, and it reaches around zero as the initial concentration increases more.
2.The decrease of COD removal is less (about 30%) in the sludge fed by phenol and molasses as the concentration of phenol increases from 216 to 430 mg/l. There exists a small difference for removal after 24 and 48 hours.
Figure 7- % COD removal for the activated sludge were fed by molasses and a mixture of molasses and phenol
3.2.2 Phenol Removal Percentage
Phenol removal percentage has been plotted versus the initial concentration of phenol in Figure 8. The figure shows that:
1. As the initial concentration of phenol increases in the sludge fed only by phenol, although phenol removal is 100% up to the initial concentration of 301 mg/l in 48 hours, it decreases extremely (and reaches 10%) when the initial concentration of phenol increases to 423 mg/l. Phenol removal ability decreases considerably while the initial concentration increases in 24 hours.
2. Phenol removal is complete in 24 and 48 hours in the sludge fed by a mixture of phenol and molasses.
Figure 8- % phenol removal for the activated sludge were fed by molasses and a mixture of molasses and phenol
of 430 mg/l was added to another sludge vessel. The wastewater included molasses with COD value of 1000 mg/l caused by molasses. Phenol concentration reached 3 mg/l after 24 hours. The effect of molasses on phenol removal is clearly observed in this test. Other methods were used to create shock. In a study on an anaerobic fixed bed bioreactor that used glucose as the source of carbon, after the gradual increase in the concentration of phenol from 0.8 to 3.8 g/l in 221 days, a shock was imposed on the activated sludge by a sudden increase in the concentration of phenol to 4.7 g/l. The concentration of glucose changed from 4.2 to 3 g/l at the same time, and the phenol removal increased from 98.5% to 89% on the next day [3]. The study shows that no matter how the shock has been created, sudden increase in the concentration of phenol in wastewater decreases the phenol removal. For a plate bioreactor, around 100% degradation could be achieved with 300 and 500-ppm influent phenol concentrations and at concentrations of 800 and 900 ppm the percentage degradation has reduced to around 94% and 93% [25]. It seems that the presence of a carbon source other than phenol (glucose) avoided the intense decrease in phenol removal percentage.
3.2.3. Overall View to Biodegradation of Phenol
Phenol concentration in the wastewater stream that entered the sludge fed by phenol was equal to the one in the wastewater stream that entered the sludge fed by phenol and molasses. The COD value of the wastewater entering the sludge fed by phenol and molasses was two times of the value in sludge fed by phenol. Comparing the COD and phenol removal percentages in the presence and absence of molasses shows that at equal initial concentrations of phenol, the availability of another carbon source except phenol resulted in a better removal of COD and in a complete removal of phenol. Although the COD value in the wastewater entering the sludge fed by phenol and molasses was two times more than of the value in the sludge fed by phenol, the better removal of COD is noticeable in the presence of molasses. Moreover, the sensitivity of sludge to the increase in phenol concentration decreases significantly in the presence of molasses.
3.3. Comparing Biodegradation of Phenol
In Section 3-1, phenol was added to the sludge gradually in order to make the sludge compatible with the pollutant, and the sampling was carried out at each stage of the tests one day after the feeding. In Section 3-2, a shock was imposed on the activated sludge by adding high concentrations of phenol to the activated sludge, and samples were taken from the sludge 24 hours and 48 hours after the feeding.
The results obtained from the measurement of COD values and phenol concentration in Sections 3-1 and 3-2 have been compared in this section.
3.3.1. COD Removal Comparison
Figure 9- % COD Removal Comparison : when concentration of phenol gradually increases with when a shock is imposed on the sludge
3.3.2. Phenol Removal Comparison
Phenol removal percentage after one day has been drawn versus its initial concentration after the feeding in Figure 10.
As is observed in the figure, phenol is completely removed during the gradual increase and imposing the shock in the presence of molasses in 24 hours. However, when the inlet feed includes only phenol, phenol removal is extremely affected by phenol concentration.
It has been reported that the biodegradation of phenol took place better by the activated sludge in the presence of glucose as the source of carbon. Since glucose increases the cellular concentration of the species pseudomonas putida, an increase in the concentration of glucose improves the removal of phenol [1].
[image:11.595.180.428.483.679.2]CONCLUSION
Biodegradation of phenol pollutant existing in the wastewater of petrochemical industries by the activated sludge of the effluent treatment unit of these industries has been studied in this research, by taking into consideration the changes in COD, phenol concentration, and cellular activity. Results indicate the great effect of adaptability of the activated sludge to phenol.
In general, the following conclusions can be made from this research:
1. Gradually increasing the concentration of phenol at the same time with gradually decreasing the concentration of beet molasses as the source of carbon does not cause any problem in the removal of phenol when the pollution load or, in other words, the COD of the inlet feed, is kept constant.
2. Adding a feed that includes only phenol (especially at higher concentrations) harms the biological activity and prevents the effluent treatment process.
3. When molasses, as the source of carbon, was added to the wastewater in addition to phenol, the removal of phenol is not affected considerably by the shock caused by adding the feed mixture at high concentrations of phenol. This situation is much closer to the real condition of effluent treatment units of the petrochemical plants.
Acknowledgement
The authors would like to thank the financial support of Petrochemical Research and Technology Company.
RESOURCES
[1]GAnnadurai;R Juang;D Lee. Waste Management,2002, 22,703–710.
[2]BMarrot;A B Martinez; P Moulin;N Roche. Biochemical Engineering Journal, 2008, 30,174–183. [3]M Bajaj;C Gallert; J Winter. Bioresource Technology, 2008, 162, 1330 – 1339.
[4]C Brasquet; J Rouss; E Subrenat;P Le Cloriec.Environment Technology, 1996, 17, 1245–1252. [5]C Brandt; A Zeng;W Deckwer. Bioengineering, 1997, 55,480–489.
[6]G Zache;H J Rehm. Applied Microbiology Biotechnology, 1989,30,426–432.
[7]DW Holladay;C WHancher; C D Scot;D DChilcote. Journal of Water Pollutannts Control Federal, 1987, 50,2573–2589.
[8]M Bajaj; C Gallert; J Winter. Biochemical Engineering Journal, 2009, 46, 205–209.
[9]GBusca; S Berardinelli; C Resini; L Arrighi. Journal of Hazardous Materials, 2008, 160, 265–288.
[10]G Tziotzios; M Teliou; V Kaltsouni; G Lyberatos; DV Vayenas. Biochemical Engineering Journal, 2005,26, 65–71.
[11]TKhaing; J Li; Y Li; N Wai; FWong. Separation and Purification Technology, 2010, 74, 138–143. [12]JKim; KOh; SLee; SKim; S Hong. Process Biochemistry, 2002, 37, 1367–1373.
[13]JArevalo; BMoreno; JPérez; MA Gomez. Journal of Hazardous Materials, 2009, 167, 784–789. [14]M H Bates; A Toabian. Water Research, 1981, 15,999-1004.
[15]CA Papadimitriou; P Samaras, GP Sakellaropoulos. Bioresource Technology, 2009, 100, 31–37. [16]G Gonzalez; MG Herrera; MT Garcoa; MM Pena. Bioresource Technology, 2001, 76, 245-251.
[17]M Manafi; M R Mehrnia; M H Sarrafzadeh. International Journal of Chemical and Environmental Engineering, 2011, 2, 103-107.
[18]C G Jou; G Huang. Advances in Environmental Research, 2003, 7, 463–469.
[19]M Bajaj; C Gallert; J Winter. Journal of Hazardous Materials, 2008, 99, 8376 – 8381. [20]SH Hosseini; SM Borghei. Process Biochemistry, 2005, 40, 1027-1031.
[21]M Eiroa; A Vilar; C Kennes; MC Veiga. Bioresource Technology, 2008, 99, 3507–3512. [22]G Moussavi; B Barikbin; M Mahmoudi. Chemical Engineering Journal, 2010, 158, 498–504. [23]AAlemzadeh; F Vossoughi; M Houshmandi. Biochemical Engineering Journal, 2002, 11, 19–23.
[24]V L Santos;A S Monteiro; D T Braga; M M Santoro. Journal of Hazardous Materials, 2009, 161, 1413–1420. [25]K Vidya Shetty; R Ramanjaneyulu; G Srinikethan. Journal of Hazardous Materials, 2007,149, 452–459. [26]R A Storer. ASTM, Annual book of ASTM standards, Water and Environmental Technology, 1992; 11.02, 65 – 72.
[27]M Jafarzadeh; Petrochemical environmental outlook, 2008.