Journal of Chemical and Pharmaceutical Research, 2014, 6(6):1890-1897
Research Article
ISSN : 0975-7384
CODEN(USA) : JCPRC5
Research and application of the analytical hierarchy model based on
sports industry resource optimization and structure layout strategy
Wei Junfang
Department of Sports and Arts, Zhejiang University, Zhejiang, China
_____________________________________________________________________________________________
ABSTRACT
Firstly, from the perspective of optimizing sports industry, four factors of judging schemes are obtained. They are the number of employees in the sports industry, its resources, the soundness of relevant policies and its impacts on the economy. Then the analytical hierarchy research is conducted. With the acceleration of China’s new-type urbanization, the demand for sports facilities in new-type cities and towns has been increasing year by year. Stadiums or sports facility groups should bring into full play the covering effect. Thus, in response, this paper builds a hexagonal honeycomb model according to geographical features. This paper establishes a structural layout model and uses the honeycomb model to study the sports service model.
Key words:
Cellular network; sports industry; AHP method
_____________________________________________________________________________________________
INTRODUCTION
Being a veritable sunrise industry, the sports industry consists of physical industry and mental industry. As a component of national economy, the sports industry attaches importance to market efficiency and economic benefits. But different from other industries, it is characterized with improving the quality of residents, developing social production and achieving the comprehensive individual and national development.
1.1 Analysis of current domestic situation
In recent years, China has hosted a great number of sports events, leading to rapidly increasing demand for sports venues. Besides, with people’s growing consciousness of sports, demands for sports ranging from sports facilities in residential communities to major sports games have been increasing year by year. As a matter of fact, sports facilities or venues not only generate favorable cultural benefits but also bring objective economic benefits for sports venues.
2. OPTIMIZATION OF SPORTS INDUSTRY RESOURCES
2.1 Building a hierarchical structure
Establish the target layer, criterion layer and scheme layer. Target layer represents the most important sports industry.
Criterion layer-(influencing factors of the scheme):
c
1 represents the number of employees in that sports industry,2
c
the impact of the sports industry on economy,c
3 resources owned by that industry andc
5 the soundness ofpolicies pertaining to that sports industry. Scheme layer consists of
A
1-sports goods and construction,A
2-commercial sports,
A
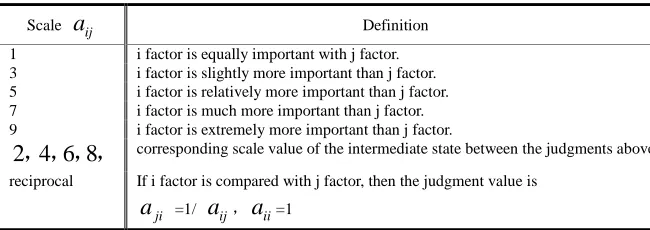
3- leisure SportsTab. 1: 1~9 scale stable
Scale
a
ij Definition1 i factor is equally important with j factor. 3 i factor is slightly more important than j factor. 5 i factor is relatively more important than j factor. 7 i factor is much more important than j factor. 9 i factor is extremely more important than j factor.
2 4 6 8
, ,,,
corresponding scale value of the intermediate state between the judgments abovereciprocal If i factor is compared with j factor, then the judgment value is
ji
a
=1/a
ij, ii [image:2.595.140.465.90.205.2]a
=1Figure 1 is the graph ranging from scale 1 to 9.
Fig. 1: Scale graph from 1 to 9
Tab. 2: Comparison matrix
G
c
1c
2c
3c
41
c
1 8 5 32
c
1/8 1 1/2 1/63
c
1/5 2 1 1/34
c
1/3 6 3 1Tab. 3: Comparison matrix
1
c
A
1A
2A
31
A
1 5 1/52
A
1/5 1 1/53
A
5 5 1Tab. 4: Comparison matrix
2
c
A
1A
2A
31
A
1 3 32
A
1/3 1 33
A
1/3 1/3 1Tab. 5: Comparison matrix
3
c
A
1A
2A
3c
4A
1A
2A
31
A
1 5 3A
1 1 1/5 1/82
A
1/5 1 3A
2 5 1 1/33
A
1/3 1/3 1A
3 8 3 12.4 Single hierarchical arrangement and its consistency test
Consistency indexes are examined. Suppose
λ
max is the maximum eigen-value and n the order of comparisonmatrix, then we have max
1
n
CI
n
λ
−
=
−
. The smallerCI
is, the closer the judgment matrix is to complete consistency. The biggerCI
is, the less known the judgment matrix is.2.5 Total hierarchical arrangement and its consistency test
1 8 5 3
1/ 8 1 1 / 2 1 / 6 1 / 5 2 1 1/ 3
1/ 3 6 3 1
0.603 0.470 0.526 0.667 0.075 0.059 0.053 0.037 0.121 0.118 0.105 0.074 0.201 0.353 0.316 0.222
2.266 0.224 0.418 1.092 A Column vectornormalization Row sum = (0) 0.567 0.056 =W 0.104 0.273 Normalization (0)
1 8 5 5 0.567 2.554 1/ 8 1 1/ 2 1 / 6 0.056 0.225 1 / 5 2 1 1/ 3 0.104 0.422 1/ 3 6 3 1 0.273 1.110 AW = = (0) max
1 2.354 0.225 0.422 1.110 4.073 4 0.567 0.056 0.104 0.273
λ = + + + =
(0) 0.567 0.056 0.104 0.273 w =
Likewise, the judgment matrix can be calculated:
1 2 3 4
1 5 1 / 5 1 3 3 1 5 3 1 1 / 5 1 / 8 1 / 5 1 1 / 5 , 1 / 3 1 3 , 1 / 5 1 3 , 5 1 1 / 3 5 5 1 1 / 3 1 / 3 1 1 / 3 1 / 3 1 8 3 1
B B B B
= = = =
The corresponding maximum eigen-values and eigenvectors are as follows in proper order:
(2) (1) max 2
0.575
3.12,
0.286
0.139
λ
ω
=
=
(3) (1) max 30.624
3.30,
0.240
0.136
λ
ω
=
=
(4) (1) max 40.185
4.05,
0.240
0.575
λ
ω
=
=
Then consistency indexes are used for examination: max
1
n
CI
n
λ
−
=
−
,CI
CR
RI
=
.Tab. 6: RI value
n 1 2 3 4 5 6 7 8 9 10 11
RI 0 0 0.58 0.90 1.12 1.24 1.32 1.41 1.45 1.49 1.51
The judgment matrix
A
is obtained. (0)max 4.073,RI 0.9
λ = = , 4.073 4 0.24 4 1 CI= − =
− and
0.024 0.027 0.1 0.90 CI CR RI
= = = <
show that the inconsistency test of A is valid and moves within the permissible range. Under this circumstance, A’s eigenvector can be used to replace its weight vector.
By the same token, consistency test is conducted on judgment matrixes B1, 2
B
,B3andB4, after which the
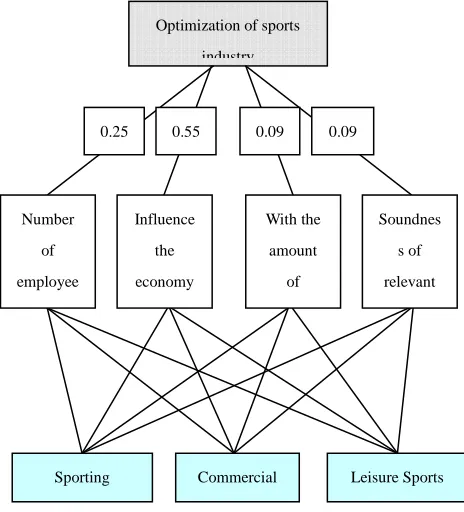
[image:4.595.189.421.460.716.2]weight vector is acquired. The calculation results from the target layer to the scheme layer are drawn, as shown in figure 2 in the light of the hierarchical chart.
Fig. 2: Hierarchical chart
Sporting Commercial
Number of employee Influence the economy With the amount of Soundnes s of relevant Optimization of sports
0.258
0.875
0.674
0.455
0.049 , 0.156 , 0.250 , 0.268
0.637
0.186
0.136
0.575
The computation structure is as follows:
(1) (1) (1) (1) (1)
1 2 3 3
(
,
,
,
)
0.624
0.185
0.252
0.575
= 0.234
0.240
0.089
0.286
0.136
0.575
0.66
0.139
ω
=
ω ω ω ω
(1) (0)
0.587
0.245
0.635
0.624
0.155
0.0567
0.058
0.286
0.250
0.270
0.145
0.77
0.445
0.121 0.575
0.253
0.250
0.184
0.547
w
=
w w
=
=
3. OPTIMIZATION OF STRUCTURAL LAYOUT
Based on regional characteristics, this paper establishes a structural layout model and employs the cellular model for research which is mainly targeted at sports service models. Firstly, this paper figures out the number of China’s newly-built sports venues in the last two decades as shown in table 7.
Tab.7: The number of China’s newly-built sports venues in the last two decades
Year Total Stadium Gym Natatorium Indoor and outdoor swimming pool Sports venues with fixed seating
1980 709 10 9 / 44 96
1985 700 47 29 1 135 137
1990 3691 27 34 4 105 60
1995 1007 36 37 1 80 43
1999 572 6 24 / 15 14
In recent years, the demand for sports facilities has been increasing in China, which results from the current sports situation of all Chinese people. Thus, more efforts are devoted to building the sports facilities and stadiums across the country. In addition, with the acceleration of China’s new-type urbanization, demands for sports facilities in new-type cities and towns have been growing year by year. Stadiums or sports facility groups should bring into play the covering effect. However, what kind of model can make the coverage area reasonable? To solve this problem, this paper establishes a hexagonal cellular model.
Tab. 8: Comparison of three kinds of shapes
Shape of residential areas Regular triangle Square Regular hexagon Neighborhood distance
r
2
r
3
r
Proportion of residential areas1 r
.
3
22r
22 r
.
6
2 Width of overlapping areasr
0
.
59
r
0
.
27
r
Proportion of overlapping areas1
.
2
π
r
20
.
73
π
r
20
.
35
π
r
2condition of the same radiation radius r, the neighborhood distance, proportion of residential areas, width of overlapping areas and proportion of overlapping areas of three kinds of residential areas are calculated, as shown in table 8.
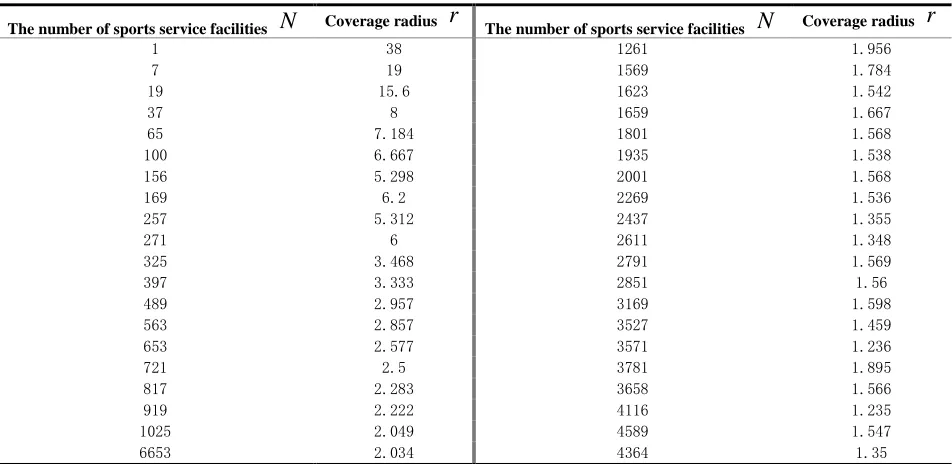
[image:6.595.69.545.480.712.2]From table 8, we can see that the shape of regular hexagon is closest to the ideal circular form and can meet the needs of coverage area effectively. So the cellular structure is built using the center of regular hexagon which extends outward. The process is shown below.
Fig. 3 Process
Tab. 9: Statistics table
The number of sports service facilities
N
Coverage radiusr
The number of sports service facilitiesN
Coverage radiusr
1 38 1261 1.956
7 19 1569 1.784
19 15.6 1623 1.542
37 8 1659 1.667
65 7.184 1801 1.568
100 6.667 1935 1.538
156 5.298 2001 1.568
169 6.2 2269 1.536
257 5.312 2437 1.355
271 6 2611 1.348
325 3.468 2791 1.569
397 3.333 2851 1.56
489 2.957 3169 1.598
563 2.857 3527 1.459
653 2.577 3571 1.236
721 2.5 3781 1.895
817 2.283 3658 1.566
919 2.222 4116 1.235
1025 2.049 4589 1.547
6653 2.034 4364 1.35
As the boundary of circular region lies in the center of the outermost hexagon, we can get the following formula through the law.
3
In this formula,
N
represents the number of hexagons needed to be spread the circular area.d
D
n
=
In this formula,
D
stands for the diameter of circular area andd
the diameter the inscribed circle of hexagon.By way of calculation, this paper obtains the statistics table of the number of sports facilities or stadiums
N
and coverage radiusr
, as shown in table 9.N
=
1
N
= + +
3 2 2
N
=
3
+
4
+
5
+
4
+
3
As the above graphs show, this paper finds out the relationship between the diameter
d
and the number of hexagonsN
. The graph resulting from the combinations of hexagons has a higher fitting degree with the circular form.CONCLUSION
Being one of China’s sunrise industries, the sports industry consists of physical industry and mental industry. As a component of national economy, the sports industry attaches importance to market efficiency and economic benefits. But different from other industries, it is characterized with improving the quality of residents, developing social production and achieving the comprehensive individual and national development.
Stadiums or sports facility groups should bring into play the covering effect. To solve this problem, this paper establishes a hexagonal cellular model. Based on regional characteristics, this paper builds a structural layout model and employs the cellular model for research which is mainly targeted at sports service models. In recent years, China has hosted a great number of sports events, leading to rapidly increasing demand for sports venues. Besides, with people’s growing consciousness of sports, demands for sports ranging from sports facilities in residential communities to major sports games have been increasing year by year. As a matter of fact, sports facilities or venues not only generate favorable cultural benefits but also bring objective economic benefits for sports venues.
Acknowledgment
Name of project: "Research on college students physical health under the concept of healthy campus". Negative responsibility: Wei Junfang. Project number: Y201329431. Project type: General Project
REFERENCES
[1] PENG Peigen. Journal of Architecture ,2001(10): 30 [2] QIAN Feng. Journal of Architecture,1997(9): 51-53
[3] ZHOU Peide. Algorithms for some problems in geometric covering Beijing: Journal of Beijing Institute of Technology,1995.
[4] GUO Jinyu, Research and application of Analytic Hierarchy Process. 2007.3
[5] DENG Xue, Analysis and application research of AHP’s weight calculation method. South China University of Technology 2012.07
[6] LI Xiaojian. Economic Geography [M].Beijing: Higher Education Press,2002,86-90.
[7] MA Zhihe and MA Zhiqiang. Research on central place theory and spatial distribution of urban sports facilities. Beijing Sport University 2004.4