N A N O E X P R E S S
Open Access
Simple Route to Obtain Nanostructured
CeO
2
Microspheres and CO Gas Sensing
Performance
Edgar R. López-Mena
1*, Carlos R. Michel
2, Alma H. Martínez-Preciado
3and Alex Elías-Zuñiga
1Abstract
In this work, nanostructured CeO2microspheres with high surface area and mesoporosity were prepared by the coprecipitation method, in absence of a template. The reaction between cerium nitrate and concentrated formic acid produced cerium formate, at room temperature. Further, calcination at 300 °C yielded single-phase CeO2 microspheres, with a diameter in the range 0.5–2.6μm, the surface of these microspheres is completely
nanostructured (diameter about 30–90 nm). CeO2microspheres were used to fabricate a sensor device, and it was tested for intermediate CO gas concentrations (200–800 ppm). The detection of 200 ppm carbon monoxide was observed at 275 °C, with a response time of 9 s, using an applied frequency of 100 kHz. The detection of changes on the CO gas concentration was studied at different temperatures and applied frequencies. The results revealed a reproducible and stable gas sensing response.
Keywords:CeO2, Coprecipitation, Microspheres, Gas sensor
Background
Cerium oxide (CeO2) is one of the most reactive rare earth
oxides, with unique physical and chemical properties, such as oxygen storage capacity, oxygen deficiency, and elec-tronic conductivity [1–4]. These characteristics have allowed CeO2to be widely used in catalysis, energy
stor-age, biosensors, among others [5–10]. In recent years, CeO2has also been investigated as gas sensor; Izu et al.
used the mist pyrolysis method to prepare CeO2at 700 °
C. Here, a powder with an average particle size of 200 nm and a random network structure was obtained [11]. In this study for a comparative purpose, CeO2with average
par-ticle sizes of 200 and 2000 nm was used to fabricate a re-sistive oxygen gas sensor. They concluded that the response time (8 s) for the sensor with smaller particle size (200 nm) was approximately one-tenth of the time taken by the sensor with a larger particle size (2000 nm) at 712 ° C. Moreover, when the sensor kinetics is controlled by the diffusion of oxygen vacancies, the response time varies with the particle size. These conclusions were supported
in a previous work reported by Beie et al. [12]. Xie et al. who obtained CeO2nanoparticles (10–15 nm) at 500 °C
using a solvothermal method [13]. They used these nano-particles to prepare a humidity sensor device. In a humid-ity range of 11–98% (relative humidity, RH), the response and recovery times were 10 and 3 s, respectively. In addition, two sensing mechanisms were reported. At low RH, the process is given by conduction and polarization of the grains of CeO2, whereas at high RH, the conduction
process is attributed to decomposition and polarization of the absorbed water.
In recent decades, there has been an ever-increasing demand for gas sensors. CO has attracted the attention for its monitoring due to the health risks caused by prolonged exposure to this gas. Some of the character-istics of CO are colorless, odorless, tasteless, and non-irritating but lethal. CO is a poisonous gas produced by the incomplete burning of carbon-based fuels. At con-centrations below 200 ppm, this gas induces slight headache and dizziness. In a range between 200 and 400 ppm, the exposure to CO promotes a slight head-ache and loss of judgment. At 800 ppm, the health risk is greater (dizziness, nausea, and convulsions), being lethal at 12800 ppm with only 3 min of exposure [14]. * Correspondence:[email protected]
1Escuela de Ingenieria y Ciencias, Tecnologico de Monterrey, Campus Monterrey, Ave. Eugenio Garza Sada 2501, 64849 Monterrey, N.L., México Full list of author information is available at the end of the article
Several semiconductor materials have been tested as CO gas sensor; SnO2is one of the most tested materials
for this purpose [15–18]. CeO2has also been tested as a
CO sensor though low (<100 ppm) or high (>1000 ppm) is usually reported. At low CO gas concentrations, Itoh et al. used zirconium-doped cerium oxide to prepare a sensor device [19]. This device was tested in CO concen-tration in a range between 0.1 and 2 ppm though no details for response time were given. Durrani et al. used CeO2commercial pellets to obtain thin films at 500 °C
as sensor device [20]. To study the CO gas sensing re-sponse, operation temperatures in the range 300–500 °C and gas concentrations between 500 and 50,000 ppm were tested. With these conditions, they found that the optimum operating temperature was around 390 °C and the response and recovery time were 45 and 25 s, respectively. Izu et al. studied CeO2thick films using Pt/
alumina as a catalyzer; different synthesis temperatures were tested in the range 800–1100 °C [21]. The best result was obtained at 450 °C using 5000 ppm. The response time was 2 s with an average particle size of 58 nm.
The most important parameters involved in the detec-tion of gas species are the operating temperature, sensi-tivity, selecsensi-tivity, and long-term stability. These can be improved in a material by decreasing its particle size to the nanometer scale, as well as an increase in the poros-ity [22]. According to what several authors have reported [23–25], the sensitivity of a material is reciprocal to the grain size as long as the depletion region extends over the grain. Thus, there is an importance to get a grain size twice smaller than the depletion layer thickness, and this occur when the grain size is in a nanometer scale (D< 2L,L= depletion layer). As the grain size is smaller, a higher surface area is obtained. To maximize the spe-cific surface area, the particles should be loosely packed; then a very small contact area between each other is ob-tained. This is obtained with spherical or semispherical morphology. However, to improve the gas sensing per-formance, an excellent connectivity between the grains is necessary. In this point, the synthesis temperature plays a key role. If the material is synthesized at high temperature, the grain size increases as well as the con-nectivity between them. However, the surface area de-creases, and given that the gas sensing mechanism is surface area dependent, we will have an effect in this phenomenon. For porous materials, the gas is easy to be diffused into the bulk, which promotes the rapid re-sponse and recovery of the sensor. In addition, when a material is mesoporous (2 nm < pore radii < 50 nm), the gas transport occurs by molecular diffusion, whereas if the material is microporous (pore radii < 1 nm), the gas transport becomes a surface diffusion. So, it is also im-portant to control the morphology.
With this purpose, CeO2has been synthesized by
nu-merous methods where different chemical agents were used. To mention some, Xu et al. synthesized broom-like porous CeO2hierarchical architecture by
hydrother-mal method [26]. For this synthesis, dihydrate trisodium citrate, urea, and cerium nitrate hexahydrate were used. The optimum reaction time and temperature were 39 h and 120 °C, respectively. Surface area values between 30 and 166 m2/g were reported. Large-scale CeO2
nanowires were prepared using the sol-gel method process at 600 °C by Wu et al. where porous anodic alumina template and cerium nitrate hexahydrate were used [27]. Micro- and nano-sized spheres have been ob-tained with different precursor materials. For example, Liu et al. fabricated mono-dispersed CeO2hallow
nano-spheres at 300 °C; with an average size in the range of 50–200 nm, surface area value of 61 m2/g and pore size of 50 nm were obtained [28]. In this synthesis, tetrahy-drate sulfate cerium and ammonium were employed. In addition, CeO2 microspheres were obtained at 600 °C
by Feng et al.; cerium nitrate hexahydrate, potassium sulfate, and nitric acid were used for this purpose; sur-face area value of 15.6 m2/g was reported [29].
In a previous work, hierarchical 3D architectures of CeO2were obtained at 400 °C by the microwave-assisted
coprecipitation method. For this synthesis process, these were used ceric ammonium nitrate and formic acid as precursor materials. The morphology of the samples ob-tained from 170 to 600 °C was composed of hollow mi-crospheres, with a size between 1.5 and 10 μm. These powders were used to fabricate CO gas sensor devices. As a general trend in gas sensing characterization, no steady state was observed and the response time was at least 20 s [30].
In the present work, to study the effect on microstruc-ture and synthesis temperamicrostruc-ture, a similar synthesis method was employed to prepare CeO2, but cerium
ni-trate was used instead of ceric ammonium nini-trate. The first aim in this work was to get CeO2 at lower
temperature and with this an increase in the surface area, which will be seen in the sensor device perform-ance. The sensing characterization was carried out at lower temperature than in the previous work. The effect of the cerium nitrate in the morphology was analyzed by FESEM. Moreover, the surface area and pore size were determined by the BET method. The gas sensing behav-ior was analyzed using an alternating current (AC), with different operational temperatures, frequencies, and gas concentrations. The second aim was to get stable elec-trical measurements; both aims were achieved.
Methods
synthesize nanostructured CeO2 microspheres was the
following: 0.76 g of cerium nitrate was dissolved into 10 ml of concentrated formic acid (>95%), under strong stirring. The resultant suspension was stirred for 24 h, at room temperature. Later, the solvent was evaporated intermittently using a domestic microwave oven, in steps of 40 s. The resulting material was dried overnight at 100 °C and later calcined to 200 and 300 °C for 5 h, in air.
The crystal structure was analyzed by X-ray powder diffraction (XRD), using an Empyrean (PANalytical) diffractometer, with Cu-Kαradiation (λ= 0.15418 nm),
and diffuse reflectance FT-IR spectroscopy, using a Perkin-Elmer GX3 spectrometer, with samples dissolved in KBr. The surface area was determined by the Bru-nauer–Emmett–Teller (BET) method, and the pore size distribution was calculated by the Barrett–Joyner– Halenda (BJH) method, using desorption branch. Before measurements, the sample was vacuum degassed at 200 °C, for 12 h, using a TriStar II Plus apparatus.
The morphology of the samples was investigated by FESEM (Hitachi, SU8010) and HRTEM (FEI, Tecnai F30) with an accelerating voltage of 200 kV. No special treatment was applied for the FESEM analysis. The sam-ple for TEM characterization was prepared by placing a drop of colloidal solution on carbon-coated copper grid and dried at room temperature.
The gas sensing characterization was performed on thick films made with the CeO2microspheres. The sensor
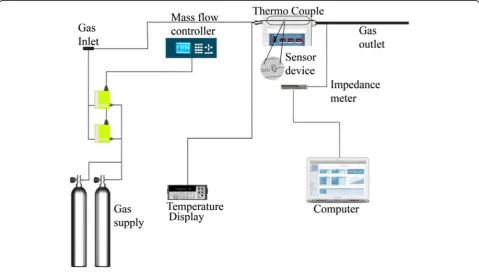
device was placed into a tube-type furnace, which served as a test chamber. Impedance measurements were performed using an LCR meter (Agilent 4263B). The test gases were CO (99.3%) and air (base gas), both extra dry, purchased from Infra, México. A mass flow control system (MKS Instruments, 647C) was used to introduce the gases into the test chamber. The response (tres) and recovery (trec) times are defined as the times
elapsed to reach 90% of the change in electrical imped-ance, upon exposure to the test and the base gas, respect-ively. Figure 1 displays a scheme of the experimental setup.
Results and Discussion
Figure 2a shows XRD patterns of samples calcined from 100 to 300 °C. At 100 °C, single-phase cerium formate (JCPDF No. 49.1245) was formed. This compound crys-tallizes in a trigonal crystal structure, with cell parame-ters a=b= 10.682 Å and c= 4.109 Å. Calcination at 200 °C produced mainly cerium formate, but diffraction lines of CeO2 (JCPDF No. 34-0394) can be noticed at
2(θ) = 28.54°, 47.48°, and 56.33°. At 300 °C, diffraction peaks are located at 2(θ) = 28.53°, 33.03°, 47.42°, 56.29°, and 59.02° which are related to the planes (111), (200), (220), (311), and (222), which correspond to CeO2, with
cubic fluorite-type structure and space group Fm-3m. The lattice parameter previously reported for cubic CeO2 is a= 5.411 Å, whereas in this work, a calculated
value of 5.41417 Å was obtained. According to Ferreira
[image:3.595.58.538.445.718.2]et al., the lattice expansion of CeO2can be attributed to
the reduction of Ce4+to Ce3+, which involves a decrease in electrostatic force [31].
[image:4.595.57.291.85.465.2]FT-IR spectra of calcined samples are shown in Fig. 2b. Samples calcined at 100 and 200 °C show broad absorp-tion bands of the asymmetric and symmetric stretching vibrations of OHO, placed at 3080–3700 cm−1. The IR absorption peaks at 2900 cm−1 are assigned to C–H stretching vibrations. The bands at 1650–1540 cm−1and 1447–1340 cm−1 correspond to the asymmetric and symmetric stretching vibrations of the bound carboxylic groups (COO−). And the band at 780 cm−1is related to the stretching vibrations of C–C groups. The spectra ob-tained from samples annealed at 200 and 300 °C show the characteristic band of Ce–O stretching vibrations, located at around 500 cm−1 [32]. The spectrum of a sample calcined at 300 °C shows the presence of a small amount of organic matter.
Figure 3 shows adsorption–desorption isotherms and BJH pore size distribution for nanostructures CeO2 microspheres. The isotherm can be ascribed as
type IV, which means that is associated to capillary condensations according to IUPAC classification with type H3 hysteresis which is characteristic of the mesoporous material with slit-shaped pores [33]. The adsorption increased from low pressure of about 0.01 to 0.8, and it was followed by a sharp rise from 0.8 and above due to substantial interparticle poros-ity [34]. The BET surface area was calculated at 137 m2/g, whereas the average pore diameter was 9 nm. Similar results (155 m2/g, 3.5 nm) were re-ported by Hung et al. where a tri-block copolymer was used as template [35].
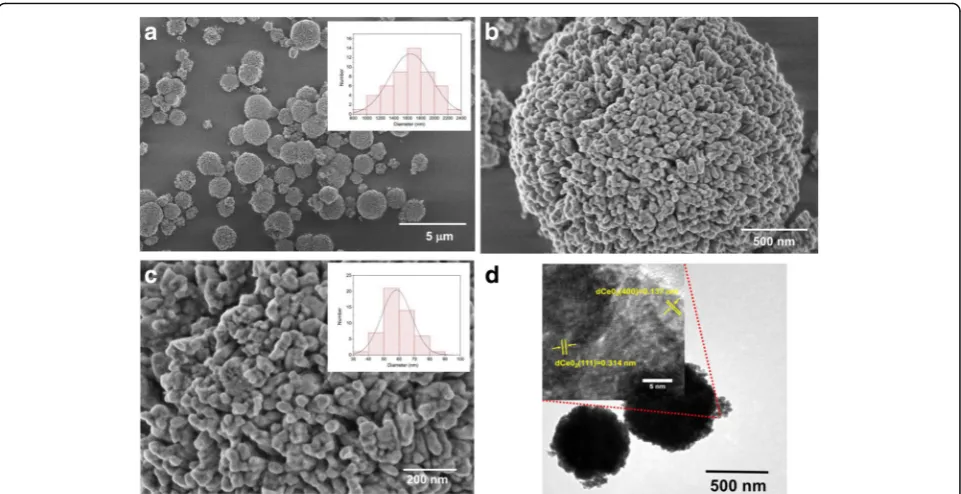
Figure 4a–c shows FESEM images of a CeO2sample
calcined at 300 °C. Figure 4a displays porous micro-spheres with diameters between 0.8 and 2.4 μm (inset of figure). Figure 4b, c also shows detailed characteris-tics of the morphology of CeO2 microspheres.
Exten-sive porosity among nanoparticles with size between 30 and 90 nm can be noticed (inset of figure). HRTEM image (Fig. 4d) shows individual CeO2 microspheres,
with nanoparticles on their surface. The inset of this image displays numerous lattice planes, which confirms the crystallinity of the sample. Besides, the interplanar distance of planes (400) and (111) was determined, resulting in 0.13 and 0.31 nm, respectively.
The CO sensing characterization was carried out by measuring the transient response where electrical im-pedance was used. The electrical imim-pedance (Z) can be written in the polar or Cartesian forms by means of the Eq. (1):
Fig. 2aXRD patterns andbFT-IR spectra for the precursor powder calcined at different temperatures
[image:4.595.306.538.513.693.2]Z¼j jeZ iφ¼RþiX ð1Þ
where |Z| is the magnitude of impedance,iis defined as the imaginary unit,φ= arg(Z),Ris the resistance, andX is the reactance. An advantage of recording |Z| vs. time graphs, over direct current measurements, is that the gas response could be analyzed using different frequen-cies. Response is defined by Eq. (2):
R¼ Δj jZ Zair
j j¼
Zair j j−jZCOj
Zair
j j ð2Þ
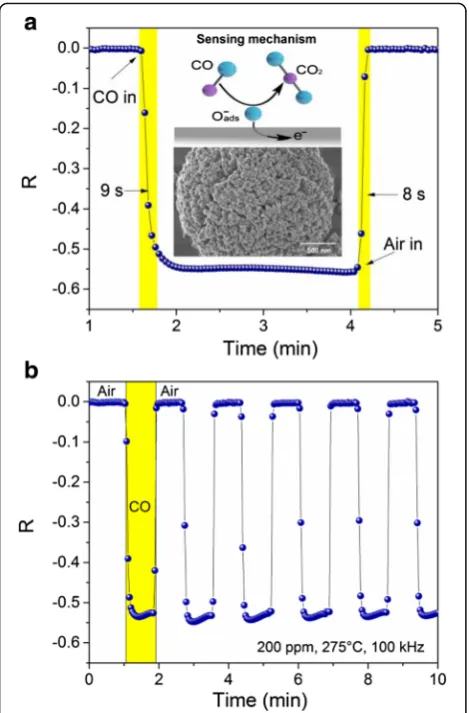
Figure 5a, b shows the transient response obtained in air and 200 ppm CO, using an applied frequency of 100 kHz, at 275 °C. As it is also possible to note a decrease in the magnitude of the impedance (|ΔZ|) occurred once CO (reducing gas) was injected, and upon the introduction of air, |ΔZ| returned to its ori-ginal value, which corresponds to an n-type semicon-ductor material. The average variation of |ΔZ| was 0.3 MΩ, where the steady state can be observed. The steady state occurs when the process of charge transfer between gas and sensor device and continues until equilibrium is reached [36, 37]. The gas sensing re-sponse is based on surface reaction between adsorbed oxygen and the gas to be detected. According to what was described by Gong et al., the interaction of gas to be sensed and the thick film includes two steps [38]. In the first step, oxygen from the ambient is adsorbed on the surface of the film and extracts electrons from the
material. This depends on the operating temperature as follows:
O2ðadsÞþe−↔0−2ðadsÞ;T<100OC ð3Þ
O2−ðadsÞþe−↔2Oð−adsÞ;T ¼100−300OC ð4Þ
O−ðadsÞþe−↔O−2ðadsÞ; T >300O
C ð5Þ
In the second step, CO molecules can react with oxy-gen species on surface of the sensor device which reduce the electrical resistance. It can be described as:
2COþO−2→2CO2þe−; T <100OC ð6Þ
COþO−→CO2þe−;T ¼100−300
O
C ð7Þ
COþO−2→CO2þ2e−; T >100OC ð8Þ
From Fig. 5a, a response time (tres) of 9 s was
deter-mined, which corresponds to the elapsed time mea-sured at the 90% of the variation of Δ|Z| in the tested gas. When CO is removed,Δ|Z| returned to its original value; recovery time (trec) of 8 s was calculated
analo-gous to tres. The recovery process is determined by two
steps, oxygen re-adsorption from the ambient at the surface and re-oxidation of the oxide [39]. Nanometric grain size and large grain boundary could enhance the rapid recovery time and the Δ|Z| value due to the adsorption of the oxygen on the surface. Figure 5b displays repeatability in the detection of CO, and this
Fig. 4a–cFESEM at different magnificatios.aandcshows microspheres and grain size distributions histogram.dHRTEM images of CeO2
can be observed with the Δ|Z| value after several cy-cles, which indicates that |ΔZ| returns to its initial value and the CO adsorbed on the surface was revers-ible. A previous work [30] has shown that the response time was 47 s, at 250 °C, 100 Hz and 300 ppm of CO, and the results did not show a steady-state. For a com-parative purpose, Izu et al. [40] prepared two samples of CeO2. The first named core–shell nanoparticles
(with Au 4 wt%), and the second named precipitated nanoparticles. The average particle size was 30 nm for the sensor devices. The gas sensing performance was carried out at 450 °C. The results show that the sensor prepared using the core–shell nanoparticles exhibits a response time of 46 s whereas the response time of the sensor fabricated using the precipitated nanoparticles was 49 s as an average, when CO concentrations varies from 1% to 5000 ppm. The recovery time reported for the measurements was an average of 50 s. Durrani et al. [41] prepared thin film of tin oxide mixed with cerium
oxide by physical vapor depositions; the films were annealed at 500 °C. When the film was exposed to 500 ppm of CO at 430 °C, the response time was 26 s and the recovery time was 30 s. The morphology re-ported was a well-separated conical nano columnar structure. In both works, the response and recovery time are much larger that obtained in this work where nanostructured CeO2 microspheres was used to
pre-pared sensor device.
The sensitivity as a function of CO gas concentrations from 500 to 800 ppm for the CeO2thick film at 275 °C and
100 kHz is shown in Fig. 6a. From this graph, a non-linear variation of Δ|Z| with gas concentration can be noticed (bottom line). This behavior can be described by the Freun-dlich adsorption isotherm:N = kCγ; wherekandγare con-stants and N and C are the concentrations of absorbed oxygen and CO, respectively [42]. Sinceγis smaller than 1, the adsorption of oxygen depends weakly onC.As is pos-sible to notice, when the CO gas is removed from the chamber test, the Δ|Z| value recovers its initial value in
Fig. 5Carbon monoxide gas sensing response vs. time with a concentration of 200 pm, operate at 275 °C and 100 KHz.aSingle cycle to determine response and recovery time.bSeveral cycles to determine repeatability in the detection of CO (shorter cycles)
[image:6.595.57.292.87.444.2] [image:6.595.306.539.338.694.2]each cycle, which means that the CeO2sensor device has a
good response for different CO concentrations. Figure 6b shows an adsorption isotherm plot from data of Fig. 6a.
To determine the response of the sensor device, sev-eral measurements were carried out at different temper-atures, gas concentrations, and frequencies. Figure 7a, b compares the CO sensing response measured at 266 °C and 100 kHz, with 100 and 200 ppm, respectively. When 100 ppm was supplied, the average value of Δ|Z| was 0.25 MΩ and tres= 10 s, whereas with 200 ppm, the
values were Δ|Z| = 0.28 MΩ and tres= 11 s. The pore
size distribution in this material corresponds to mesopo-rous; then, the gas diffusion through a porous material depends on the pore size, and this can be described by Knudsen diffusion [43]:
Dk¼ 4r
3
ffiffiffiffiffiffiffiffiffi
2RT
πM r
ð9Þ
whereT is the temperature,rpore radius, M molecular weight of the diffusing gas, and R gas ideal constant. When molecules of the target gas are in contact with the porous surface, it can react. The reaction is assumed to follow a first-order kinetic function. If Knudsen diffu-sion and the last one are assumed, a well-known diffudiffu-sion equation can be formulated:
δCA δt ¼Dk
δ2 CA
δx2 −kCA ð10Þ
whereCAis the concentration of the target gas,tis time,
Dkis Knudsen diffusion coefficient,xis distance (depth)
from the top surface of the sensing layer, and k is rate constant. This means that the concentration of the oxy-gen in the film should decrease due to the surface reac-tion.Dkcan be expressed as a function of CA. Liu et al.
[44] in a theoretical approach tested different gas con-centrations and found an expression to response time (tres= 0.85L2/D). In these works, it was concluded that
response time is dominated by sensor thickness (L) and diffusion coefficients (D); the last one depends on the gas concentration. The response times for 100 and 200 ppm are very closed and could follow this relation. However, as the difference is small, it could be attributed to experimental error. However, a differ-ent behavior was noticed. From Fig. 7a, an absence of the steady state was observed; the opposite occurs for Fig. 7b. For the two gas concentrations tested (100 and 200 ppm), when CO gas was pumped out, Δ|Z| recovered its initial value. This behavior was de-scribed by Wolkenstein in [45]. A general description could be as follows: at the beginning of the process, there are not enough molecules of CO available to react with the surface oxygen adsorption sites. This changes after some seconds, when the CO molecules get adsorbed. Figure 7a shows in a graphical manner the described behavior. After that initial stage, the steady state is observed. In contrast, when CO con-centration increases, more molecules react with oxy-gen vacancies. This is illustrated in Fig. 7b. This allows to observe the steady state when 200 ppm of CO was supplied and then a higher response is ob-tained. In both cases, the desorption is completely ir-reversible, which indicates that R returns to the original value. With this, neutral and charged particles are removed from the surface during desorption. Even more, this value was constant after several cycles which indicate a long-term stability.
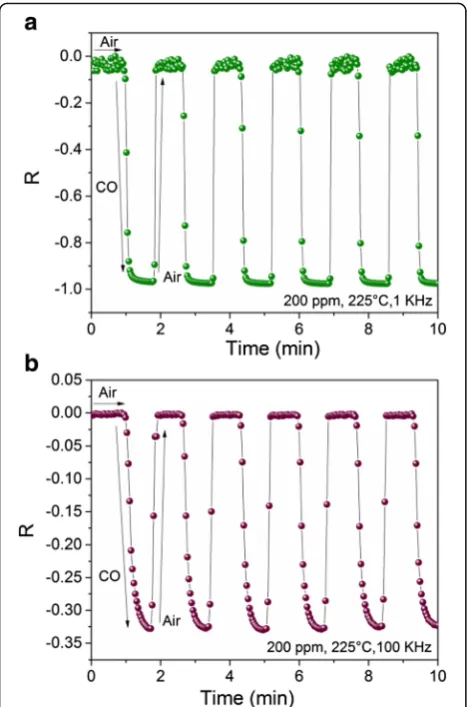
To study the frequency effect over the sensor device response, the samples were tested at 1 and 100 kHz; the results are shown in Fig. 8a, b, respectively. For these measurements, an operating temperature of 225 °C, a concentration of 200 ppm of CO gas, and a time of
[image:7.595.57.291.298.699.2]10 min of exposition to this gas were used. From Fig. 8a, it is observed that after several cycles, the average value of
Δ|Z| = 43 MΩand thetres= 12 s which reveals the steady
state. When 100 kHz is applied, Δ|Z| was estimated in 0.17 MΩwith atres= 13 s. As it is possible to notice from
Fig. 8, the average response of the sensor decreases about two orders of magnitude when 100 kHz was applied. This can be understood as a low-pass filter [46], and the fre-quency response function can be expressed as:
R ið Þ ¼ω R0ð Þiω
1þτð Þiω ð11Þ
where R0is the initial response, ω is the frequency, τis
the system time constant, andiis the imaginary unit. In addition, a decrease of noise was observed and this noise is known as flicker noise or 1/f noise. In addition, the ef-fect of the temperature operation over response time was noticed. When measurements were carried out with the same conditions (100 kHz, 200 ppm; Figs. 7b and 8b), the
response time increased slightly when the operating temperature decreased (266 to 225 °C, respectively). This effect was widely studied by Helwig et. al and is related with the changes in activation energy on the surface dur-ing adsorption and desorption process [47].
The reproducibility of gas sensing response at 100 kHz and 225 °C when different gas concentrations were sup-plied is shown in Fig. 9. In the first cycle, 200 ppm of CO was applied, followed by two 100-ppm cycles, and fi-nally, a 200-ppm cycle was tested. After these cycles,
Δ|Z| remains constant, and this value for 200 ppm was 0.17 MΩ whereas for 100 ppm was estimated in 0.15 MΩ. When the CO was removed from the chamber test, Δ|Z| recovers its initial value, which indicates a good response and reproducibility for different gas concentrations.
Conclusions
Nanostructured CeO2 microspheres with large surface
area and mesoporosity were synthesized by the copreci-pitation method at low calcination temperature. Com-pared to previous results obtained from CeO2 where
hierarchical architectures were obtained, in our results, a narrower particle size distribution was obtained. Also, in this work, microspheres also displayed a uniform nano-structured surface morphology. The gas sensor device based on as-prepared CeO2 microspheres exhibited
more stable electrical measurements, which were ob-served by the development of the steady state; slightly upper response time (tres) was obtained using a lower
operating temperature and a good recovery performance. The improvement of the CO sensing response can be at-tributed to a larger porosity and less particle agglomer-ation of CeO2microspheres.
Fig. 8Variations ofRwith time measured in 200 ppm (225 °C) ata1 andb100 kHz
[image:8.595.57.291.87.441.2] [image:8.595.305.539.527.702.2]Acknowledgements
This work was partially funded by Tecnológico de Monterrey, Campus Monterrey, through the Research Chair in Nanotechnology and Devices Design. C.R.M. is grateful to Coordinación General Académica of Universidad de Guadalajara, for partial financial support through the PRO-SNI 2015 program. The authors are thankful to Reina A. Mauricio-Sánchez (CINVESTAV-Querétaro) for assistance in the FT-IR measurements.
Authors’Contributions
CRM and AHM-P performed the synthesis and gas sensing characterizations. ERL-M and AE-Z performed the structural characterizations, FESEM, and HRTEM analysis. ERL-M and CRM wrote the paper. All authors discussed the results and the implications of this manuscript. All authors read and approved the final manuscript.
Competing Interests
The authors declare that they have no competing interests.
Publisher’s Note
Springer Nature remains neutral with regard to jurisdictional claims in published maps and institutional affiliations.
Author details 1
Escuela de Ingenieria y Ciencias, Tecnologico de Monterrey, Campus Monterrey, Ave. Eugenio Garza Sada 2501, 64849 Monterrey, N.L., México. 2
Departamento de Física, CUCEI, Universidad de Guadalajara, 44410 Guadalajara, Jal., México.3Departamento de Ingeniería Química, CUCEI, Universidad de Guadalajara, 44410 Guadalajara, Jal., México.
Received: 16 December 2016 Accepted: 26 February 2017
References
1. Koelling DD, Boring AM, Wood JH (1983) The electronic structure of CeO2
and PrO2. Solid State Commun 47:227–232
2. Phokha S, Pinitsoontorn S, Chirawatkul P, Poo-arporn Y, Maensiri S (2012) Synthesis, characterization, and magnetic properties of monodisperse CeO2
nanospheres prepared by PVP-assisted hydrothermal method. Nanoscale Res Lett 7:425
3. Pfau A, Schierbaum KD (1994) The electronic structure of stoichiometric and reduced CeO2surfaces: an XPS, UPS and HREELS study. Surf Sci 321:71–80
4. Johansson B (1978) Energy difference between trivalent and tetravalent metallic cerium and other f-elements: stability study of various lanthanide-and actinide-halides lanthanide-and -oxides. J Phys Che Solids 39:467–484 5. Miceli P, Bensaid S, Russo N, Fino D (2014) CeO2-based catalysts with
engineered morphologies for soot oxidation to enhance soot-catalyst contact. Nanoscale Res Lett 9:254
6. Busquets MA, Sabaté R, Estelrich J (2014) Potential applications of magnetic particles to detect and treat Alzheimer’s disease. Nanoscale Res Lett 9:358 7. Abdelrahim MYM, Benjamin SR, Aguilera LMC, Rodríguez IN, Cisneros JLHH,
Delgado JJ, Santander JMP (2013) Study of the electrocatalytic activity of cerium oxide and gold-studded cerium oxide nanoparticles using a sonogel-carbon material as supporting electrode: electroanalytical study in apple juice for babies. Sensors 13:4979–5007
8. Liu H, Liu H (2016) Preparing micro/nano core-shell sphere CeO2via low
temperatura route for improved lithium storage performance. Matt Lett 168:80–82
9. Umar A, Kumar R, Akhtar MS, Kumar G, Kim SH (2015) Growth and properties of well-crystalline cerium oxide (CeO2) nanoflakes for
environmental and sensor applications. J Colloid Interf Sci 454:61–68 10. Temerk Y, Ibrahim H (2016) A new sensor based on In doped CeO2
nanoparticles modified glassy carbon paste electrode for sensitive determination of uric acid in biological fluids. Sensor Actuat B-Chem 224: 868–877
11. Izu N, Shin W, Murayama M, Kanzaki S (2002) Resistive oxygen gas sensor based on CeO2fine powder prepared using mist pyrolysis. Sensor Actuat
B-Chem 87:95–98
12. Beie HJ, Gnörich A (1991) Oxygen gas sensor based on CeO2thick and thin
films. Sensor Actuat B-Chem 4:393–399
13. Xie W, Liu B, Xiao S, Li H, Wang Y, Cai D, Wang D, Wang L, Liu Y, Liu Q, Wang T (2015) High performance humidity sensors based on CeO2
nanoparticles. Sensor Actuat B-Chem 215:125–132
14. Fine GF, Cavanagh LM, Afonja A, Binions R (2010) Metal oxide semi-conductor gas sensor in environmental monitoring. Sensors 10:5469–5502
15. Srivastava RK, Lal P, Srivastava SK (1994) Sensing mechanism in tin oxide-based thick-film gas sensors. Sensor Actuat B-Chem 21:213–218 16. Rella R, Serra A, Siciliano P, Vasanelli L, De G, Licciulli A (1997) CO sensing
properties of SnO2thin films prepared by the sol-gel method process. Thin
Solid Films 304:339–343
17. Bakin AS, Bestaev MV, Dimitrov DT, Moshnikov VA, Tairov YM (1997) SnO2
based gas sensitive sensor. Thin Solid Films 296:168–171
18. Endres HE, Göttler W, Hartinger R, Drost S, Hellmich W, Müller G, Braunmuch CB, Krenkov A, Perego C, Sberveglieri G (1996) A thin-film SnO2sensor
system for simultaneous detection of CO and NO2with neural signal
evaluations. Sensor Actuat B-Chem 36:353–357
19. Itoh T, Izu N, Akamatsu T, Shin W, Miki Y, Hirose Y (2015) Elimination of flammable gas effects in cerium oxide semiconductor-type resistive oxygen sensors for monitoring low oxygen concentrations. Sensors 15:9427–9437 20. Durrani SMA, Al-Kuhaili MF, Bakhtiari IA (2008) Carbon monoxide
gas-sensing properties of electron-beam deposited cerium oxide thin films. Sensor Actuat B-Chem 134:934–939
21. Izu N, Nishizaki S, Itoh T, Nishibori M, Shin W, Matsubara I (2009) Gas response, response time and selectivity of a resistive CO sensor based on two connected CeO2thick films with various particle sizes. Sensor Actuat
B-Chem 136:364–370
22. Tiemann M (2007) Porous metal oxides as gas sensors. Chem Eur J 13:8376–8388
23. Xu C, Tamaki J, Miura N, Yamazoe N (1991) Grain size effects on gas sensitivity of porous SnO2-based elements. Sensor Actuat B-Chem 3:147–155
24. Barsan N, Koziej D, Weimar U (2007) Metal oxide-based gas sensor research: how to? Sensor Actuat B-Chem 121:18–35
25. Gao L, Cheng Z, Xiang Q, Zhang Y, Xu J (2015) Porous corundum-type In2O3nanosheets: synthesis and NO2sensing properties. Sensor Actuat
B-Chem 208:436–443
26. Xu B, Zhang Q, Yuan S, Zhang M, Ohno T (2015) Morphology control and characterization of broom-like porous CeO2. Chem Eng J 260:126–132
27. Wu GS, Xie T, Yuan XY, Cheng BC, Zhang LD (2004) An improved sol-gel template synthetic route to large scale CeO2nanowires. Mater Res Bull 39:
1023–1028
28. Liu S, Xie M, Guo X, Ji W (2013) Synthesis of CeO2hallow nanospheres via
redox reaction based self-templating approach. Mater Lett 105:192–195 29. Feng T, Wang X, Feng G (2013) Synthesis of novel CeO2microspheres with
enhanced solar light photocatalyic properties. Mater Lett 100:36–39 30. Michel CR, Preciado AHM (2014) CO sensor based on thick films of 3D
hierarchical CeO2architectures. Sensor Actuat B-Chem 197:177–184
31. Ferreira NS, Angélica RS, Marques VB, de Lima CCO, Silva MS (2016) Cassava-starch-assisted sol–gel synthesis of CeO2nanoparticles. Matter
Lett 165:139–142
32. Truffault L, Andrezza C, Santilli CV, Pulcinelli SH (2013) Synthesis of PTSH-modified CeO2nanoparticles: effect of the modifier on structure, optical
properties, and dispersibility. Colloid Surface A 426:63–69 33. Sing KSW, Everett DH, Haul RAW, Moscou L, Pierotti RA, Rouquerol J,
Siemieniewska T (1985) Reporting physisorption data for gas/solid system with special reference to the determination of surface area and porosity. Pure Appl Chem 57:603–619
34. Xiong G, Luo L, Li C, Yang X (2009) Synthesis of mesoporous ZnO (m-Zno) and catalytic performance of the Pd/m-ZnO catalyst for methanol steam reforming. Energy Fuels 23:1342–1346
35. Hung IM, Wang HP, Lai WH, Fung KZ, Hon MH (2004) Preparation of mesoporous cerium oxide templated by tri-block copolymer for solid oxide fuel cell. Electrom Acta 50:745–748
36. Clifford PK, Tuma DT. Characteristics of semiconductor gas sensors, I. Steady state gas response. Sensor Actuat. 1982/83;3:233-254.
37. Brailsford AD, Yussouff M, Logothetis EM (1993) Theory of gas sensors. Sensor Actuat B-Chem 13:135–138
38. Gong H, Hu JQ, Wang JH, Ong CH, Zhu FR (2006) Nano-crystalline Cu-doped ZnO thin film gas sensor for CO. Sensor Actuat B-Chem 115:247–251 39. Chang JF, Ku HH, Leu IC, Hon MH (2002) The effects of thickness and
40. Izu N, Matsubara I, Itoh T, Akamatsu T, Shin W (2013) CO response of sensor based on cerium oxide thick films prepared from clustered spherical nanoparticles. Sensors 13:3235–3261
41. Durrani SMA, Al-Kuhaili MF, Bakhtiari IA, Haider MB (2012) Investigation of the carbon monoxide gas sensing characteristics of tin oxide mixed cerium oxide thin films. Sensors 12:2598–2609
42. Gardner JW (1990) A non-linear diffusion-reaction model of electrical conduction in semiconductor gas sensors. Sensor Actuat B-Chem 1:166–170 43. Sakai G, Matsunaga N, Shimanoe K, Yamazoe N (2001) Theory of
gas-diffusion controlled sensitivity for thin film semiconductor gas sensor. Sensor Actuat B-Chem 80:125–131
44. Liu Y, Huang P, Song H, Zhang G. Modeling of hydrogen atom diffusion and response behavior of hydrogen sensors in Pd-Y alloy nanofilm. Scientific Report 6:37043. http://www.nature.com/articles/srep37043 45. Wolkenstein T. Electronic process on semiconductor surfaces during
chemisorption. Consultants Bureau; 1991.
46. Brophy JJ (1985) Basic electronics for scientists. McGraw-Hill, Singapore 47. Helwig A, Müller G, Sberveglieri G, Faglia G (2007) Gas response time of
nano-scale SnO2gas sensors as determined by the moving gas outlet
technique. Sensor Actuat B-Chem 126:174–180
Submit your manuscript to a
journal and benefi t from:
7 Convenient online submission 7 Rigorous peer review
7 Immediate publication on acceptance 7 Open access: articles freely available online 7 High visibility within the fi eld
7 Retaining the copyright to your article
![Figure 3 shows adsorption–type IV, which means that is associated to capillarycondensations according to IUPAC classification withtype H3 hysteresis which is characteristic of themesoporous material with slit-shaped pores [33]](https://thumb-us.123doks.com/thumbv2/123dok_us/8849861.934465/4.595.57.291.85.465/adsorption-associated-capillarycondensations-according-classification-hysteresis-characteristic-themesoporous.webp)