© 2015, IRJET ISO 9001:2008 Certified Journal Page 1056
Comparative study of medical datasets IETD and UCITD using statistical
methods
V Prasad1, T Srinivasa Rao2, Ch NarayanaRao3, G Anuradha3
1, ,3 Dept of Computer Science & Engg., Raghu Institute of Technology, INDIA 2 Dept of Computer Science & Engg., GITAM Instt. of Technology,INDIA
---***---ABSTRACT:
Recent studies indicated difference in classification
accuracy of various classifiers. Proposed a
comparative study by considering Indian e-Thyroid
Dataset (IETD) from Indian e-TDML Repository
and carried out univariate analysis of variance
(ANOVA) on these data sets to observe any
significant difference among them. It has observed
that datasets are having significant difference which
is the reason for difference in classifiers
performance. Results of this study are very
important for the development of diagnosis system
and the need for its localization settings.
1.INTRODUCTION:
In this statistical method ANOVA is applied to
evaluate the significance between two significant
thyroid datasets UCI and IETD for better
classification. ANOVA is used to test the
significant difference in a single dependent variable
among two or more groups formed by a single
independent or classification variable.
The attributes of IETD are age, gender, lithium,
goiter, tumor, TSH, T3, TT4, T4U and FTI. The
attributes of UCI are age ,sex, on thyroxine , query
on thyroxine , antithyroid medication ,sick ,
pregnant ,thyroid surgery, I131 statement , query
hyperthyroid, query hypothyroid , lithium, goiter,
tumor, hypopituitary , psych TSH, T3, TT4, T4U
and FTI. The common thyroid functional tests from
both the data sets were TSH, T3, TT4, T4U and FTI
, where T3 is dependent on TSH and T4U is
dependent on TT4.
1.1. ANALYSIS OF VARIANCE:
Analysis of variance is a statistical technique
used for comparisons. Uni variate analysis is one of
the popular analysis of variance techniques.
1.1.1. ANALYSIS OF VARIANCE (ANOVA):
The functional statistics obtained from ANOVA tell
us whether there is any significant difference in the
© 2015, IRJET ISO 9001:2008 Certified Journal Page 1057
In this TSH, TT4, and FTI were considered as
dependent variables and group was considered as
factoring variable.
The results of ANOVA were represented in three
rows.
1. Between Groups:- Between groups
indicates the variability due to the place of
data.
2. Within Groups:-With in groups indicates
variability due to random error
3. Total:- Indicates total variability
The ANOVA functional statistics are ratio of the
Between Group Variation divided by the Within
Group Variation
1.1.2. ALGORITHM OF ANALYSIS OF
VARIANCE (ANOVA)
BEGIN
Identify the dataset with observation(TD)
and the measurements(symptoms) in a form
of matrix.
The total number of measurements is
represented as N.
The Mean is calculated as the average of all
the measurements in the tuple.
Identify Overall mean as the average of all the measurements in the observations
related.
Standard deviation is calculated of
Std. Deviation = for all Measures of
the tuple
(Original Value - Overall Mean)^2
Standard error is calculated as
Std.Err = Stnd.Deviation / Sqrt(N)
Estimated Effects (A) =
Mean –Overall mean
Lower Bound Mean – Std.Err & Upper
Bound Mean + Std.Err
For each and every observation in the group
REPEAT
DO
Calculate Between Groups (BG) as
Sum of Squares =
+( Tuples Mean – degree of
freedom) + Unique measures
Degree of freedom =1 for each row.
Degree of freedom = Total Elements -1 for each
column
Mean Square = Sum of Squares / Degree of
freedom of tuple.
Interpretation value (F) is Mean Square / Mean of
Column values
Calculate Within Groups (WG) as
Sum of Squares =
+ ( Tuples Mean – degree of
freedom) + Unique measures
2x
x
i
2i ij
x
© 2015, IRJET ISO 9001:2008 Certified Journal Page 1058
Mean Square = Sum of Squares / Degree
of freedom of tuple.
Interpretation value (F) is Mean Square /
Mean of Column values
DONE
Interpretation value (F) is should be < 0.95
for BG and <0.05 for WG.
END
2. EXPERIMENTATION
Our analysis includes datasets comparisons based
on the common attributes TSH, TT4 and FTI. Total
we will have nCr combinations totaling 7 for
experimentation and tables shows available and
type of attributes of UCI and IETD respectively.
Table 2(a): IETD and attributes available
Attribute Type
age Integer
Gender Categorical
lithium Integer
goiter Integer
tumor Integer
TSH Real number
T3 Real number
TT4 Real number
T4U Real number
FTI Real number
Table 2(b).: UCITD and attributes available
Attribute Type
Age Integer
sex Categorical
on thyroxine Integer
query on thyroxine
Integer
antithyroid medication
Integer
sick Integer
pregnant Integer
thyroid surgery
Integer
I131 statement
Integer
query
hyperthyroid
Integer
query hypothyroid
Integer
lithium Integer
goiter Integer
tumor Integer
hypopituitary Integer
psych Integer
TSH Real number
T3 Real number
TT4 Real number
T4U Real number
FTI Real number
2.1 CASE STUDY:
Experiment includes the analysis of TD on UCI and
IETD. UCI data set contains 200 records and IETD
© 2015, IRJET ISO 9001:2008 Certified Journal Page 1059
Table 2.1.1 (a) Table 2.1.1 (c) & Table 2.1.1 (e)
shows descriptive statistics that are no of records,
mean standard deviation, standard error etc. for the
individual attributes TSH, TT4 and FTI
respectively.
Table 2.1.1 (b), Table 2.1.1 (d) & Table 2.1.1
(f) shows analysis of variance for the attributes
TSH, TT4 and FTI respectively. The results
reported in 2.1.1 (g), Table 2.1.1 (h), Table 2.1.1 (i)
& Table 2.1.1 (j) indicates the significant difference
between groups of data sets.
Table 2.1.1(a) : Descriptive Statistics of TSH
TSH
Datas
et N Mean
Std. Deviatio n Std. Error 95% Confidence Interval for Mean Lowe r Boun d Uppe r Boun d UCIT D 20
0 68.34 18.062 1.277
67.03 3
69.61 7
IETD 16
7
219.7
5 140.986
10.91 0 208.8 4 230.6 6
Total 36
7
144.0
5 122.039 6.370
130.8 7
[image:4.612.312.586.119.319.2] [image:4.612.41.579.367.732.2]143.6 1
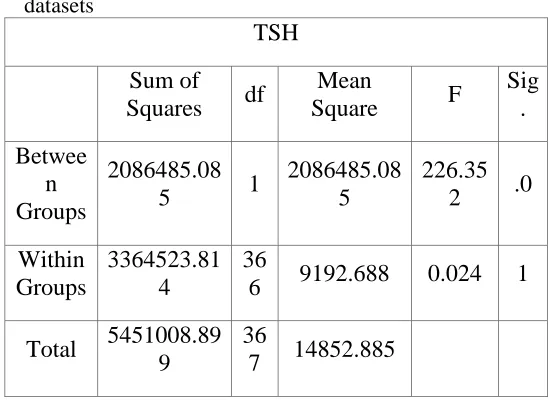
Table 2.1.1 (b): ANOVA on TSH between UCI & IETD datasets
TSH
Sum of
Squares df
Mean
Square F
Sig . Betwee n Groups 2086485.08
5 1
2086485.08 5
226.35
2 .0
Within Groups
3364523.81 4
36
6 9192.688 0.024 1
Total 5451008.89
9
36
7 14852.885
P-value is 0.000 which is less than 0.05 (p < 0.05)
can safely reject the null hypothesis that indicates
there is more significant difference between groups.
Then we can say that TD differs a lot on TSH.
Table 2.1.1 (c): Descriptive Statistics of TT4
TT4
Datase
t N
Mea n Std. Deviatio n Std. Erro r 95% Confidence Interval for Mean Lowe r Boun d Upper Boun d UCIT D 20 0 29.8
3 21.845
1.54 5 28.28 5 31.37 5
IETD 16
7 33.6
5 25.060
1.93 9 31.71 1 35.58 9
Total 36
7 31.7
4 23.408
© 2015, IRJET ISO 9001:2008 Certified Journal Page 1060
Table 2.1.1 (d): ANOVA on TT4 between UCI & IETD datasets
SGPT
Sum of
Squares df
Mean
Square F Sig.
Between
Groups 1333.383 1 1333.383 2.443 0
Within
Groups 199214.731 366 544.302 0.004 1
Total 200548.114 367
P-value is 0.000 which is greater than 0.119 (p >
0.05) can accept the null hypothesis that indicates
there is no significant difference between groups.
Then we can say that there is no TD differs on TT4
Table 2.1.1 (e): Descriptive Statistics of FTI
FTI
Datase
t N
Mea n
Std. Deviatio
n
Std. Erro
r
95% Confidence Interval for
Mean
Lowe r Boun
d
Upper Boun
d
UCIT D
20 0
25.9
9 11.289 .798
25.19 2
26.78 8
IETD 16
7 40.6
9 36.412
2.81 8
37.87 2
43.50 8
Total 36
7 33.3
4 26.913
1.40 5
31.27 5
34.08 5
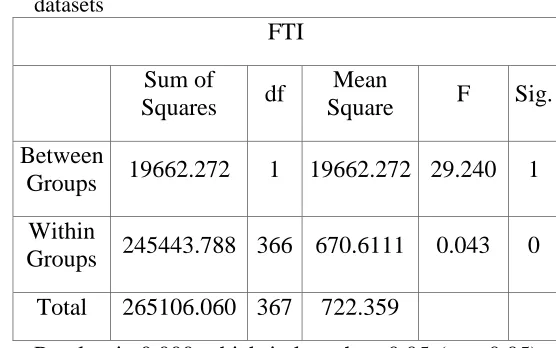
Table 2.1.1 (f): ANOVA on FTI between UCI & IETD datasets
FTI
Sum of
Squares df
Mean
Square F Sig.
Between
Groups 19662.272 1 19662.272 29.240 1
Within
Groups 245443.788 366 670.6111 0.043 0
Total 265106.060 367 722.359
P-value is 0.000 which is less than 0.05 (p < 0.05)
can safely reject the null hypothesis that indicates
there is more significant difference between groups.
Then we can say that TD differ a lot on SGOT.
2.1.1 (g), Table 2.1.1 (h), Table 2.1.1 (i) &
Table 2.1.1 (j) shows the descriptive statistics for
the combination of attributes TSH, TT4 , TSH, FTI
, TT4, FTI and TSH, TT4 ,FTI respectively.
The results reported in Table 2.1.1 (g), Table
2.1.1 (h), Table 2.1.1 (i) & Table 2.1.1 (j) are the
four different tests and their significant values (p)
for the combination of attributes TSH, TT4, TSH,
FTI, TT4, FTI and TSH, TT4, FTI respectively.
Table 2.1.1 (g): Descriptive Statistics of TSH & TT4
Dataset Mean Std.
Deviation N
TSH
UCITD 68.34 18.062 200
© 2015, IRJET ISO 9001:2008 Certified Journal Page 1061
Total 144.05 122.039 367
TT4
UCITD 29.83 21.845 200
IETD 33.65 25.060 167
Total 31.74 23.408 367
P-value in multivariate analysis on TSH and TT4 is
0.000 which is less than 0.05 (p < 0.05) can safely
reject the null hypothesis that indicates there is
more significant difference between groups. Then
[image:6.612.321.549.343.520.2]we can say that TD differs a lot on TSH and TT4.
Table 2.1.1 (h): Descriptive Statistics of TSH & TT4
Datasets Mean Std.
Deviation N
TSH
UCITD 68.34 18.062 200
IETD 219.75 140.986 167
Total 144.05 122.039 367
TT4
UCITD 29.83 11.289 200
IETD 33.65 36.412 167
Total 31.74 26.913 367
Table 2.1.1 (i): Descriptive Statistics of TT4 & FTI
Datasets Mean Std.
Deviation N
TT4
UCITD 29.83 11.289 200
IETD 33.65 36.412 167
Total 31.74 26.913 367
FTI
UCITD 25.99 21.845 200
IETD 40.69 25.060 167
Total 33.34 11.289 200
P-value in multivariate analysis on TT4 and FTI is
0.000 which is less than 0.05 (p < 0.05) can safely
reject the null hypothesis that indicates there is
more significant difference between groups. Then
we can say that TD differ a lot on TT4 and FTI.
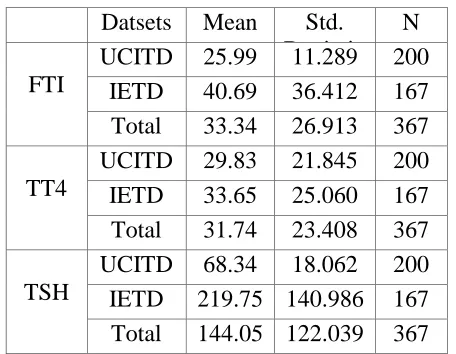
Table 2.1.1 (j): Descriptive Statistics of TSH, TT4 & FTI
Datsets Mean Std.
Deviatio n
N
FTI
UCITD 25.99 11.289 200
IETD 40.69 36.412 167
Total 33.34 26.913 367
TT4
UCITD 29.83 21.845 200
IETD 33.65 25.060 167
Total 31.74 23.408 367
TSH
UCITD 68.34 18.062 200
IETD 219.75 140.986 167
Total 144.05 122.039 367
P-value in analysis on TSH, TT4 and FTI is 0.000
which is less than 0.05 (p < 0.05) can safely reject
the null hypothesis that indicates there is more
significant difference between groups. Then we can
say that TD differs a lot on TSH, TT4 and FTU.
All of our tables are related to 95 %
© 2015, IRJET ISO 9001:2008 Certified Journal Page 1062
90 % significant levels also. They also supports the
groups are different in the experimentation.
This study confirms the difference in TD of
UCI and IETD. Results of this study are very
important while developing diagnosis systems as it
corroborates the necessity of localization of the
software. Also, thyroid specialists to be aware about
these differences among TDD and prescribe any
drugs accordingly.
3.
CONCLUSION:
In this study, the common attributes of the two data
sets TSH, TT4 and FTI are taken for ANOVA.
The analysis on data sets shows that there exists
more significant difference within the groups with
the possible attribute combinations.
More significant difference existed in the TD with
all the possible attribute combinations of UCI and
IETD data sets. This indicates that there exist
differential effects on thyroid patients within their
respective groups. There is a need of localized
software for diagnosis of thyroid diseases. This
inspired me to develop a thyroid disease diagnosis
expert system for decision making and parallel to
identify the thyroid disease in an early stage based
on symptoms before the appearance of thyroid
disease sign.
4. REFERENCES:
[1] TDD via Hybrid Architecture Composing
Rough Data Sets & ML Algorithms., Second
International Conference on Emerging Research in
Computing , Information , Communication and
Applications (ERCICA-2014) ., Preceding
Published in ELSEVIER , Volume 1 , Issue 1 ,
Pages: 307-316 .
[2] V Prasad, T. SrinivasaRao. "Health Diagnosis
Expert Advisory System on Trained Data Sets for
Hyperthyroid." International Journal of Computer
Applications (IJCA) 102.3 (2014): 40-48.
[3] Prasad, V., Dr T. SrinivasaRao, and B. Sai Ram.
"Information Clustering Based Upon Rough Sets."
International Journal of Scientific Engineering and
Technology Research (IJSETR) 3.41 (2014):
8330-8333.
[4] V Prasad,T Srinivasa Rao,M S P Babu," Thyroid
Disease Diagnose Via Hybrid Architecture
Composing Rough Data Sets Theory & Machine
Learning Algorithms", International Journal Soft
Computing, Springer, DOI:
10.1007/s00500-014-1581-5(2015).
[5] Prasad, Vadamodula, and TamadaSrinivasaRao.
"Implementation of Regularization Method Ridge
Regression on Specific Medical Datasets."
International Journal of Research in Computer
Applications & Information Technology 3.2 (2015):
© 2015, IRJET ISO 9001:2008 Certified Journal Page 1063
[6] Prasad, V., Dr T. SrinivasaRao, and M.
PurnachandraRao. "Proportional analysis of non
linear trained datasets on identified test datasets."
International Conference on recent trends and
research issues in computer science & engineering..
Vol. 1. No. 1. ICRTRICSE-2k15, Dept of CSSE,
Andhra University , Visakhapatnam, 2015.
[7] V Prasad, T. SrinivasaRao. "Standard cog
exploaration on medicinal data." International
Journal of Computer Applications (IJCA) 119.10
(2014): 34-38.
[8] V Prasad,T Srinivasa Rao,P V G D Prasad
Reddy," Improvised prophecy using regularization
method of machine learning algorithms on medical
data", PMU, ELSEVIER , DOI:
10.1016/j.pmu.2015.09.001(2015)
[9] Junning Li, Z. Jane Wang and Martin J.
McKeown: “A MANOVA of Major Factors of
RIU-LBP Feature for Face Recognition”. In
Proceedings of the 29th IEEE International Conference on EMBS pages 5991-5994, August
2007.
[10] D. Moitre and F. Magnago: “Using MANOVA
Methodology in a Competitive Electric Market
under Uncertainties ”. In Proceedings of the IEEE
International Conference on Transmission &
Distribution, pages 1-6, 2006.
[11] Mauro D’Arco, Annalisa Liccardo, and Nicola Pasquino: “ANOVA-Based Approach for DAC
Diagnostics ”. In Proceedings of the IEEE
Transactions on Instrumentation and Measurement,
pages 1-9, 2012.
[12] B.Surendiran, Y.Sundaraiah, A.Vadivel:
“Classifying Digital Mammogram Masses using
Univariate ANOVA Discriminant Analysis ”. In
Proceedings of the IEEE International Conference
on Advances in Recent Technologies in
Communication and Computing, pages 175-177,
2009..
5. AUTHORS:
1. V Prasad , is an Associate Professor &
Head of the Dept , Computer Science & Engineering in Raghu Institute of Technology. He had around 10 Years of teaching experience and 3 Years of Research Experience in Machine Learning Algorithms . He completed his B.Tech in 2006 , JNTU Hyderabad & M.Tech , 2009, Andhra University, Currently pursuing Ph.D in GITAM University under the esteemed guidance of Dr. T Srinivasa Rao . He had handful publications in SPRINGER & ELSEVIER journals . He had attended National & International Conferences also.
2. Dr T Srinivas Rao, working as
Associate Professor, Department of CSE, GITAM Institute of Technology ,Gitam University, Visakhapatnam He had around 15 Years of teaching experience and 7 Years of Research Experience He completed his B.Tech in GITAM, M.Tech in AU and Ph.D in Andhra University. He had handful publications in SPRINGER & ELSEVIER journals. He had attended National & International Conferences also.
3.Chokkapu Narayanarao, is an
© 2015, IRJET ISO 9001:2008 Certified Journal Page 1064
3. G Anuradha, is an Assistant Professor,