© 2016, IRJET | Impact Factor value: 4.45 | ISO 9001:2008 Certified Journal | Page 75
Simulation of SOx Concentration of Dhaka City by Air Model
Syeda Zehan Farzana
1, Dr. Md. Jahir Bin Alam
2, Md. Gulam Kabir
31
Senior Lecturer, Civil Engineering Department, Leading University, Sylhet, Bangladesh
2
Professor, Civil and Environmental Engineering Department, Shahjalal University of Science & Technology, Sylhet,
Bangladesh
3
MIT Student, Information & Communication Engineering Department, Islamic University, Kushtia, Bangladesh
---***---Abstract -
The integrated model based on C++ was applied for six locations of Dhaka city (non industrial points) - Farmgate, Mirpur, Mohakhali, Malibag, Dhanmodi-2 and Gulshan-1 and the average concentration of SOx for these six locations were simulated as 106.593, 84.898; 96.481; 80.548; 124.503; and 68.975 μg/m3respectively. The average deviation between software analyzed results and DOE measured results was 3-7%.Key Words:
Point source, line source, SOx, ATDL
Model.
1. INTRODUCTION
Air pollution has emerged as a serious problem in Dhaka city. Blackening of the city air and reduced visibility can be observed in some areas at times even with unaided eyes. Episodes of choking smells and irritating eyes are common, which can never ignore during the setting up and developing a city. The major objective of the study are (i) to develop a software to predict the existing air pollution concentration in a region; (ii) to validate the software compared with manual calculation for the data collected from DOE (Department of Environment) and DOE measured results and (iii) to implement the software with available data for the central portion of Dhaka city to predict the ambient air quality.
1.1 The Environment
Dhaka, the capital city of Bangladesh has a population of about 9 million that is predictable to grow to about 16 million by the year 2015, making the seventh largest mega city in the world. That unparalleled growth has far outstripped the capacity of its urban transport system. Traffic congestion is a part of daily life in Dhaka, vehicle-related air pollution is growing at an alarming rate, and traffic delays have tripled in the last three years in the mega city. Uninhibited emission from motor vehicles constitutes the dominant source of air pollution in Dhaka. Two categories of vehicles making significant
contributions to overall fine particulate emissions are- two-stroke engine three-wheelers and heavy-duty diesel vehicles. A large number of pedestrians, drivers, passengers, traffic policemen, street vendors and other groups undoubtedly suffer from significant health damage. As a result of exposure to emissions from a large variety of motorized vehicles including two-stroke auto rickshaws or "baby taxis", trucks, buses, cars and two-wheelers. They are responsible for 25% of the particulate matter and 60% of the toxic and smog-forming hydrocarbons contributed by all motor vehicles. Available air quality monitoring data suggests that the ambient concentration of some pollutants especially suspended particulate matter (SPM), and SOx in air of Dhaka. Thus the increasing contribution of atmospheric loads of SO2 and SOx to global climate change is anticipated and it is really necessary to quantify these emissions in a hurried manner. A national course-plotting committee should establish with local and expatriate Bangladeshi experts to deal with the problem of emission. Government has taken a number of initiatives including banning of polythene which had been blamed for a number of environmental hazards included water contamination, closing of drains and sewerage lines and disposal of polythene everywhere was choking the sewage, creating air pollution as leaded fuel and banning of two-stroke three-wheeler from Dhaka. Pollution control board requires performing environmental impact assessment before certifying a new industry.
1.2 Formulation of Model
The concentration of a pollutant plume at any x, y and z location can be computed from the diffusion equation below.
2 2
2 1 exp 2
1 exp 2
, ,
z y
z y
z y
U Q z
y x C
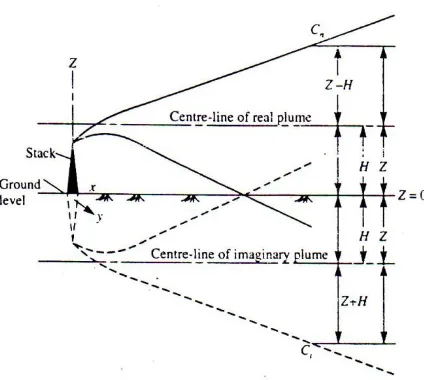
For the coordinate system: x = 0 at stack, y = 0 at plume center-line z = 0 at ground level.
© 2016, IRJET | Impact Factor value: 4.45 | ISO 9001:2008 Certified Journal | Page 76 2 2 2 2 1 exp 2 1 exp 2 1 exp 2 , , z z y z y H z H z y U Q z y x C ….(a)
The appropriate units are:
Q = any property per unit time, e.g. kg/s, m3 /s
C = that property per unit volume, e.g. kg/m3, m 3/m3 or ppb
= diffusion coefficients, in m, as functions of downwind distance x
Fig -1: Coordinate system and ground reflection of plume development.
1.3 Ground Level Emission
Equation (b) for ground level emissions, such as fires or explosions or fugitive gases or smoldering landfill sites, becomes
2 2 2 1 exp 2 1 exp , , z y z y z y U Q z y x C
For ground level concentrations, z=0:
22
1
exp
0
,
,
y z yy
U
Q
y
x
C
The maximum ground level concentrations are along the plume center-line where y = 0:
U
Q
x
C
z y
0
,
0
,
To formulate the program three suitable formulas for point, line and area source were used. These formulas
were modified according to necessity considering the factors and parameters.
Point Source
General form of the Gaussian plume model for point source is given as
2 2 2 2 1 exp 2 1 exp 2 1 exp 2 , , z z y z y H z H z y U Q z y x C
Where, C(x, y, z) is the concentration of the pollutant at a point x, y, z; U is wind velocity; Q is emission rate of species; H is Effective height of the stack; Y is horizontal dispersion coefficient; Z is vertical dispersion coefficient; and Z is vertical distance. The above formula was taken as basic concept for point source in developing the software. The dispersion coefficients were calculated using mono-graphs. Line Source 2 2 2 1 exp 2 1 exp 2 ) , ( z z z h z h z U Q z x C
where, C(x, z) is the concentration at point (x, z) relative to the line source at x=0; Q is the emission rate per unit length; U is the effective cross road wind speed; h is average height of the emission of auto exhaust; and z is the vertical dispersion coefficient. This formula was taken for line source model in developing the software. The vertical dispersion coefficient z was measured by the following equation
Z = (a + bx)c
Where, a, b, c are parameters determined from various experiments.
Area Source
ATDL Model for ground level area source
4 0 4 , 3 , 2 , 1 , 1 089 . 0 131 . 0 179 . 0 316 . 0 2 1 1 1 2 i k k k k k b Q Q Q Q Q U b a C Where, C is the concentration of pollutant; Qk is the emission rate in grid k; Qk, I (i=1,2,3,4)= emission rate in ith grid;
is grid size. This formula was taken as basic concept for area source in developing the software neglecting the impact of fraction in the formula. Unlike most of the existing area source models, this modelz y
[image:2.595.50.262.238.428.2]© 2016, IRJET | Impact Factor value: 4.45 | ISO 9001:2008 Certified Journal | Page 77 explicitly takes in to account the surface roughness of the
ground area over which the diffusion and transport process is occurring. Surface roughness is an important parameter for concentration calculations in the diffusion process. A and B are constants dependent on the meteorological conditions and also on the average surface roughness of the ground area over which the diffusion is taking place.
2. METHODOLOGY
Upon discharge to atmosphere, the emission from stationary sources is subjected to the following physical and chemical fate processes (i) an initial vertical rise, called plume rise, due to initial buoyancy and momentum of discharge; (ii) transport by wind in its direction; (iii) diffusion by turbulence; (iv) gravitational settling of particles of size greater than 10m; (v) chemical reactions and decomposition; (vi) deposition on vegetation and other surfaces; Atmospheric dispersion models are mathematical expressions, which attempt to describe the above processes in order to relate emission rate to atmospheric concentration.
This integrated model has been implemented using object oriented C++ and computer graphics in Windows environment on a microcomputer. The software that is developed is just like a small package, with all user-friendly features. This software is general purpose and hence can be applied to any region of the world. However as a case study, it provides the simulation of air quality in the central part of Dhaka city and a general case. In general case a grid has been formed. This grid consists of 3600 sub grids each representing a part of the region to be considered. This general grid can be applied to any area by scanning and super imposing upon the general grid. Depending upon the user's interest and purpose main grid can be divided in to any number of sub-grids, only thing is that user has to supply a scale factor so that model can understand the number sub-grids to be formed. In case study, using computer graphics has drawn the map of the central part of Dhaka city. This software basically consists of a menu with the following items (i) Point Source (ii) Line Source (iii) Area source (iv) Optimize the Model
3. RESULT
For implementation of the developed software, six locations in the central portion of Dhaka city were chosen. Data for SOx from DOE for these locations at six receptors site were collected for validity of program. As site is only
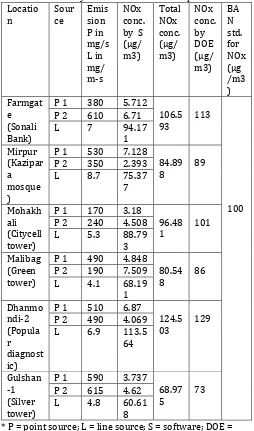
[image:3.595.307.561.294.725.2]residential area and no major industry is allowed in residential area, data for area sources was not considered. From a large number of data only two major point sources and one line source were taken. At Farmgate, considering atmospheric condition A, position of location according to digitization map of Dhaka (distance from receptor, X = 500 m; Y = 12 m), emission rate from source, q = 380 mg/s, wind velocity, u = 1.5 m/s, concentration of SOx to the receptor from first point source using software was found 5.712 μg/m3. In the similar way, the concentrations of different points were simulated using formulated model based on local characteristics. The predicted concentrations were shown in table 1.
Table -1: Summary of Six Locations at Receptor Site Locatio
n Source Emission P in mg/s L in mg/ m-s
NOx conc. by S (μg/ m3)
Total NOx conc. (μg/ m3)
NOx conc. by DOE (μg/ m3)
BA N std. for NOx (μg /m3 ) Farmgat
e (Sonali Bank)
P 1 380 5.712 106.5 93 113
100 P 2 610 6.71
L 7 94.17 1 Mirpur
(Kazipar a mosque )
P 1 530 7.128 84.89 8 89 P 2 350 2.393
L 8.7 75.37 7
Mohakh ali (Citycell tower)
P 1 170 3.18
96.48 1 101 P 2 240 4.508
L 5.3 88.79 3 Malibag
(Green tower)
P 1 490 4.848 80.54 8 86 P 2 190 7.509
L 4.1 68.19 1 Dhanmo
ndi-2 (Popula r diagnost ic)
P 1 510 6.87
124.5 03 129 P 2 490 4.069
L 6.9 113.5 64
Gulshan -1 (Silver tower)
P 1 590 3.737 68.97 5 73 P 2 615 4.62
L 4.8 60.61 8
© 2016, IRJET | Impact Factor value: 4.45 | ISO 9001:2008 Certified Journal | Page 78 Calculation of Air Pollutants and Validation of Sub Model –
Case Study
Pollution from Point Source 1
Atmospheric condition = A; Distance from receptor, X = 500 m; Y = 12 m; Emission rate from source, q = 380 mg/s; Height of the stack, H = 10 m; Wind velocity, u = 1.5 m/s
Wind angle with north = 780
Concentration of SOx to the receptor from first point source using software =5.712 μg/m3
Pollution from Point Source 2
Atmospheric condition = A; Distance from receptor, X = 600 m; Y = 10 m; Emission rate from source, q = 610 mg/s; Height of the stack, H = 9 m; Wind velocity, u = 1.5 m/s; Wind angle with north = 780
Concentration of SOx to the receptor from first point source using software = 6.71 μg/m3
So, total concentration of SOx to the receptor from two point sources = 12.422 μg/m3
Pollution from Line Source
Distance from receptor, X = 300 m; Emission rate from source, q = 7 mg/m-s; Average height of emission, z = 1 m; Wind velocity, u = 1.5 m/s; Wind angle with north = 780
Value of parameter for unstable condition, a = 1.14; b = 0.05; c = 1.33; Concentration of SOx to the receptor from line source using software = 94.171 μg/m3
So, total concentration of SOx at receptor position for point and line sources = 106.593 μg/m3
Concentration of SOx at that position from DOE = 113 μg/m3
Variation between observed and measured concentration = 5.67 %
The standard ambient concentration of SOx for commercial and residential areas, for Bangladesh = 100 μg/m3; according to WHO = 80 μg/m3
Both of these two values of SOx concentration are lower than our measured result. So based on SOx pollution the area can be identified as exist in environmentally critical position.
Table-2: Comparison among Manual Calculation, Software Result and DOE Result
It can be concluded that the sub models are predicting values with reasonable accuracy; hence the software may be used for any specific area.
4. DISCUSSION
Using the software the SOx concentration for six different locations at six receptor position were found as, Farmgate (Sonali Bank) 106.593; Mirpur (Kazipara mosque) 84.898; Mohakhali (Citycell tower) 96.481; Malibag (Green tower) 80.548; Dhanmondi-2 (Popular diagnostic) 124.503 and Gulshan-1 (Silver tower) 68.975 μg/m3 respectively. These measured results differ from the DOE results by 5.67, 4.6, 4.47, 6.34, 3.49 and 5.51 % respectively. These differences occur because all the data of point sources including small emission sources taken by DOE was not considered in the program, only the major pollution sources were considered. The software was validated comparing among manual calculation, software result and DOE result taking data for one point and one line source. Another comparison between manual calculation and software result was also done taking an example of area source. It can be concluded that the sub models are predicting values with reasonable accuracy; hence the software may be used for any specific area. However from the analysis, it is clear, the air in Dhaka city is extremely got polluted. The situation was anxious as the analysis data were especially taken from residential area. SOx concentration for almost every area except Gulshan-1 is above either or both WHO and Bangladesh standard. It is Source
NO2 conc. from
manual calculation
(µg/m3)
NO2 conc. from
software
(µg/m3)
NO2 conc. measured
by DOE
(µg/m3)
Point source
Line source
Area source
5.61
92
307.23
5.712
94.171
315.47
5.67
92.5
© 2016, IRJET | Impact Factor value: 4.45 | ISO 9001:2008 Certified Journal | Page 79 also clear that the main sources of causing this SOx
pollution in commercial and residential area are diesel and petrol driven motorized vehicle. This scenery do not bring good news as SOx pollution can create a lot of problem in environment and cause deterioration in artificial matter and the main things that it can cause a severe damage to our health. SOx react with ammonia, moisture and other compounds to form nitric acid and related particles. Human health concerns include effects on breathing and the respiratory system, damage to lunge tissue, and premature death. Small particles penetrate deeply into sensitive parts of the lungs and can cause or worsen respiratory disease such as emphysema, asthma and bronchitis and aggravate existing heart disease ( Mamun, 2005). Ground-level ozone (smog), acid rain, water quality deterioration, toxic chemicals, visibility impairment, etc. various environmental and health damaging reasons produced by SOx pollution will endanger future generation unless any protective steps are taken.
5. CONCLUSION & RECOMMENDATION
Air pollution has become one of the worst environmental problems affecting the thirteen million inhabitants of metropolitan Dhaka. The economic cost of the sickness and premature death associated with air pollution has been estimated to the several hundred millions of dollars per year according to a World Bank study. A software has been developed, which can be utilized as a tool to predict the impact of any type of air pollution source on the environment of a particular area. This software is just like a small package with all user interface features. The software is implemented by collecting data from DOE for six location especially residential area of the central portion of Dhaka city. From the obtained results, it is confirmed that the city is in danger by continuously pollution of SOx at a high rate. It can also be predicted that other pollutant matter such as CO, SPM make this condition most critical ultimately. However it can be said that air pollution is threatening the environment of Dhaka and some other rapidly growing big cities not the whole country. So Government should come forward and handle this matter with care from right now.
The main objective of the thesis is to develop and implement software, which will serve as a tool that can predict ambient air quality of a region. However the major findings of the study are -the computer program in C++ in Windows environment was applied for six points of Dhaka city- Farmgate, Mirpur, Mohakhali, Malibag, Dhanmodi-2
and Gulshan-1 and the average concentration of SOx for these six locations were simulated as 106.593, 84.898; 96.481; 80.548; 124.503; and 68.975 μg/m3 respectively.
The average deviation between software analyzed results and DOE measured results was 3-7%.
The SOx concentration is above WHO (80μg/m3) in Farmgate, Mirpur, Mohakhali, Malibag, Dhanmodi-2 and above Bangladesh standard in Farmgate, Dhanmodi-2.
REFERENCES
[1] Davis L. Mackenzie (1991), Introduction to Environmental engineering Mc-Grow-Hill Inc., Second Edition.
[2] Department of Environment (DOE), Bangladesh (www.cleanairnet.org)
[3] Dhaka Air Pollution (www.angelfire.com) Evaluation of The Air Pollution Model TAPM (Version 2) for Adelaide: Case Study (17-31 December 2002), environment Protection Authority, South Australia.
[4] EIA-Country Information of Bangladesh (www.eia.doe.gov)
[5] Henry, C.P. "Air pollution", McGraw-Hill book Company, New York, 1974.
[6] Howard S. Peavy (1985), Environmental
Engineering, McGraw-Hill International (U.K.)Limited International Edition
[7] KielyG, (1998)Environmental Engineering, McGraw-Hill International (U.K.)
Limited, International Edition.
[8] Ferdous M. R. & Ali M. A., UAP Journal of civil & Environmental Engineering, Vol-1, No. 1, 2005 [9] Rashid M. M.(2005), A Study on Air
pollution of Sylhet City,Undergraduate Thesis,Department of Civil and
Environmental Engineering (CEE),SUST.
[10] TAN M. G.(2006), Development and Calibration of Pollutant Dispersion models for Roadside Air Quality Modeling, Undergraduate Student, B.S. Civil Engineering Program, Department of Civil Engineering, University of the Philippines ,Diliman. [11] Paul K. M. (2002), A Study of Continuous profile of
Specific Urban Pollution, M.Sc. Thesis, Department of Chemical Engineering, Bangladesh University of Engineering and Technology(BUET ) Dhaka.
[12] Rao, C. S. and Rao, P. C (2001), Air pollution, Tata McGraw-Hill Publishing Company Limited, New Delhi, Seventeenth Reprint.
© 2016, IRJET | Impact Factor value: 4.45 | ISO 9001:2008 Certified Journal | Page 80 [14] Turner,B.D. Atmospheric dispersion modeling A
critical review, Jr. of Air pollution Control Association, Vol. 29, 1975.