© 2015, IRJET ISO 9001:2008 Certified Journal
Page 918
IMPROVED ELECTRICAL OUTPUT OF DYE-SENSITIZED SOLAR CELLS
BASED ON Cu‒N CO-DOPED SEMICONDUCTOR
Purnima Dashora
1, Monika Trivedi
1, Rakshit Ameta
1and Suresh C. Ameta
1*1
Department of Chemistry, PAHER University, Udaipur-313003 (Raj.) India
Email: [email protected]
Abstract
-
Copper and nitrogen co-doped and pure TiO2was prepared through a sol-gel process. The photoanode was prepared by coating of Cu‒N‒TiO2 on the layer FTO
conductive glasses using Rhodamine B dye as sensitizer. Electrolyte I‒/I3‒ redox couple and carbon (graphite)
were used as counter electrode. The co-doped electrode sensitized with Rhodamine B dye showed the open circuit voltage (Voc) = 200.0 mV, short circuit current (isc) =
0.0522 mA, Vpp = 99.4 mV and ipp = 0.0198 mA with FF =
0.18 and power conversion efficiency (η) 0.0032% under 60 mWcm‒2 light intensity. Both pure and doped
semiconductors were analyzed by X-ray diffraction (XRD), scanning electron microscopy (SEM), fourier transform infrared (FTIR) techniques, transmission electron microscopy (TEM) and diffuse reflectance spectra (DRS).
KeyWords:
Dye sensitized solar cell, titanium dioxide,
co-doped, copper sulphate, nitrogen, FTO glasses,
sensitizer.
1.
INTRODUCTION
The most reliable energy source like fossil fuel has been serving the society for last so many decades. Growing energy needs, exhaustion of conventional energy sources and global warming issues have shifted the intent of researchers towards non-conventional energy resources. In view of this, solar energy has attracted much attention, because it directly converts solar energy into electrical power leaving no harmful environment effects.
Usually solar cells are divided in three main categories, called generations. First generation cells are silicon based solar cells, which are expensive to produce and have relatively a low efficiency. The second generation solar cells are called thin film solar cells. They arecheaper to produce than previous one but that too have low efficiency. The term third generation is used for nanocrystalline solar cells and dye sensitized solar cells, and they do not have the p-n junction as in the traditional solar cells.
DSSCs are new type of solar cells, also called Gratzel cell, that deliver higher photoelectric conversion efficiency and low production cost by combining wide-band gap semiconductor electrode, dye as sensitizer, a counter electrode and redox electrolyte like iodide and triiodide ions between them. Gratzel and his co-workers firstly developed solar cell with efficiency about 7% in 1991.[1] They also prepared cis‒X2Bis(2,2′‒bipyridyl‒4,4′‒dicarboxylate)
ruthenium(II) complexes (X=Cl‒, Br‒, I‒, CN‒ and SCN‒),
which act as efficient charge-transfer sensitizers for nanocrystalline TiO2 semiconductor and the power
conversion efficiency of the cell is 10%.[2] Yella et al. obtained 12.3% efficiency using donor-p-bridge-acceptor, zinc porphyrin dye as sensitizer with cobalt (II/III)‒based redox electrolyte.[3] In DSSC, titanium dioxide film is used as the anode. It has many advantages: it is a low cost, non-toxic and widely available.
In recent years, a considerable interest has been attracted on doping of TiO2 nanoparticles for improving the
photoelectric conversion efficiency of cells. Duan et al. made Sn-doped TiO2 based solar cells using both tetra-methyltin
and tetra-n-butyltin. They achieved higher conversion efficiencies about 8.55% and 8.66%.[4] Al-doped titanium dioxide was investigated by Manoharan and Venkatachalam and its power conversion efficiency was increased to 7.26%.[5] Doping of nitrogen (non-metal) has been studied by Motlak et al. which gave efficiency about 4.7% while F-doped based DSSC was having efficiency 5.24%. [6,7] To improve the activity of solar cell further co-doping of TiO2
was also investigated. 9.07% conversion efficiency was achieved by Liu et al. using Zn+Mg co-doped TiO2 electrode
and (N,S) co-doped titania showed a high conversion efficiency of 8.0%. [8,9]
In present work, co-doped TiO2 was synthesized by sol-gel
method using copper and nitrogen as dopants. A prepared co-doped titania was characterized. The DSSC was fabricated with this co-doped TiO2, and the effect of different
© 2015, IRJET ISO 9001:2008 Certified Journal
Page 919
2.
EXPERIMENTAL
2.1 Preparation of Nanocrystalline Pure and Cu‒N
Co-Doped TiO
2Both pure and co-doped Cu‒N‒TiO2 were synthesized by
simple sol-gel method. In this process firstly 2 mL of titanium tetraisopropoxide was mixed with 10 mL of 2-propanol.
A solution of 10 g of CuSO4 and 10 mL conc. nitric acid was
also prepared separately in 100 mL distilled water. Both these solutions were mixed with continuous stirring. As a result, precipitates of Cu‒N‒ Ti(OH)4 was obtained. This
mixture was dried in an oven at 60-110°C up to dryness. After cooling down to room temperature, it was calcined in a furnace at 400°C for 3 hours. After cooling down, the obtained powder of Cu-N-TiO2 was ground in agate mortar
to form fine crystals. The same procedure was followed to prepare for undoped TiO2 with the difference that in this
case no dopant was added.
2.2 Preparation of the DSSCs
The photoanode was prepared with Cu‒N‒TiO2 paste in
acetic acid with few drops of dishwashing liquid as a surfactant.
This paste was coated on the FTO glass (2.2 mm thickness, 7-9 ohm cm‒2, L 25 mm x W 25 mm, Shilpa
Enterprises, Nagpur, India) by doctor blade method and left for a few minutes to let it dry. Then the glass was heated on a hot plate at 100°C for 45 min.
A solution of Rhodamine B (1.6 x 10‒3 M) dye in ethanol
was used as a sensitizer of the working electrode. The working electrode was dipped in dye solution for 15 min. and then rinsed with ethanol to remove extra dye. A counter electrode, coated with carbon (graphite) was
clipped onto the top of the working electrode.
0.55 M iodine and 0.50 M potassium iodide was dissolved in 10 mL of ethylene glycol. This I‒/I3‒ redox
couple was used as liquid electrolyte.
3.
CHARACTERIZATION OF SEMICONDUCTORS
3.1
FTIR Spectra of Doped Cu‒N‒TiO
2The Fourier transform infrared spectroscopy (FTIR) spectra of the synthesized samples in potassium bromide (KBr) pellets were recorded on a Perkin Elmer Spectrum RX1 spectrometer in the range from 4000 cm‒1 to 400 cm‒1 at a
scanning rate of cm‒1/min. The FTIR spectra of Cu‒N‒TiO2 in
given Fig. 1. The broad band at 3368-3318 cm‒1 was due to
O‒H stretching. The peak between at 1630-1622 cm‒1 was
attributed to O‒H bending vibration, due to the absorbed water and hydroxyl groups on the surface of TiO2. [10] In the
low frequency region, the bands around 586-526 cm‒1 were
attributed to the Cu‒O and Cu‒Ti stretching vibration. [11] The Cu‒N symmetric stretching frequency was observed at 455-433 cm‒1 and the mode at 604-625 cm‒1 was due to
Cu‒N‒O bending. [12,13] A typical absorption band occurred around 1091-1014 cm‒1 belonging to Ti‒N stretch
vibrations. [14] The peaks at 479-433 cm‒1 and 780-731
cm‒1 show bending and stretching mode of Ti‒O‒Ti. [15,16]
New peaks in the range of 1091-1014 cm‒1 and 1121-1196
cm‒1 appeared due to N‒TiO2. [17] The bands of O‒Ti‒O and
Ti‒O appeared at 618-625 cm‒1 and 660-626 cm‒1. [18]
RC SAIF PU, Chandigarh
Purnima D-3.sp - 4/28/2015 - B14
4000.0 3600 3200 2800 2400 2000 1800 1600 1400 1200 1000 800 600 400.0
12.0 14 16 18 20 22 24 26 28 30 32 34 36 38 40.5
c m-1 %T
3368,18
2360,39
1622,30
1196,21
1148,15 1091,14
996,28 983,31 961,34
780,31
660,26 618,25604,25
586,26 479,33
455,33
Fig- 1:FTIR spectra of Cu‒N‒TiO2
3.2
X-ray Diffraction
Fig- 2:XRD of undoped TiO2
Fig- 3:XRD of Cu‒N‒TiO2
The X-ray diffraction of undoped TiO2 and Cu‒N‒TiO2
samples are given in Fig. 2 and 3. The XRD patterns were recorded on Panlytical X’ pert Pro model X-ray diffraction
Position [°2Theta] (Copper (Cu))
30 40 50 60 70
Counts
0 1000 2000
© 2015, IRJET ISO 9001:2008 Certified Journal
Page 920
using CuKα radiation as the X-ray source. Thediffractograms were recorded in the 2θ range of 20-80°. The average crystalline size (D) of the undoped and Cu‒N‒TiO2
material can be calculated from the Debye‒Scherrer formula:
D =
… (1)
Where D is the crystalline size (nm), λ is the wavelength of x-ray source (λ = 0.1540 nm for CuKα), β is the full width at half maximum intensity (FWHM‒in radian), and θ is the Bragg diffraction angle (°). It is also confirmed by the spectra that both undoped and doped TiO2 are crystalline in nature.
The average crystalline size of the pure TiO2 was 10.15 nm
and Cu‒N‒TiO2 was 106.6 nm. It was observed that after
doping, the particle size increases.
[image:3.612.318.530.144.301.2]3.3
Scanning Electron Microscopy (SEM)
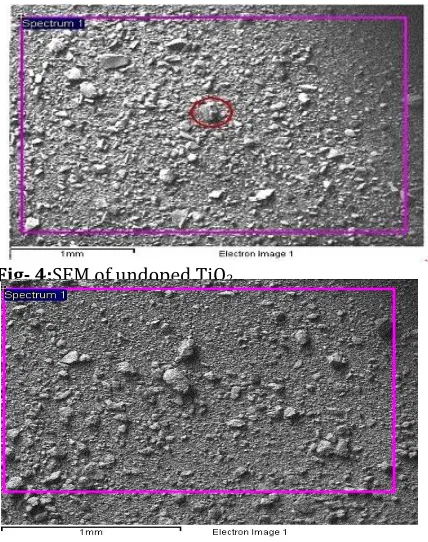
Fig- 4:SEM of undoped TiO2
Fig- 5:SEM of Cu‒N‒TiO2
Fig. 4 and 5 show SEM images of photoanodes fabricated with TiO2 and Cu‒N doped TiO2. SEM has been used to
observe the morphological changes caused by loading of metal and non-metal on the surface of titania. It was observed that combination of the dopants Cu and N on TiO2
increases particle size.
3.4
Transmission Electron Microscopy (TEM)
Fig. 6 and 7 show TEM images of pure and co-doped TiO2.
Doping of TiO2 is clearly observed as evident from some
[image:3.612.38.252.313.584.2]lumps in co-doped TiO2 which is absent in undoped TiO2.
Fig- 6:TEM of undoped TiO2
Fig- 7: TEM of Cu‒N‒TiO2
[image:3.612.319.533.324.482.2]3.5
Diffuse Reflectance Spectra (DRS)
[image:3.612.318.558.542.687.2]© 2015, IRJET ISO 9001:2008 Certified Journal
Page 921
The diffuse reflectance spectrum was scanned between200-800 nm using UV Vis-3000 + spectrophotometer. It shows an intense absorption in the visible region at 758 nm. The band gap of co-doped TiO2 was calculated to be 1.63 eV, which is
much less than undoped TiO2 (3.2 eV).
4.
PERFORMANCE OF DSSC
4.1
Variation of Potential with Time
The effect of potential with time on the electrical output of the cell was observed and results are showed in table 1. The cell was placed in dark and the potential was measured after it becomes stable. A change in potential with the time was observed when the cell was exposed in light (60 mWcm-2).
The potential was measured with digital multimeter (Mastech-M830bZ). The cell was charged for 70 min. and then light was cut off. It was observed that the potential was increased with increasing time.
Table- 1: Variation of potential with time
[Rhodamine B] = 1.6 x 10‒3M; Electrolyte [I2] = 0.55 M, [KI] =
0.50 M; Exposed surface area = 1.0 x 1.0 cm2; Light intensity
= 60 mWcm‒2
Time
(min.) Potential (mV) (min.) Time Potential (mV)
0.0 -182.2 75 -58.7
5 -109.2 80 -60.0
10 -103.3 85 -61.1
15 -86.6 90 -55.0
20 -75.8 95 -53.8
25 -62.3 100 -51.5
30 -64.6 105 -50.9
35 -63.6 110 -49.9
40 -61.7 115 -49.1
45 -60.6 120 -48.7
50 -60.4 125 -48.7
55 -60.1 130 -47.2
60 -59.6 135 -47.1
65 -58.8 140 -47.1
70 (Lightoff) -58.5
4.2
Variation of Current with Time
The effect of current with time on the electrical output of the cell was observed and results are showed in Table 2. The current was measured by digital multimeter (Mastech-M830bZ). The current of cell quickly increases and in few minutes it, reaches its maximum, and it is represented as imax. When irradiation time was increased further, current
starts decreasing steadily and reaches almost a stable
(constant value). This value is represented as ieq when the
source of light was removed, the current starts decreasing further.
Table- 2: Variation of current with time
[Rhodamine B] = 1.6 x 10‒3 M; Electrolyte [I2] = 0.55 M, [KI]
= 0.50 M; Exposed surface area = 1.0 x 1.0 cm2; Light
intensity = 60 mWcm‒2
Time (min.) Current (µA) Time
(min.) Current (µA)
0.0 5.8 75 29.4
5 71.9 (imax.) 80 21.4
10 69.6 85 18.8
15 56.5 90 17.2
20 48.0 95 16.8
25 44.2 100 15.9
30 40.5 105 15.4
35 39.1 110 14.3
40 38.9 115 13.7
45 37.6 120 13.3
50 36.8 125 13.3
55 37.0 130 13.1
60 36.0 135 13.1
65 35.6 140 13.1
70 (Light off) 34.5(ieq.)
4.3
Effect of dye concentration
The potential and current of the cell was observed using different concentration (1.6 x 10‒3 M ‒ 0.3 x 10‒3 M) of dye.
The results are showed in Table 3. It was observed that as the concentration of dye was increased, the number of sensitizer molecules was increased and as a result, the electrical output of the cell also increases.
Table- 3:Effect of dye concentration
Electrolyte [I2] = 0.55 M, [KI] = 0.50 M; Exposed surface area
= 1.0 x1.0 cm2; Light intensity = 60 mWcm‒2
Dye (103M) Potential (mA) Current (µA)
0.3 152.3 11.1
0.6 167.1 28.4
1.0 181.6 36.1
1.3 190.2 42.6
1.6 200.0 52.2
© 2015, IRJET ISO 9001:2008 Certified Journal
Page 922
The effect of the concentration of liquid electrolyte (I2 andKI) on the performance of the DSSC was observed, and the results are showed in the Table 4 and 5.To know the effect of components of redox couple, I2 and KI, the concentration of
one component was kept constant and other was varied. As the concentration of iodine was increased; both, the potential and current were increased. When the potassium iodide concentration was increased, initially the current and potential increased but above 0.50 M, both show a declining behaviour. The optimum conditions for I2 and KI were
obtained as 0.55 M and 0.50 M.
Table- 4:Effect of I2 concentration
Exposed surface area = 1.0 x1.0 cm2; Light intensity = 60
mWcm‒2; [Rhodamine B] = 1.6 x 10‒3M
I2 (M) Potential (mA) Current (µA)
0.39 125.7 6.6
0.43 140.0 11.1
0.47 157.4 20.7
0.51 188.6 45.6
[image:5.612.319.573.169.327.2]0.55 200.0 52.2
Table- 5:Effect of KI concentration
Exposed surface area = 1.0 x1.0 cm2; Light intensity = 60
mWcm‒2; [Rhodamine B] = 1.6 x 10‒3M
KI (M) Potential (mA) Current (µA)
0.44 104.7 18.4
0.46 108.9 23.6
0.48 131.0 42.4
0.50 200.0 52.2
0.51 145.3 15.8
4.5
Effect of surface area of electrode
The performance of the cell was affected by the area of the semiconductor. Its effect was detected by changing the exposed surface area. The results are showed in Table 6. The potential and current were increased with increasing
surface area, but above 1.0 × 1.0 cm2 area, both the current
as well as potential were decreased.
Table 6: Effect of exposed surface area
[Rhodamine B] = 1.6 x 10‒3M; Light intensity = 60 mWcm‒2;
Electrolyte [I2] = 0.55 M, [KI] = 0.50 M
4.6
Effect of light intensity
Light intensity can also affect the electrical output of the cell and therefore, the effect of light intensity was also observed. The results are showed in Table 7. Light intensity was varied from 30 to 70 mWcm‒2. An increasing trend was observed
because an increase in light intensity will increase the number of photon per unit area. The current and potential were found to decrease above 60 mWcm‒2.
Table- 7:Effect of light intensity
[Rhodamine B] = 1.6 x 10‒3M; Electrolyte [I2] = 0.55 M, [KI] =
0.50 M; Exposed surface area = 1.0 x 1.0 cm2
Light Intensity
(mWcm‒2) Potential (mA) Current (µA)
30 161.1 27.3
40 188.9 43.0
50 195.9 48.9
60 200.0 52.2
70 181.7 19.8
5.
i-V CHARACTERISTICS OF THE CELL
The open circuit voltage (Voc), keeping the circuit open and
short circuit current (isc), keeping the circuit closed of the
Area (cm2) Potential (mA) Current (µA)
0.6 x 0.6 140.2 27.9
1.0 x 1.0 200.0 52.2
1.3 x 1.3 188.4 48.8
© 2015, IRJET ISO 9001:2008 Certified Journal
Page 923
cell, were measured by a digital multimeter. The values ofphotocurrent and photopotential were observed with the help of carbon pot (log 470 K) connected in the circuit by applying an external load. The results of variation of potential and current is represented in Table 8.and graphically in Fig. 9
Table- 8:i‒V characteristics
[Rhodamine B] = 1.6 x 10‒3M; Electrolyte [I2] = 0.55 M, [KI] =
0.50 M; Exposed surface area = 1.0 x 1.0 cm2; Light intensity
= 60 mWcm‒2
Fig-9:Photocurrent-voltage curve of the cell
Value of Voc, isc, Vpp (voltage at power point) and ipp (current
at power point) were determined with the help of this plot. The maximum voltage at open circuit (Voc) was 200.0 mV
and the maximum current at short circuit (isc) was 0.0522
mA. The (Vpp) = 99.4 mV and (ipp) = 0.0198 mA were
obtained at power point. Fill factor was calculated by using equation (2) and it was found to be 0.18.
Fill Factor = … (2)
6.
CELL EFFICIENCY
The power conversion efficiency (η) of cell is the ratio of electric output at the power point and power of incident radiation (Pin). The power conversion efficiency (η) was
determined by following equation:
η = …(3)
This cell exhibited 0.003% overall power conversion efficiency. The comparative study of electrical parameters, fill factor and conversion efficiency of co-doped and undoped DSSC are given in Table 9.
Table- 9: Comparative results of pure and Cu‒N co-doped TiO2 in DSSC
7.
CONCLUSION
Both pure and co-doped (Cu‒N‒TiO2) semiconductors were
synthesized through sol-gel method. The cell was assembled with this semiconductor, mixture of I2 and KI as redox
electrolyte, rhodamine-B as sensitizer and carbon as counter electrode. The results indicated that doping of Cu (metal) and N (non-metal) on TiO2 increased the photocatalytic
activity of semiconductor in visible range. The performance of the cell was improved 18 times as compared to pure TiO2.
REFERENCES
[1] B. O’Regan and M. Gratzel, “A low-cost, high efficiency solar cell based on dye-sensitized colloidal TiO2films,”Nature, vol. 35, pp. 737-739, 1991.
[2] M. K. Nazeeuddin, A. Kay, I. Rodicio, R. Humphry-Baker, E. Muller, P. Liska, N. Vlachopoulos, and M. Potential (mV) current (µA) Fill Factor
200.0 0.0
188.9 0.8
170.7 1.3
150.4 3.0
134.0 6.5
121.5 10.1
109.7 16.5
102.8 18.2
99.4 19.8 0.18
76.1 23.1
63.8 25.3
55.1 28.0
41.0 29.9
28.3 35.5
19.1 41.0
15.4 42.8
13.8 43.9
10.1 45.1
8.8 46.4
5.7 48.4
0.0 52.2
Sample (mA)Ipp (mV) Vpp (mA) Isc (mV) Voc FF 10η x 2
(%)
Pure TiO2 0.0085 12.8 0.0163 40.4 0.16 0.018
© 2015, IRJET ISO 9001:2008 Certified Journal
Page 924
Gratzel, “Conversion of light to electricity by cis-X2Bis(2,2ʹ-bipyridyl-4,4ʹ-dicarboxylate) ruthenium (II) charge transfer sensitizers (X= Cl‒, Br‒, I‒and SCN‒) on
nanocrystalline TiO2 electrodes,” J. Am. Chem. Soc., vol.
115, pp. 6382-6390, 1993.
[3] A. Yella, H-W. Lee, H. N. Taso, C. Yi, A. K. Chandiran, M. K. Nazeeruddin, E. W-G. Diau, C-Y.Yeh, S. M. Zakeeruddin, and M. Gratzel, “Porphyrin-sensitized solar cells with cobalt (II/III)-based redox electrolyte exceed 12 percent efficiency,”Science, vol. 334(6056), pp. 629-634, 2011.
[4] Y. Duan, N. Fua, Q. Zhang, Y. Fanga, X. Zhou, and Y. Lin, “Influence of Sn source on the performance of dye-sensitized solar cells based on Sn-doped TiO2
photoanodes: A strategy for choosing an appropriate doping source,”Electrochim.Acta.,vol. 107, pp. 473-480, 2013.
[5] K.Manoharanand P. Venkatachalam, “Photoelectrochemical performance of dye-sensitized solar cells based on aluminum-doped titanium dioxide structures,”Mater. Sci. Semicond. Process.,vol. 30, pp. 208-217, 2015.
[6] M. Motlak, M. S. Akhtar, N. A. M. Barakat, A. M. Hamza, O-B. Yang, and H. Y. Kim, “High-efficiency electrode based on Nitrogen-Doped TiO2 nanofibers for
dye-sensitized solar cells,” Electrochim.Acta, vol. 115, pp. 493-498, 2014.
[7] S. I. Noha, K-N.Bae, H-J.Ahn, and T-Y. Seong, “Improved efficiency of dye-sensitized solar cells throughfluorine-doped TiO2 blocking layer,”Ceram.
Int., vol. 39, pp. 8097-8101, 2013.
[8] Q. Liu, Y. Zhou, Y. Duan, M. Wang, and Y. Lin, “Improved photovoltaic performance of dye-sensitized solar cells (DSSCs) by Zn + Mg co-doped TiO2 electrode,” Electrochim.Acta, vol. 95, pp. 48-53,
2013.
[9] Y. Li, L. Jia, C. Wu, S. Han, Y. Gong, B. Chi, J. Pu, and L. Jian, “Mesoporous (N, S) co-doped TiO2 nanoparticles
as effective photoanode for dye-sensitized solar cells,”J. Alloys Compd., vol. 512, pp. 23-26, 2012. [10] R. Ocwelwang and L. Tichagwa, “Synthesis and
Characterization of Ag and Nitrogen Doped TiO2
Nanoparticles Supported on A Chitosan-PVAE Nanofibre Support,”Int. J. Adv. Res. Chem. Sci.,vol. 1(2), pp. 28-37, 2014.
[11] B. V. Rao, A. D. P. Rao, and V. Raghavendra Reddy, “Influence of Mo6+ On Ftir And Mössbauer
Spectroscopic Properties of Copper Ferrite,” Int. J. Innov. Res. Sci. Eng. Technol., vol. 2(12), pp. 7768-7779, 2013.
[12] Y. Suffren, F-G. Rollet, and C. Reber, “Raman spectroscopy of transition metal complexes: molecular vibrational frequencies, phase transitions,
isomers, and electronic structure,”CommentsInorg. Chem., vol. 32:5-6, pp. 246-276, 2011.
[13] H. Tachikawa, T. Iyama, and T. Hamabayashi, “Metal– ligand interactions of the Cu–NO complex at the ground and low-lying excited states: an ab initioMO study,” Electron. J. Theor. CH., vol. 2, pp. 263–267, 1997.
[14] A. Rahmati, “Nitrification of Reactively Magnetron Sputter Deposited Ti-Cu Nano-Composite Thin Films,”SoftNanoscience Letters, vol. 3, pp. 14-21, 2013. [15] R. Urlaub, U. Posset, and R. Thull, “FT-IR spectroscopic
investigations on sol-gel-derived coatings from acid-modified titanium alkoxides,” J. Non-Cryst. Solids, vol. 265, pp. 276-284, 2000.
[16] R. Sharmila Devi, Dr. R. Venckatesh, and Dr. RajeshwariSivaraj, “Synthesis of Titanium Dioxide Nanoparticles by Sol-Gel Technique,” Int. J. Innov. Res. Sci. Eng. Technol., vol. 3(8), pp. 15206-15211, 2014. [17] H. Diker, C. Varlikli, K. Mizrak, and A. Dana,
“Characterizations and photocatalytic activity comparisons of N-doped nc-TiO2 depending on
synthetic conditions and structural differences of amine sources,”Energy, vol. 36, pp. 1243-1254, 2011. [18] K. Lv, H. Zuo, J. Sun, K. Deng, S. Liu, X. Li, and D. Wang,
“(Bi, C and N) codoped TiO2 nanoparticles,” J. Hazard.
![Table- 5:Effect of KI concentration Exposed surface area = 1.0 x1.0 cm2; Light intensity = 60 mWcm‒2; [Rhodamine B] = 1.6 x 10‒3M](https://thumb-us.123doks.com/thumbv2/123dok_us/8208813.817727/5.612.319.573.169.327/table-effect-concentration-exposed-surface-light-intensity-rhodamine.webp)
