IMPLEMENTATION OF MICROSTRIP PATCH ARRAY ANTENNA WITH
BEAMFORMING SYSTEMS
P.Hamsagayathri (Research Scholar) Department of ECE
Bannari Amman Institute of Technology Sathyamangalam, Erode
P.Sampath (Professor) Department of ECE
Bannari Amman Institute of Technology Sathyamangalam, Erode
ABSTRACT
Breast cancer is one of most common life-threatening diseases among world’s women. Early detection of Breast cancer aids in fast and effective
treatment to save life. As mammogram has certain limitations, Microstrip antennas are used as alternative in growing medical application. The
primary objective of the project is to design a simple and cost effective Micro strip Patch array antenna with each has dimension of 37 mm X 28
mm using FR4 substrate for operating frequency 2.45 GHz. The system of 4 -element microstrip linear array antenna along with Butler matrix is
designed and analyzed to separate the desired signal with phase difference. It also combines the signals and steer the radiation in particular
direction using Wilkinson power divider and passive Butler matrix. Experimental results of proposed antenna are simulated and discussed using
the ADS simulation software. The proposed antenna has a bandwidth of 30 MHz covering the frequency range 2.445-2.475 GHz, the return loss
below -30 dB and antenna gain of 7 dBi. The patch antenna holds good efficiency of 84%. This paper proposes design patch array antenna with
beam forming system that can be applied for early Breast tumor detection in women.
Keywords— Dielectric constant, return loss,Gain, Bandwidth, Patch antenna, Mammography.
I. INTRODUCTION
Over the last few years, a significant growth of research involving the use of microwaves to image the human body and many researches are ongoing to the use of microwaves for breast cancer diagnosis. Breast cancer is one of the most life- threatening tumors among the women in the world. Early diagnosis of cancer is a key factor in providing long-term survival of breast cancer patients. The X-ray mammography is commonly used diagnostic technique for breast tumors detection in Women. However, ionization effects cause health hazard, while breast compression induce considerable
discomfort in patients. Tumors located close to the chest wall or underarm result in false negatives. As per World Health Organization (WHO), Mammography has 20% False-negative and 12% False-positive rate [7]. The limitations of X-ray
Mammography has motivated to develop the microstrip patch antenna as alternate tool for breast cancer detection [4]. This technology leverages the contrast between the dielectric properties of benign and malignant tissues at microwave frequencies to identify the presence and location of significant scatters. The microwave breast imaging technique works on the principle where the signal is scattered by an object when
GE-International Journal of Engineering Research
Vol. 5, Issue 1, January 2017 Impact Factor- 5.613
ISSN(O): 2321-1717, ISSN(P): 2394-420X
© Associated Asia Research Foundation (AARF) Publication
the object is illuminated under an electromagnetic signal [5]. The scattering parameters of the signal depend on various factors like signal strength, material properties of the object and so on. For a given signal source and the environment, the scattered signals depend on the electrical properties of the object, especially dielectric and conductivity. This technique is used to detect the tumor in the breast using microwave signals. The breast tumors have very distinct electrical properties with higher dielectric permittivity and higher conductivity, which allows them to detect by analyzing the scattered signals. Breast tumor cells scatter more signal than the normal breast tissues, which can be received by a separate antenna. The scattering properties of the transmitting antenna changes due to the scattered signals and it can be analyzed and utilized for the tumor detection [10].
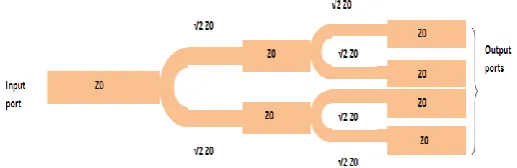
II. DESIGN OF 4:1 WILKINSON POWER DIVIDER The Power divider is especially important microwave component used to feed the array of antenna systems. It splits input power between 'n' ports with equal amplitude and phase. Though it is similar to corporate feed network, Wilkinson power divider requires less space. In 4:1 Power divider, there are one input port and four output ports.
Figure 1 4:1 Wilkinson Power divider
The quarter-wavelength transmission line in the divider should have the characteristic impedance of √2 Z0 and thus length and width of transmission line are calculated and simulated in ADS.
III.DESIGNOF4 X 4BUTLERMATRIX
The Butler matrix is used as the passive beam forming device that steer the antenna radiation in different directions [15]. 4 x 4 Butler matrix has 4 input ports and 4 output ports. The
output from power divider is connected to input of the Butler matrix and four different arrays of antenna are connected to output of the Butler matrix to transmit in different direction. Butler matrix consists of 4 Quadrature and 1 crossover coupler which divide the input power into 4 outputs with same amplitude but with different phase angle.
Advantages
The main advantages of Butler matrix are
Easily implemented using Hybrid couplers and phase shifters
Narrow Beam width with high directivity
Possible to achieve the continuous beam scanning
Require minimum number of components
A. Design of 900 Hybrid Coupler
[image:2.595.38.297.479.563.2]The 900 Hybrid couplers are passive device that generates the equal power division (3 dB) with 900phase shift at its output ports.
Figure 2 900 Hybrid Coupler
The 900 hybrid coupler can be designed using scattering parameters
[S]ℎ𝑦𝑏𝑟𝑖𝑑 = -1/ √2
Figure 3 Design of 900 Hybrid Coupler
B. Design of Crossover (0 dB Coupler)
The crossover can be constructed using two 900 Hybrid couplers with two input ports and two output ports. In crossover, adjacent ports are isolated and it is also called as 0 dB coupler. The scattering parameters of the crossover is shown below
[S]𝑐𝑟𝑜𝑠𝑠𝑜𝑣𝑒𝑟 = -1/ √2
[image:3.595.51.264.284.490.2]
0
1
0
0
0
1
1
0
0
0
1
0
j
j
j
j
Figure 4 Design of 0 dB Crossover
The length and width of the butler matrix elements are calculated based on the characteristic impedance and simulated in ADS using below design layout.
Figure 5 Design of 4 x 4 Butler Matrix
IV.RECTANGULARPATCHANTENNADESIGN The design procedure of rectangular Microstrip patch antenna has three essential parameters. They are:
Frequency of operation (fr)
The resonant frequency of the antenna must be chosen appropriately to be use for specific application. The resonant frequency for proposed antenna design is 2.45 GHz.
Dielectric constant of the substrate (εr)
The dielectric constant of substrate (εr ) material plays an vital role in the patch antenna design. A substrate with a high dielectric constant reduces the size of the antenna but it also affects the antenna performance. So, there is a trade-off between dimension and performance of patch antenna where the increase in dimension of substrate decreases the antenna performance.
Height of dielectric substrate (h)
Microstrip patch antenna to be used in biomedical systems, antenna should not be bulky. The height of the substrate is chosen as 1.6 mm.
Step 1: Calculation of Width of Patch
𝑾 = 𝟏
𝟐𝒇𝒓 𝝁𝟎𝜺𝟎 𝟐
𝜺𝒓 +𝟏 (1)
Where
𝜺𝒓 = Relative Permittivity
𝒇𝒓 = Resonant Frequency
Step 2: Calculation of Effective Dielectric Coefficient (εr)
The effective dielectric constant can be calculated as
𝜺𝒓𝒆𝒇𝒇 = 𝜺𝒓 +𝟏
𝟐 + 𝜺𝒓−𝟏
𝟐 𝟏 + 𝟏𝟐
𝒉 𝒘
−𝟏/𝟐
(2) Where
[image:3.595.40.549.470.780.2]𝒉 = Height of the substrate
𝒘 = Width of the substrate
Step 3: Calculation of Effective Length (Leff)
The effective length is
𝑳𝒆𝒇𝒇 = 𝒄
𝟐𝒇𝟎 𝜺𝒓𝒆𝒇𝒇 (3)
Where
𝜺𝒓𝒆𝒇𝒇 = Effective dielectric constant
Step 4: Calculation of Length Extension (L)
∆𝑳
𝒉 = 𝟎. 𝟒𝟏𝟐
𝜺𝒓𝒆𝒇𝒇+𝟎.𝟑 𝒘𝒉+ 𝟎.𝟐𝟔𝟒
𝜺𝒓𝒆𝒇𝒇−𝟎.𝟐𝟓𝟖 𝒘𝒉+𝟎.𝟖 (4) Step 5: Calculation of actual Length of Patch (L)
The actual length of radiating patch is obtained by
𝑳 = 𝑳𝒆𝒇𝒇 − 𝟐∆𝑳 (5) Where
𝑳𝒆𝒇𝒇 = Effective Length
∆𝑳 = Length Extension
Table. 1 Design specification of Patch antenna
Parameter Specification
Operating Frequency 2.45 GHz
Length of the patch 27 mm
Width of the patch 38 mm
Substrate Height 1.6 mm
Patch Thickness 0.7 mil
Substrate FR4
Dielectric constant of substrate 4.6
[image:4.595.342.525.66.238.2]Loss Tangent 0.0023
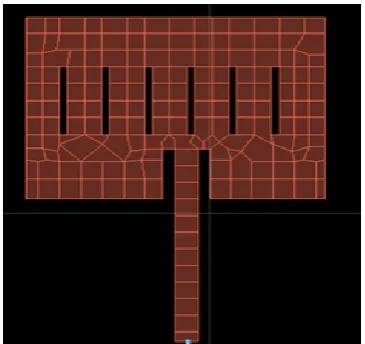
Figure 6 Design of Microstrip slotted patch
antenna
Figure 7 Microstrip slotted patch antenna with
Beam forming system
V.SIMULATIONRESULTSANDDISCUSSION The proposed antenna and beam forming system is simulated through the simulation tool ADS to evaluate its performance.
[image:4.595.342.577.299.454.2][image:5.595.54.554.32.772.2]
Figure 8 S- Parameters of 4:1 Power divider
Figure 9 Insertion loss of port 2 and 3
Figure 10 Insertion loss of port 4 and 5
From the Figure 8, 9 and 10, S-parameters of 4:1 power divider are analyzed and inferred that it has the return loss of -36 dB and insertion loss (S21, S31, S41 and S51) of 6 dB.
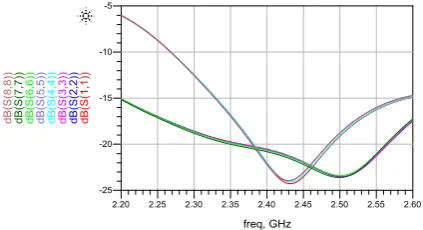
Figure 11 S- Parameters of Butler Matrix
Figure 12 S-Parameters of Butler matrix with
Port 1 excitation
Figure 13 S-Parameters of Butler matrix with
[image:5.595.58.266.66.152.2]Port 2 excitation
Figure 14 S-Parameters of Butler matrix with
Port 3 excitation
Figure 15 S-Parameters of Butler matrix with
[image:5.595.37.249.520.635.2]The main goal of 900 hybrid coupler is to provide excellent return loss and the phase shift of 900 between the output ports. The length and width of the transmission lines are optimized and obtained the return loss of -24 dB. The S- Parameter magnitude response is shown in Figure 11,12, 13, 14, and 15 for different port excitation and phase plots are shown below
Figure 16 Phase difference between port 1 and 5
[image:6.595.319.535.270.457.2]
Figure 17 Phase difference between port 1 and 6
Figure 16 and 17 depicts the phase difference between ports 5 and 6 with respect to port 1.From the analysis, it is observed that, it has the phase difference of 20 and -70 degrees respectively
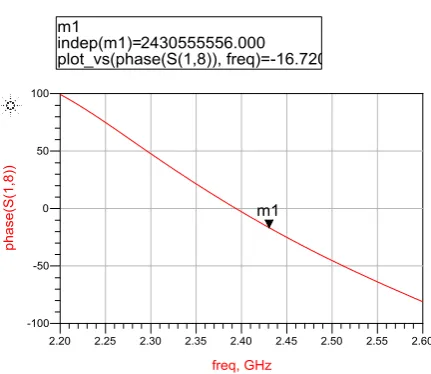
Figure 18 Phase difference between port 1 and 7
Figure 19 Phase difference between port 1 and 8
From above Figure 18 and 19, it is clear that phase differences between output ports 7 and 8 are shown. When port 1 is excited, the phase difference between output ports are tabulated below
Table. 2 Phase difference between the output ports
Input Port Output Port Phase Difference
Port 1 Port 5 20
Port 1 Port 6 -70
Port 1 Port 7 76
[image:6.595.58.257.379.558.2]Figure 20 S-Parameters of slotted patch antenna
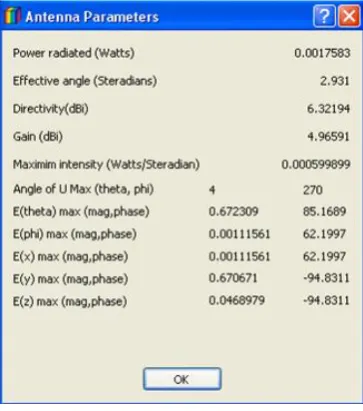
Figure 21 Antenna parameters of slotted patch antenna
[image:7.595.322.556.274.384.2]
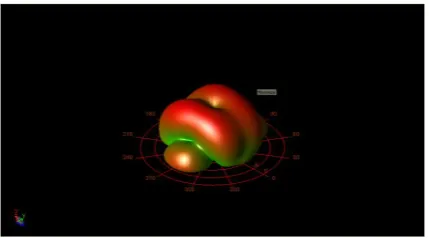
Figure 22 Radiation pattern of slotted patch antenna
Figure 23 Current distribution of slotted patch
antenna
Figure 24 Efficiency of slotted patch antenna
Figure 20 and 22 shows that the radiation pattern of the single patch antenna has single main lobe with return loss of -14 dB resonating at 2.45 GHz. Figure 22 depicts that it has the gain of 4 dBi and directivity of 6 dBi and efficiency is captured in Figure 24. As it has sharp edge slots, the current distribution is plotted in the Figure 23.
[image:7.595.78.260.286.492.2] [image:7.595.55.280.537.698.2] [image:7.595.359.517.547.686.2]beam forming system
Figure 26 Antenna parameters of slotted patch antenna
with beam forming system
Figure 27 Radiation pattern of slotted patch antenna
[image:8.595.341.530.295.423.2]with beam forming system
Figure 28 Current distribution of slotted patch antenna
with beam forming system
The output from Butler matrix is connected to the input of the array of antennas and simulated using ADS and antenna parameters are analyzed. Figure 25, 26 shows that combined
beam forming network has return loss of -30 dB with gain of 7 dBi and directivity of 11dBi. Directive lobes are shown in the radiation pattern and current distribution of the beam forming network is capture in Figure 27 and 28.
VI.FABRICATIONANDTESTING
The proposed antenna and beamforming system has been fabricated and tested using Agilent Technologies - Vector Network Analyzer (VNA).The testing setup was performed for single patch antenna, beam forming circuit and then combined circuit of beam forming system with array of antennas. In Figure 29, single patch antenna input port is connected to port 1 of VNA using cables.
[image:8.595.50.265.315.434.2].
Figure 29 Measurement of S11 for single patch antenna
The scattering parameters (-21.46 dB) and resonant frequency are measured as 2.45 GHz as shown in Figure 29. The a n t e n n a p a r a m e t e r s a r e c o m p a r e d f o r s i m u l a t e d a n d fabricated results in the below Table.3.
Table .3 Comparison of patch antenna parameters for simulated and fabricated results
Antenna
Parameters
Simulation
Results
Fabrication results
Resonant Frequency
2.46 GHz 2.45 GHz
[image:8.595.49.269.501.612.2]The testing setup was performed for beam forming circuit where port1 of the VNA is connected to input port of the power divider and output port is connected to port 2 of the VNA.
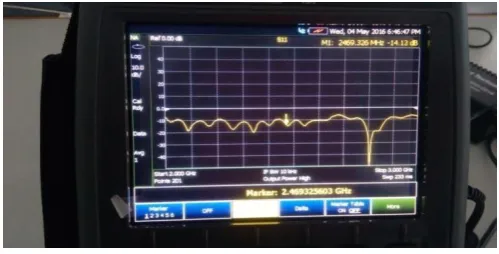
Figure 30 Measurement of S11 for Beam forming
circuit with array of antennas
[image:9.595.42.292.133.260.2]The magnitude response of S11 parameters is observed as -14.12 dB at resonant frequency of 2.46 GHz as shown in Figure 30.The corresponding phase response at 2.46 GHz is measured as 230 and it is clearly depicted in Figure 31.
Figure 31 Phase response for Beam forming circuit
with array of antennas
Table .4 Comparison of patch antenna parameters for simulated and fabricated results
Antenna Parameters Simulation results Fabrication results Resonant Frequency
2.45 GHz 2.46 GHz
Return loss -30 dB -14 dB
VII.CONCLUSION
In this paper, power divider, elements of Butler matrix and array of patch antenna characteristics are investigated using ADS software. From the analysis, it is observed that the four patch microstrip antenna with beam forming system is more efficient which gives higher gain of 7 dBi and better return loss of -30 dB at the desired frequency range centered at 2.45 GHz. Antenna parameters like efficiency, directivity , gain and return loss are improved for patch antenna along with butler matrix.
REFERENCES
[1] Constantine A. Balanis “Antenna Theory – Analysis and Design” in Wiley India Edition.
[2] Rabia Çalışkan et al , “A Microstrip Patch Antenna Design for Breast Cancer Detection” - World Conference on Technology, Innovation and Entrepreneurship - Science direct @2015
[3] Younis M. Abbosh, “Breast cancer diagnosis using microwave and hybrid imaging methods” - International Journal of Computer Science & Engineering Survey (IJCSES) Vol.5, No.3, June 2014
[4] N. Mahalakshmi and Vijay Jeyakumar,“Design and Development of Single Layer Microstrip Patch Antenna for Breast Cancer Detection” - Bonfring International Journal of Research in
Communication Engineering, Vol. 2, Special Issue 1, July 2014
[5] T.-H. Kim and J.-K. Pack,“Measurement of electrical characteristics of female breast tissues for the development of the breast cancer detector” - Progress In Electromagnetics Research C, Vol. 30, 189{199, 2012
[6] A. Sanpanich et al, “Basic investigation of breast cancer detection in early stage using Microwave Radiation: Finite Element Analysis Approach” in Biomedical Engineering International Conference (BMEiCON-2011),
[7] S. Adnan et al, “Microstrip Antenna for Microwave Imaging Application” - Progress In Electromagnetics Research Symposium Proceedings, Marrakesh, Morocco, Mar. 20{23, 2011
[8] Liting Wang et al, “Design of Ultra-Wideband MIMO antenna for breast tumor detection” in International Journal of Antennas and Propagation , 2014.
[image:9.595.73.298.372.494.2][10] Liting Wang et al, “Design of Ultra-Wideband MIMO antenna for breast tumor detection” in International Journal of Antennas and Propagation , 2014.
[11] H. M. Chen and K. L. Wong, “On the circular polarization operation of annular-ring microstrip antennas,” IEEE Trans. Antennas Propag., vol. 47, pp. 1289–1292, 1999.
[12] Advanced Design System, 2011–ADS 2011.01, Agilent Technologies, Inc.2000.
[13] Nhi T. Pham, Gye-An Lee and Franco DeFlaviis, Microstrip Application ,Department of Electrical and Computer science,University of California,USA.
[14] Nasimuddin, Z. N. Chen, and X. Qing, Asymmetric-circular shaped slotted microstrip antennas for Asymmetric-circular polarization and RFID applications,” IEEE Trans. Antennas Propag., vol. 58, no. 12, pp. 3821–3828, Dec. 2010.
[15] Osama Ullah Khan “Design of X-band 4x4 Butler Matrix for Microstrip Patch Antenna Array” Electronic Engineering Department, NED University of Engineering & Technology.
[16] M. F. Abd Kadir, M. R. Che Rose, M. S. R. Mohd Shah, D. Misman, M.K. Suaidi, M. Z. A. Abd Aziz, “4x4 Butler Matrix Design by Using Circular Ben”Asia pacific conference on applied electromagnetic proceedings, December, 2007.