SCIENTOMETRIC ASSESSMENT OF GLOBAL PUBLICATIONS
OUTPUT ON GREEN TECHNOLOGY DURING 2006-2015
Dr. V. Kalaiappan
University Assistant Librarian, Marina Campus Librarian University of Madras
Chennai - 600 005, India. &
Dr. R. Santha kumar
Young Professional II, ICAR-Central Institute of Brackishwater Aquaculture R A Puram, Chennai - 600 028, India.
ABSTRACT
This paper attempts to highlight the growth of green technology research in global based on the number of publications appeared in the web of science database. During the period (2006-2015) a total of 8610 publications were published by the scientists in the field. The average number of publication per year was 861. The highest numbers of publications (1512) were published in the year 2015. Authors from USA have contributed maximum number of publications compared with other countries and India stood 4th rank in terms of productivity in this field. This paper analysed the broad features of literature on green technology focusing on year wise growth of publications, most prolific authors, highly productive institutes, highly productive countries, language wise distributions of publications, high productive subjects and most preferred journals for publication.
Keywords: Green technology, relative growth rate and doubling time
1 Introduction
Scientometrics is a novel discipline which analyses scientific publications; to explore
the structure and growth of scientific publications. The Bibliometric / Scientometric /
Informetric techniques are widely and frequently used to analyse various quantitative or International Research Journal of Human Resources and Social Sciences Vol. 4, Issue 6, June 2017 Impact Factor- 5.414
ISSN(O): (2349-4085 ) ISSN(P): (2394-4218)
qualitative aspects of publications. It is a scientific field that studies the evolutions of science
through some quantitative and qualitative measures of scientific information, as more number
of scientific articles is published in a given period of time, and their citation impact, etc. The
history of science and technology, philosophy of science and sociology of scientific
knowledge are the related fields of Scientometrics.
Scientometric is an academic discipline and number of research is being carried out for a
quantitative study of the various aspects of literature of a given subject. It is a branch of
Information Science which analyses quantitatively the published information based on
bibliographic data elements. The Scientometric techniques are being used for a variety of
purposes like determination of various scientific indicators, evaluation of scientific output,
selection of journals for libraries and even forecasting the potential on particular field. The
popularity in the adoption of Scientometrics techniques in various disciplines stimulated
stupendous growth of literature on Scientometrics and its related areas.
The Scientometric techniques are used to understand the magnitude of the growth of a
particular discipline. Especially the trends and pattern in growth, contribution of a particular
author or institutions and the collaboration pattern, relative growth rate and so on.
2.Scientometric: An Overview
Scientometric is of recent origin and relatively a new area, which emerged as a research
front in its own way in Information Science. The terms like „Librametrics‟, „Bibliometrics‟, „Informetrics‟ and „Scientometrics‟ have been used synonymously in order to study the
growth of literature in a discipline and other aspects of literature quantitatively. Russians used
the term Scientometrics in the late sixties for quantitative aspects of studies in science of
science. Now, Scientometrics means studies of quantitative aspects of science of science and
technology and would include “technometrics” also. There has been ever growing interest
among scientometrists to publish data on individual scientists who are role model scientists or
mentors.
3. Review of related Literature
Brij Gupta and AdarshBala (2013)1 analysed the research output of India in epilepsy
research during 2002-11 on several parameters including the growth, rank and global
publications share, citation impact, share of international collaborative papers, contribution of
impact of most productive institutions and authors, media of communication and
characteristics of high cited papers. The Scopus Citation Database has been used to retrieve
the data for 10 years (2002-11).
Mini Devi and Lekshmi (2014)2 the article explores the Scientometric assessment of
publication productivity of Jawaharlal Nehru Tropical Botanic Garden and Research Institute
(JNTBGRI). The data for the study was taken from the Annual report of the JNTBGRI from
2001-2010 which were then tabulated and analysed. The scientists of JNTBGRI prefer mostly
Indian journals to publish their articles.
Kumar (2014)3 made a Scientometric Study on Digital Literacy in Online Library
Information Science and Technology Abstracts (LISTA) during the year 1997 to 2011. And,
the study also examined the distribution of articles (age-wise, year-wise, and article-wise),
authorship pattern, subject, language, and geographical distribution. Bradford‟s law used to
determine the scattering of journal articles.
Gupta et al. (2013)4 analysed India‟s performance in science and technology (S&T), using
publications data and applied different quantitative and qualitative measures. Its focuses on
India‟s global publication share, growth rate, citation quality, international collaborative
publications share, its publication share and distribution in various broad and narrow subjects
using 15 years data from the Scopus international multidisciplinary database. The study
suggests the need to increase the pace of Indian scientific research and also improve its
quality.
Mu-Hsuan Huang and Hsiao-Wen Yang (2013)5 made a study on bibliometric analysis to
explore papers and patents in the field of fuel cell. The research data were retrieved from the
WoS (Web of Science) database and USPTO patent data from the period between 1991 and
2010, which consists of 20,758 papers and 8,112 patents. The results indicate that there is an
upward growth in both papers and patents in fuel cell, with a higher growth rate for papers.
Santhanakarthikeyan, et al. (2013)6 discussed the origin and development of Scientometric
study by comparing and contrasting currently available e-resources with pre-internet era.
They also briefly touch upon the prospects of fast emerging wireless technology and the
necessity of existing methods of study to be constantly transformed to ensure the
compatibility of the existing sources with the anticipated technological advancements.
ShadiAsadzandi (2013)7 made a Scientometric study on quantity and quality of publication
trends of media literacy based on Scopus reports. The population under the study was
analyzed based on date of publication, type of document, language of the documents, source
of publications, subject areas, authors and their affiliations.
Kalaiappan et al. (2010)8 made a bibliometric analysis of remarkable contributions of Prof.
G.N. Ramachandran (popularly known as GNR), an eminent biophysicst and crystallographer
so as to understand the nature and magnitudes of his contributions to the field. This paper
also examines the contributions of GNR in the fields of biophysics and crystallography,
magnitude of his collaborations, and year-wise distribution of his productivity.
Kanagavel, et al. (2013)9 made a Scientometric analysis of research productivity in Wind
Power and a sum of 325 records were obtained from the Web of Science for 5 calendar years
spanning from 2008 to 2012. The study gives an analytical view of the research literature
output in Wind Power research in context of the India by language and forms of publications
and prolific authors.
Satish Kumar, et al. (2012)10 presented Scientometric portrait of Dr. SwaranJeet Singh
Flora, a well-known scientist of Defense Research Development Establishment (DRDE),
Ministry of Defense, Gwalior, India. He has published a total of 278 articles in national and
international journals on various domains like arsenic, lead, drug development for metal
toxicity, oxidative stress and role of antioxidants, etc. The scientist has collaboration research
along with high productivity.
Sujit Bhattacharya and Shilpa (2011)11 made through bibliometric and other innovation
indicators (standards, products/processes developed), the present state of development of
nanotechnology research and innovation in India. The findings are discussed in the context of
China‟s activity in this field.
Gupta and AdarshBala (2011)12 examined India‟s performance in S&T on several
quantitative measures including India‟s global publication share, rank and growth rate, its
publication share in various subjects in terms of national and global context using 15 years
publications data (1996-2010) from the Scopus database.
4. Green Technology
Green technology is a recent trend, and erode the pollution in all aspect of human life,
like protection of forest and environment. It is benefit of nature and also clean and green
human and earth. To ensure the earth remains healthy for all life and conventional and non
conventional sources of energy. This technology helps recycle waste materials, water, air and
Green technologies encompass various aspects of technology which help us reduce the
human impact on the environment and create ways of sustainable development. Social
equitability, economic feasibility and sustainability are the key parameters for green
technologies. Today the environment is racing towards the tipping point at which we would
have done permanent irreversible damage to the planet earth. Green technology uses
renewable natural resources that never depletes. Green technology uses new and innovative
energy generation techniques.
This is clear from the scientometric evidence from 2006 to 2015, that the number of
publications in the Web of Science database was increased from 381 to 1512. Therefore the
present study has been undertaken to know the growth and development of publications in the
field of green technology.
5. Need for the study
Bibliometric analysis of scientific publications is an important aspect of research
endeavor in Information Science in recent years. The bibliometric studies are used to identify
the pattern of publications, authorship, citations, secondary journal coverage, and so on.
These factors can give an insight into the dynamics of a subject, which consequently leads to
better information handling and management. Bibliometric analysis has received adequate
attentions in recent years and it has been widely applied to evaluate the research performance
of the scientists and the growth of various disciplines. Further, bibliometric data could be
used for the identification of emerging research areas, and in the evaluation of research
performance of individual scientists, research groups and countries. It aims to integrate the
cognitive or intellectual structure of research with a view to appraise the relations among the
authors, institutions, journal articles and as a means of assisting the peer review procedure.
Bibliometric analysis of literature in various disciplines has been carried out by using primary
journals or secondary sources to examine the quantitative aspects of literature growth in a
particular field of knowledge. Quantitative measurement of publications, citations and other
parameters have been largely applied and used in evaluating scientific research.
6. Objectives for the Study
The main objective of this study is to analyse the global research performance in the
field of green technology as reflected in the publication output during 2006-2015. In
Document types used for communications
Annual growth of publications
Most prolific authors
Geographical distribution of research output
Highly productive institutes
Language-wise distribution of publications
Most preferred source titles for publication in the field and
High productive subject areas
Limitation of the study
7. Limitation of the study
This paper is focus on the growth of green technology research in global based on the
number of publications appeared in the web of science database. During the period
(2006-2015)
8. Materials and Methods
The Web of Science database was used for retrieving data on green technology in topic
field. A total of 8610 publications were downloaded and analysed by using the Microsoft
excels per the objectives of the study. The Web of Science database allows us to refine the
results in terms of publication years, countries, institutes, authors, language, subjects and
source titles.
9 Data analysis and interpretations
[image:6.595.66.533.581.761.2]9.1 Forms of publications
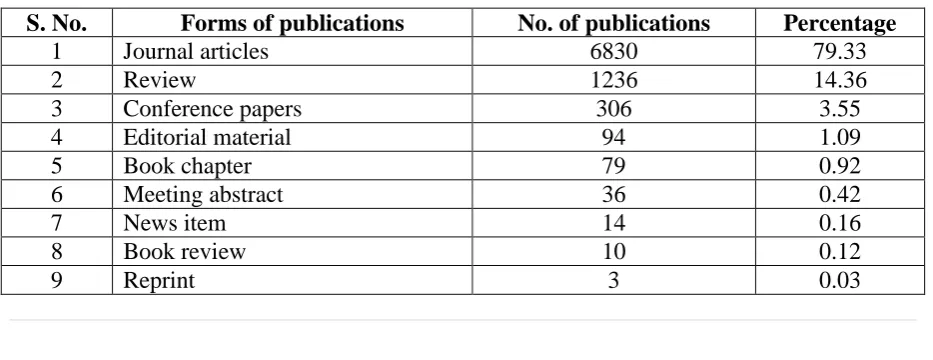
Table 1 Forms of publications
S. No. Forms of publications No. of publications Percentage
1 Journal articles 6830 79.33
2 Review 1236 14.36
3 Conference papers 306 3.55
4 Editorial material 94 1.09
5 Book chapter 79 0.92
6 Meeting abstract 36 0.42
7 News item 14 0.16
8 Book review 10 0.12
10 Letter 2 0.02
[image:7.595.143.458.94.265.2]Total 8610 100.00
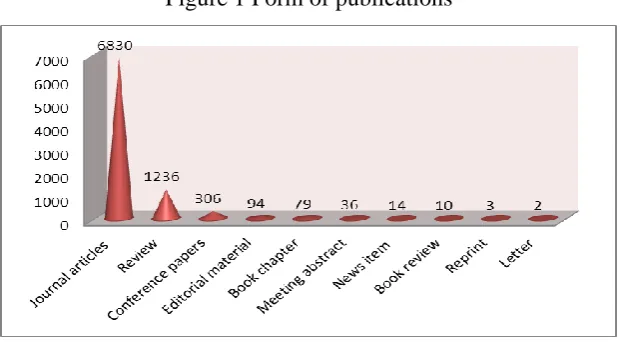
Figure 1 Form of publications
The table 1 reveals that the major source of publications covered by web of science
databases on green technology research is Journal articles with 6,830 publications (79.33%)
followed by Review with 1236 publications (14.36%). Conference papers ranks the third
position with 306 publications (3.55%), Editorial material with 94 publications (1.09%) and
remaining forms are less than one percentage as seen in the table. The results indicate that the
research outputs on green technology of the period covered by the study are mostly published
in the form of journal articles.
9.2 Growth of publications
Relative Growth Rate (RGR) and Doubling Time
The Relative Growth Rate (RGR) is the increase in number of articles or pages per
unit of time. This definition derived from the definition of relative growth rates in the study
of growth analysis in the field of green technology. The mean relative growth rate (R) over
the specific period of interval can be calculated from the following equation.
Relative Growth Rate (RGR)
1 – 2 R=Log W2 – Log W1/ T2-T1
Whereas
Loge W1 - log of initial number of articles
Loge W2 - log of final number of articles after a specific period of interval
T2-T1- the unit difference between the initial time and the final time
The year can be taken here as the unit of time.
[image:8.595.83.514.230.407.2]Doubling Time (DT) = 0.693/R
Table 2 Relative growth rate (RGR) and Doubling time (DT) of publications
Year
No. of Publications
Cumulative
Total W1 W2 RGR DT
2006 381 381 - 5.94 - -
2007 473 854 5.94 6.75 0.81 0.86
2008 555 1409 6.75 7.25 0.50 1.39
2009 641 2050 7.25 7.63 0.38 1.82
2010 736 2786 7.63 7.93 0.30 2.31
2011 866 3652 7.93 8.20 0.27 2.57
2012 1001 4653 8.20 8.45 0.25 2.77
2013 1153 5806 8.45 8.67 0.22 3.15
2014 1292 7098 8.67 8.87 0.20 3.47
2015 1512 8610 8.87 9.06 0.19 3.65
During 2006-2015, a total of 8610 publications were published on green technology
research by various countries. The average number of publications were produced per year
was 861. The highest numbers of publications (1512) were published in 2015.
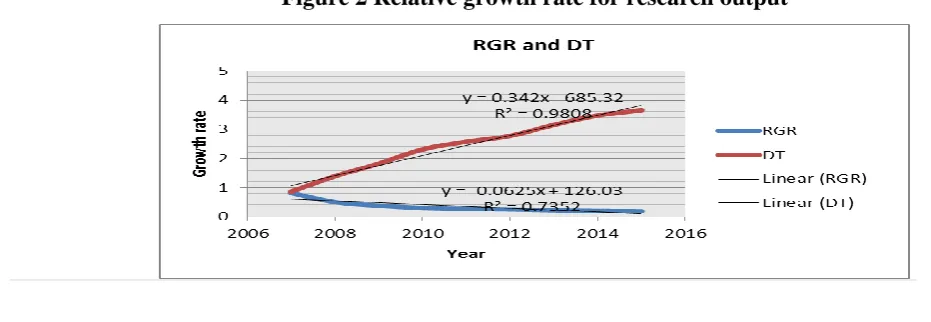
The year wise RGR is found to be in the range of 0.81 to 0.19. It has been observed
from Table 2 and figure 2 that RGR is downward trend from 2007 (0.81) to 2015 (0.19). The
doubling time (DT) was upward trend from 2007 (0.86) to 2015 (3.65).
[image:8.595.66.532.601.762.2]9.3 Most prolific authors
Table 3 Identification of most prolific authors
Rank Author No. of publications Percentage
1 Zhang Y 39 0.45
2 Liu Y 31 0.36
3 Wang L 28 0.33
4 Wang J 25 0.29
5 Zhang J 22 0.26
6 Wang Y 21 0.24
7 Zhang L 21 0.24
8 Anonymous 19 0.22
8 Chen L 19 0.22
10 Hoffman R M 19 0.22
11 Clark J H 18 0.21
12 Kumar A 18 0.21
13 Kim H 17 0.20
14 Li Y 17 0.20
15 Li J 16 0.19
16 Li L 16 0.19
17 Li X 15 0.17
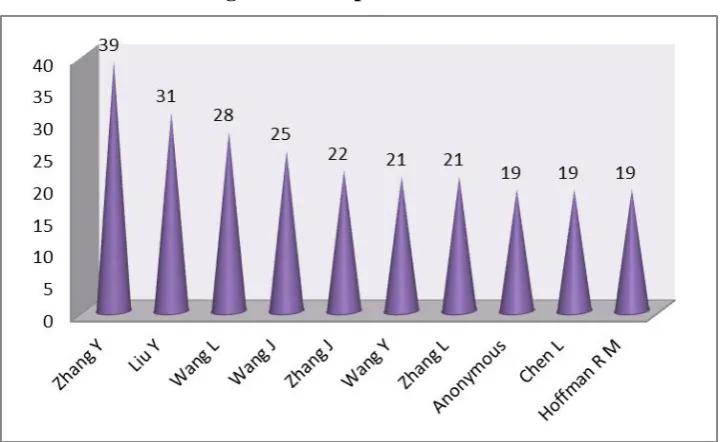
Zhang, Y is the most productive author with 39 (0.45%) publications followed by Liu, Y
with 31 (0.36%) publications, Wang, L with 28 (0.33%) publications, Wang, J with 25
(0.29%) publications, Zhang, J with 22 (0.20%) publications, Wang, Y with 21 (0.24%)
publications, Zhang, L with 42 (0.18%) publications and Anonymous with 19 (0.22%)
publications respectively. And a total of 28,528 authors are contributed entire research output
of the period under study. Table 3 provides the most prolific authors who have contributed 15
Figure 3 Most prolific authors
[image:10.595.69.520.333.636.2]9.4 Highly productive institutions
Table 4 Highly productive institutions
Rank Institutions Country No. of
Publications
1 Chinese Academy of Science China 182 (2.11%)
2 Zhejiang University China 60 (0.70%)
3 Consejo Superior de Investigaciones Científicas
(CSIC)
Spain 51 (0.59%)
4 Harvard University USA 50 (0.58%)
5 Tsinghua University China 47 (0.55%)
6 University of Tokyo Japan 46 (0.53%)
7 National University of Singapore Singapore 45 (0.52%)
8 University of Florida USA 43 (0.50%)
9 University of Maryland USA 42 (0.49%)
10 University of Toronto Canada 42 (0.49%)
11 University of California, Berkeley USA 41 (0.48%)
In all there were 6524 institutions involved in research activity on green technology.
Table 4 presents the top 11 institutes that have contributed 40 or more publications on during
2006-2015. Chinese Academy of Science, China topped the list with 182 publications
Investigaciones Científicas (CSIC), Spain with 51 publications, Harvard University, USA
with 50 publications, Tsinghua University, China with 47 publications, University of Tokyo,
Japan with 46 publications, National University of Singapore, Singapore with 45
publications and University of Florida, USA with 43 publications.
[image:11.595.96.504.201.499.2]9.5 Geographical distributions of research output
Table 5 Geographical distribution of publications
Rank Country Total
Publications
(%)
Rank Country Total
Publications
(%)
1 USA 2116 (24.58%) 12 Australia 257 (2.99%)
2 China 1336 (15.52%) 13 Taiwan 242 (2.81%)
3 England 546 (6.34%) 14 Netherlands 226 (2.63%)
4 India 508 (5.90%) 15 Brazil 188 (2.18%)
5 Germany 496 (5.76%) 16 Malaysia 174 (2.02%)
6 Japan 426 (4.95%) 17 Iran 170 (1.97%)
7 Canada 397 (4.61%) 18 Sweden 155 (1.80%)
8 Italy 397 (4.61%) 19 Belgium 132 (1.53%)
9 Spain 335 (3.89%) 20 Poland 126 (1.46%)
10 Korea 320 (3.72%) 21 Switzerland 118 (1.37%)
11 France 303 (3.52%) 22 Denmark 100 (1.16%)
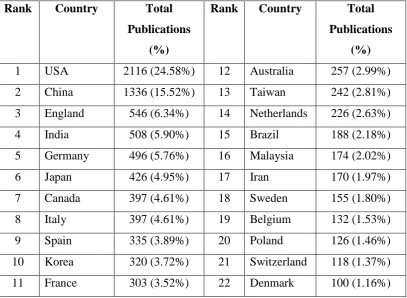
There were as many as 104 countries involved in carrying out research in the field of
green technology and produced 8610 publications. Table 5 list of countries whose share in
the research output is more than 1% of the total output. USA topped the list among all the
countries with 2116 publications followed by China with 1336 publications, England with
546 publications, India with 508 publications, Germany with 496 publications, Japan with
426 publications, Canada with 397 publications, Italy with 397 publications, Spain with 335
publications, Korea with 320 publications, France with 303 publications and the remaining
countries are publishing less than 3% of the research output in this study period. However,
USA and China together accounts for 40% of world green technology research publications.
Figure 4 Highly productive countries
9.6 Language wise distributions
Table 6 Language wise distribution of publications
Rank Language No. of Publications
1 English 8367 (97.18%)
2 Chinese 86 (1.00%)
3 Portuguese 36 (0.42%)
4 German 28 (0.33%)
5 Spanish 25 (0.29%)
6 Polish 17 (0.20%)
7 Japanese 12 (0.14%)
8 French 10 (0.12%)
9 Russian 7 (0.08%)
10 Croatian 4 (0.05%)
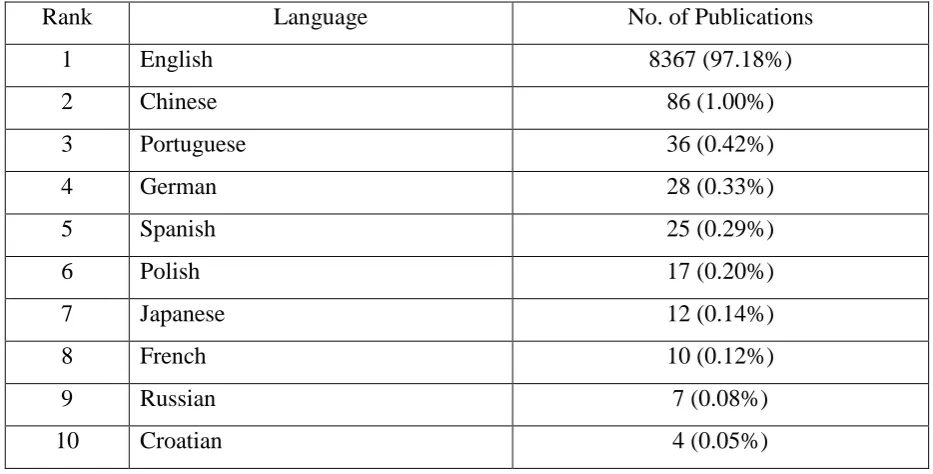
Publications on green technology are spread over 20 languages. The study reveals that
the maximum number of publications have been published in English language with 8367
(97.18%) publications, followed by Chinese language with 86 (1%) publications, Portuguese
language ranks third position with 36 (0.42%) publications, German language with 28
(0.33%) publications, Spanish language with 25 (0.29%) publications, Polish language with
[image:12.595.64.531.342.579.2]predominant language used for communication was English in every year in total
productivity on the subject during the study period.
9.7 Most preferred source titles
Table 7 Source Title of Publications
Rank Source Title No. of
Publications
Percentage Impact
Factor
1 Renewable sustainable energy reviews 158 1.84 6.798
2 Energy policy 121 1.41 2.696
3 Journal of cleaner production 101 1.17 4.959
4 PLOS One 73 0.85 3.234
5 Green chemistry 70 0.81 8.02
6 RSC advances 54 0.63 3.289
7 Journal of green building 52 0.60 0.90
8 Bioresource technology 44 0.51 4.494
9 LWT food science and technology 43 0.50 2.292
10 Applied energy 41 0.48 5.746
Table 7 provides the leading journals each with number of publications and impact
factor. The scientific literature on green technology is spread over 2882 different web of
science source journals. It reveals that Renewable sustainable energy reviews the list with the
highest number of publications 158 (1.84%) and the impact factor is 6.80, followed by
Energy policy with a share of 121 (1.41%) publications and the impact factor is 2.70. Journal
of cleaner production occupies the third position with 101 (1.17%) publications and the
impact factor is 4.96. The fourth highest source title is PLOS One with 73 (0.85%)
publications and the impact factor is 3.23, Green chemistry with 70 (0.81%) publications and
the impact factor is 8.02 and RSC advances with 54 (0.63%) publications and the impact
9.8 High productivity subject areas
Table 8 High productivity subject areas
Rank Subject No. of Articles Percentage
1 Engineering 1866 21.67
2 Chemistry 1414 16.42
3 Environmental sciences ecology 1079 12.53
4 Science technology 1071 12.44
5 Materials science 829 9.63
6 Energy fuels 809 9.40
7 Biotechnology applied
microbiology
555 6.45
8 Physics 519 6.03
9 Biochemistry molecular biology 505 5.87
10 Agriculture 502 5.83
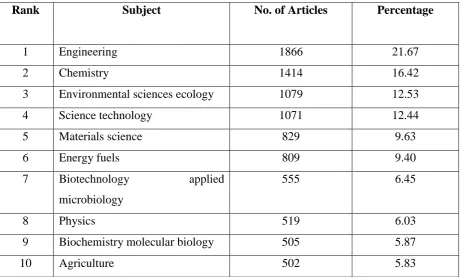
The scientific literature on green technology is spread over 90 different subjects.
Table 8 shows high productivity subjects which are contributing more than 500 articles. It is
found that Engineering has highest number of articles with 1866 (21.67%) followed by
Chemistry contributing 1414 (16.42%) articles. Environmental sciences ecology occupies the
third position with 1079 (12.53%) articles. The fourth highest articles belonged to the subject
Science technology with 1071 (12.44%), Materials science with 829 (9.63%) and Energy
fuels with 809 (9.40%) articles respectively.
10. Conclusions
The present study attempted to highlight the growth and development of research
publication on green technology. A total of 8610 publications were published during
2006-2015 and the average number of publication per year was 861. There was a steady growth of
publication during the study period. USA topped the list with highest share (33.89%) of
publications followed by China with 12.59% share of publications, England with 10.21%
share of publications and Germany with 9.14% share of publications. Chinese Academy of
Science, China topped the list with 1298 (5.56%) publications followed by National Oceanic
Atmospheric Research, USA with 350 (1.50%) publications, and Columbia University, USA
with 337 (1.44%) publications. The most prolific authors, high productive subjects and also
the most preferred journals with impact factor which they publish have also been identified.
The single most prevalent type of publications is the journal article, in which 79.33% of the
total publication is published. This shows that green technology scientists preferred medium
of communications is journal article. A large number of researchers are pursuing their
research in the field of green technology, giving hope that more publications would be
published on the subject from all over the world in upcoming years.
References
1. Gupta B M and AdarshBala (2013). Epilepsy Research in India: A Scientometric
Analysis of Publications Output during 2002-11. Annals of Neurosciences, 20(2). 2. Mini Devi and Lekshmi (2014). Scientometric Assessment of Publication Productivity
of JNTBGRI, Thiruvananthapuram. DESIDOC Journal of Library & Information Technology, 34(2): 147-151.
3. Kumar, K (2014). A Scientometric Study of Digital Literacy in Online Library
Information Science and Technology Abstracts (LISTA). Library Philosophy and Practice (e-journal), Paper 1044.
4. Gupta, B M et al. (2013). "S&T Publications Output of India: A Scientometric
Analyses of Publications Output, 1996-2011". Library Philosophy and Practice (e-journal), Paper 921.
5. Mu-Hsuan Huang and Hsiao-Wen Yang (2013). A Scientometric Study of Fuel Cell
Based on Paper and Patent Analysis. Journal of Library and Information Studies, 11 (2): 1-24.
6. Santhanakarthikeyan S et al (2013). Scientometrics Study on Web: Tools and
Techniques. International Journal of Educational Research and Technology, 4 (1): 40-45.
7. ShadiAsadzandi et al (2013). A Scientometric study of media literacy literature based
on Scopus record through 2011. Journal of Paramedical Sciences (JPS), 4 (1): 49-55. 8. Kalaiappan, V et al. (2010). Scientometric Analysis of Literature Output of Prof. G.N.
9. Kanagavel P et al. (2013). Scientometric Analysis of Wind Power Research in India:
A Case Study. Global Research Analysis, 2 (6): 109 -111.
10. Satish Kumar H T et al. (2012). A Scientometric portrait of SwaranJeet Singh (SJS)
flora. International Journal of Library and Information Science, 4(2):24-33.
11. Sujit Bhattacharya and Shilpa (2011). Mapping Nanotechnology Research and
Innovation in India. DESIDOC Journal of Library and Information Technology, 31(5): 349-35.
12. Gupta B M and AdarshBala (2011). Indian S&T during Fifteen Years (1996-2010): A
Author(s) Biography
Dr. V. kalaiappan is presently working as Marina Campus Librarian at
University of Madras. he obtained Doctoral Degree from University of Madras
Depart of LIS, M.A (Economics) Kamaraj College Tuticorin, B.L.I.Sc from
Department of LIS Madurai Kamaraj University, M.L.I.S Annamalai
university,U.G.C NET (1999), M.Phil from Alagappa University, Karaikudi.
He had published 3 research articles with impact factor 3 National Coferance
papers and 1 International conference paper. He had served a Librarian of
P.S.G.Institute of Medical Science and Kendriya Vidyala.
Dr. R. Santha kumar is presently working as Young Professional II in
ICAR-Central Institute of Brackishwater Aquaculture, Chennai. He obtained Ph.D from
M.S University, Tirunelveli, M.Sc (Physics) from Alagappa University,
Karaikudi, and MLIS, M.Phil and PGDCA from Madurai Kamaraj University.
He has published 21 articles in national and international journals and presented
16 articles both in national and international conferences.