PageRank and user preference algorithms for assessing the relative performance of track athletes in competition. PLoS ONE, 12 (6). ISSN 1932-6203 DOI: https://doi.org/10.1371/journal.pone.0178458
Link to Leeds Beckett Repository record:
http://eprints.leedsbeckett.ac.uk/3793/
Document Version: Article
Creative Commons: Attribution 4.0
The aim of the Leeds Beckett Repository is to provide open access to our research, as required by funder policies and permitted by publishers and copyright law.
The Leeds Beckett repository holds a wide range of publications, each of which has been checked for copyright and the relevant embargo period has been applied by the Research Services team.
We operate on a standard take-down policy. If you are the author or publisher of an output and you would like it removed from the repository, please contact us and we will investigate on a case-by-case basis.
A novel application of PageRank and user
preference algorithms for assessing the
relative performance of track athletes in
competition
Clive B. Beggs1*, Simon J. Shepherd2, Stacey Emmonds1, Ben Jones1
1 Institute for Sport, Physical Activity and Leisure, Carnegie Faculty, Leeds Beckett University, Leeds, West
Yorkshire, United Kingdom, 2 Medical Biophysics Laboratory, University of Bradford, Bradford, United Kingdom
Abstract
Ranking enables coaches, sporting authorities, and pundits to determine the relative perfor-mance of individual athletes and teams in comparison to their peers. While ranking is rela-tively straightforward in sports that employ traditional leagues, it is more difficult in sports where competition is fragmented (e.g. athletics, boxing, etc.), with not all competitors com-peting against each other. In such situations, complex points systems are often employed to rank athletes. However, these systems have the inherent weakness that they frequently rely on subjective assessments in order to gauge the calibre of the competitors involved. Here we show how two Internet derived algorithms, the PageRank (PR) and user preference (UP) algorithms, when utilised with a simple ‘who beat who’ matrix, can be used to accu-rately rank track athletes, avoiding the need for subjective assessment. We applied the PR and UP algorithms to the 2015 IAAF Diamond League men’s 100m competition and com-pared their performance with the Keener, Colley and Massey ranking algorithms. The top five places computed by the PR and UP algorithms, and the Diamond League ‘2016’ points system were all identical, with the Kendall’s tau distance between the PR standings and ‘2016’ points system standings being just 15, indicating that only 5.9% of pairs differed in their order between these two lists. By comparison, the UP and ‘2016’ standings displayed a less strong relationship, with a tau distance of 95, indicating that 37.6% of the pairs differed in their order. When compared with the standings produced using the Keener, Colley and Massey algorithms, the PR standings appeared to be closest to the Keener standings (tau distance = 67, 26.5% pair order disagreement), whereas the UP standings were more simi-lar to the Colley and Massey standings, with the tau distances between these ranking lists being only 48 (19.0% pair order disagreement) and 59 (23.3% pair order disagreement) respectively. In particular, the UP algorithm ranked ‘one-off’ victors more highly than the PR algorithm, suggesting that the UP algorithm captures alternative characteristics to the PR algorithm, which may more suitable for predicting future performance in say knockout tour-naments, rather than for use in competitions such as the Diamond League. As such, these Internet derived algorithms appear to have considerable potential for objectively assessing
a1111111111 a1111111111 a1111111111 a1111111111 a1111111111
OPEN ACCESS
Citation: Beggs CB, Shepherd SJ, Emmonds S, Jones B (2017) A novel application of PageRank and user preference algorithms for assessing the relative performance of track athletes in competition. PLoS ONE 12(6): e0178458.https:// doi.org/10.1371/journal.pone.0178458
Editor: Wei-Xing Zhou, East China University of Science and Technology, CHINA
Received: December 9, 2016 Accepted: May 12, 2017 Published: June 2, 2017
Copyright:©2017 Beggs et al. This is an open access article distributed under the terms of the
Creative Commons Attribution License, which permits unrestricted use, distribution, and reproduction in any medium, provided the original author and source are credited.
Data Availability Statement: The study data is presented in its entirety in the manuscript. It involves the results of ten sprint races.
Funding: The authors received no specific funding for this work.
the relative performance of track athletes, without the need for complicated points equiva-lence tables. Importantly, because both algorithms utilise a ‘who beat who’ model, they auto-matically adjust for the strength of the competition, thus avoiding the need for subjective decision making.
Introduction
Ranking is an important task that enables coaches, applied scientists, sporting authorities, and pundits to determine the relative performance of individual athletes and teams in comparison to their peers or competitors. Ranking within talent identification, can also provide an objec-tive assessment of the performance of young athletes relaobjec-tive to their peers, something that can be helpful when making important decisions about career progression [1,2]. While ranking is a relatively straightforward task in sports that employ traditional leagues in which all the teams play each other (e.g. soccer and rugby), it is more difficult in sports that involve knock-out tournaments (e.g. tennis, international soccer) or are event based (e.g. athletics). With these, not all the athletes or teams play each other and as a result competition can become frag-mented, making it difficult to assess performance relative to competitors. The situation is com-pounded by the fact that in many sports (e.g. athletics, tennis, golf) not all the athletes compete in every competition. Consequently, we can have the paradoxical situation where an athlete may appear to be performing well, having achieved several wins against low ranking opposi-tion, while a much better athlete, who has entered just a few competitions, is ranked far below them despite having only narrowly lost to opponents of the highest calibre. As such, this may lead to a ‘false positive’ identification (i.e. the identification of an athlete who is not as good as their ranking suggests) or a ‘false negative’ (i.e. failure to identify an athlete who may be better than their ranking suggests), both situations that are undesirable. In situations where assessing the relative performance of competitors is difficult, developing a robust ranking system that accurately reflects the true performance of the respective athletes or teams represents a consid-erable mathematical challenge. If a ranking system is too simplistic, then it will fail to capture the complexities of the system and will struggle to reflect the true performance of the athletes concerned, something that may cause it to become discredited. Aware of this, many sporting authorities employ complex points based systems [3], which attempt to mirror the complexi-ties associated with the competition structure. While these systems aim to be objective, they inevitably involve a degree of subjectivity when it comes to allocating the number of points to particular tournaments, with the result that the overall ranking process can be somewhat arbi-trary. However, in recent years advances in computer science have yielded techniques, such as the Google PageRank (PR) algorithm, that have the potential to overcome this problem and make ranking a more objective process.
Accurate ranking of teams and athletes is something that poses a considerable challenge for many sporting authorities, and there is no clear consensus regarding the best approach that should be taken. In most sports, ranking is based on the accumulation of points awarded for performance during matches or tournaments. Leagues, such as those found in soccer and rugby, represent a classic example of this, with all the teams playing each other over the course of a season and the number of points accumulated indicating the respective standings. How-ever, even within a league system such as this, the points system used can still vary between sports. For example: rugby league award two points for a win, one point for a draw and zero points for a loss [4]; soccer award three points for a win, one point for a draw and zero points
for a loss [5]; while rugby union award two points for a win, one point for a draw and zero points for a loss, with the addition of a ‘bonus’ point system [6]. Golf and tennis, although not league based, also employ a points system. However, unlike the relatively simple points system employed in the leagues associated with the aforementioned sports, golf and tennis employ complex models which calculate the number of points accumulated in a rolling period. In golf [7] and tennis [8] the points awarded for the various competitions will tend to vary depending on the prestige of the event and the perceived strength of the competitors involved. Prestigious international tournaments will naturally yield more points in comparison to smaller local events. In athletics the International Association of Athletics Federations (IAAF) also employs a complex points system, which takes into account the measured result of athletes and their placings, together with the prestige and quality of the event in which they are competing. The process is complex and relies on published tables (e.g. Ref: IAAF Scoring Tables of Athletics [3]) to compute the respective points scored. While these point based systems are generally able to differentiate high performers from those who are more mediocre, they tend to be over-complex, difficult to understand, and can be somewhat arbitrary in their points allocation. As such, they are a relatively ‘blunt instrument’ and are therefore of only limited value to coaches seeking to assess the true performance of both developing and high-performance athletes.
represented a closed system with well-defined outcomes; and (ii) the competition exhibited considerable asymmetry, with some athletes (e.g. Mike Rogers, Nesta Carter) competing many times, while others (e.g. Marvin Bracy, Usain Bolt) ran only once. As such, the system posed considerable challenges from a ranking standpoint, making it an ideal context with which to evaluate the PR algorithm. In addition, we adapted an Internet retail user preference (UP) algorithm [18], which we also used to rank the athletes. UP algorithms have some attributes that are well suited to sporting events where many individuals compete at the same time, and so we were interested to know if they could be adapted to successfully rank track athletes.
In order to assess the performance of the Internet derived algorithms, we also used three well-known sports ranking systems, the Colley [19], Massey [20] and Keener [21] algorithms, which we used for comparative purposes. These algorithms were originally developed for use in team sports where matches consist of two teams playing each other. We therefore had to adapt these algorithms so that they could be applied to track athletics.
Method
The paper reports on a project that involved analysis of publicly available secondary data. Ethical approval for the project was granted by the Research Ethics Board of Leeds Beckett University.
A. Data
Public domain data from IAAF Diamond League website [22] were collated for the ten Dia-mond League events (i.e. Doha, Eugene, Rome, Birmingham, New York, Paris, Lausanne, Monaco, London and Bruxelles) that included a male 100m race during the 2015 season. For each event, only the results of the A race were utilised, with the times and placings compiled into a single dataset (Table 1). The data were evaluated using firstly the PR algorithm, and then a UP algorithm, developed for Internet shopping [18], which we adapted to evaluate the track events. We also used adapted versions of the Colley, Massey and Keener algorithms to assess the data. All the algorithms were executed using bespoke ‘in-house’ programs written in Matlab (version R2016b; Mathworks, Natick, USA) and ‘R’ (version 3.3.3; open source statisti-cal software).
B. PageRank algorithm
The PR algorithm was developed by Larry Page and Sergey Brin, the founders of the company Google, to rank web pages on the Internet [9]. The algorithm utilises graph theory, in so much that it relies on a directed adjacency matrix,A, which describes the relationships between web pages. In the graph described by the adjacency matrix, the web pages are nodes and the links between the web pages are the directed edges. The number of links leaving from any given node is called the ‘out-degree’ of that node [12]. These can be viewed as ‘votes’ cast by that web page in favour of other web pages. With the PR algorithm, the rank of any given web page is dependent on how many other pages ‘vote’ for it (i.e. are linked to it), and the rank of these other pages. A web page is considered important if it is pointed to by other web pages of importance.
Table 1. The results of the ten male 100m races listed on the IAAF Diamond League web site.
Doha Eugene* Rome Birmingham New York Paris Lausanne* Monaco London* Bruxelles 15thMay 30thMay 4thJune 7thJune 13thJune 4thJuly 9thJuly 17thJuly 24thJuly 11thSept
Name Position [Time (s)]
Position [Time (s)]
Position [Time (s)]
Position [Time (s)]
Position [Time (s)]
Position [Time (s)]
Position [Time (s)]
Position [Time (s)]
Position [Time (s)]
Position [Time (s)]
Harry Adams na na 9 [10.24] na na na na na na na
Nickel Ashmeade
na na na na 6 [10.28] na na 6 [10.11] na na
Guy-Elphege Anouman
na na na na na 9 [10.32] na na na na
Kemar Bailey-Cole
na na na na na na na na 3 [9.92] na
Deondre Batson
7 [10.10] na 6 [10.08] na 5 [10.24] na na na na na
Emmanuel Biron
na na na na na 8 [10.18] na 7 [10.17] na na
Keston Bledman
3 [10.01] na na na 2 [10.13] na 5 [10.03] 5 [10.10] na na
Usain Bolt na na na na na na na na 1 [9.87] na
Marvin Bracy na na na 1 [9.93] na na na na na na
Nesta Carter 6 [10.07] 5 [10.02] 4 [10.06] 4 [10.00] 3 [10.15] 4 [10.02] na na 7 [10.08] na
Kim Collins 4 [10.03] 4 [9.99] 5 [10.07] na na 5 [10.05] 6 [10.08] na 8 [10.09] na
James Dasaolu
8 [10.14] 6 [10.13] na na na na na na 9 [10.19] na
Andrew Fisher
na na 8 [10.14] na na na na na na na
Julian Forte na na na 7 [10.15] na na na na na na
Justin Gatlin 1[9.74] na 1 [9.75] na na na 1 [9.75] 1 [9.78] na 1 [9.98]
Tyson Gay na 1 [9.88] na na 1 [10.12] na 3 [9.92] 2 [9.97] na na
Adam Gemili na na na 2 [9.97] na na na na na na
Ramon Gittens
na na na na na na na na na 6 [10.11]
Richard Kilty na na na 5 [10.05] na na na na na na
Trell Kimmons
na na na na 7 [10.40] na na na 6 [10.07] na
Churandy Martina
na na na na na 7 [10.12] na na na na
Joseph Morris
na na na na 8 [10.45] na na na na na
Femi Ogunode
5 [10.04] na na na na na na na na 2 [9.98]
Asafa Powell na na na na na 1 [9.81] 2 [9.92] na na 5 [10.04]
Mike Rodgers
2 [9.96] 2 [9.90] 3 [9.98] 3 [9.97] na 3 [9.99] 4 [10.03] na 2 [9.90] 4 [10.02]
Akani Simbine
na na 6 [10.08] na 4 [10.18] na na na na 7 [10.18]
Bingtian Su na 3 [9.99] na na na na na na na na
Richard Thompson
na 7 [10.27] na na na na na na na na
Chijindu Ujah na na na 6 [10.11] na na na 4 [10.08] 4 [9.96] 8 [10.19]
Clayton Vaughn
na na na na na 6 [10.08] na na 5 [9.98] na
Jimmy Vicaut na na 2 [9.98] na na 2 [9.86] na 3 [10.03] na 3 [9.99]
Justin Walker na 8 [10.28] na na na na na na na na
of a web page,P, after k+1 iterations is:
rkþ1ðPÞ ¼
X
Q2Bp rðQÞ
jQj ð1Þ
where,r(P)is the rank of the web page,P;Bpis the set of all the web pages pointing toP; and
|Q|is the out-degree of a web pageQ[12]. In order to complete the iterative procedure it is necessary to initialise the system by setting the initial ranks ofPandQto 1/n, wherenis the number of web pages in the network.
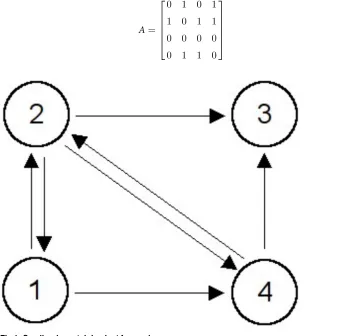
In order to explain the matrix algebra required to solve the PR problem, we consider the small web shown inFig 1. In the adjacency matrix,A, summarising the graph structure of this web, if an edge (i.e. link) exists from nodePito nodePj, then 1 is inserted in the matrix,
other-wise 0 is inserted. The resulting adjacency matrix,A, is:
A¼
0 1 0 1
1 0 1 1
0 0 0 0
0 1 1 0
2
6 6 6 6 4
3
7 7 7 7
5 ð2Þ
Table 1. (Continued)
[image:7.612.200.555.373.709.2]Doha Eugene* Rome Birmingham New York Paris Lausanne* Monaco London* Bruxelles 15thMay 30thMay 4thJune 7thJune 13thJune 4thJuly 9thJuly 17thJuly 24thJuly 11thSept Name Position
[Time (s)]
Position [Time (s)]
Position [Time (s)]
Position [Time (s)]
Position [Time (s)]
Position [Time (s)]
Position [Time (s)]
Position [Time (s)]
Position [Time (s)]
Position [Time (s)]
Isiah Young na na na na na na 7 [10.11] na na na
*Races not included in the official 2015 IAAF Diamond League standings.
https://doi.org/10.1371/journal.pone.0178458.t001
Fig 1. Small web containing just four web pages.
MatrixAis then divided by the number of out-degrees per page to produce the hyperlink matrix,H.
H¼ 0 1 2 0 1 2 1 3 0 1 3 1 3
0 0 0 0
0 1 2 1 2 0 2 6 6 6 6 6 6 6 6 4 3 7 7 7 7 7 7 7 7 5
ð3Þ
Because the PR model requires a stochastic matrix in which all the row sums are equal to 1, it is necessary to adjust any rows containing all zeros (i.e. rows relating to nodes with no out-degrees). This is done by replacing any zero rows in H with 1/n to produce the stochastic matrix,S.
S¼ 0 1 2 0 1 2 1 3 0 1 3 1 3 1 4 1 4 1 4 1 4 0 1 2 1 2 0 2 6 6 6 6 6 6 6 6 6 6 6 4 3 7 7 7 7 7 7 7 7 7 7 7 5
ð4Þ
Finally, in order to ensure that the graph is strongly inter-connected and irreducible, the stochastic matrix,S, is modified usingEq (5)to produce the Google matrix,G.
G¼aSþ ð1 aÞE ð5Þ
Where,αis a damping factor, usually set at 0.85; andEis a [n×n] matrix populated entirely with the value 1/n.
G¼
0:0375 0:4625 0:0375 0:4625
0:3208 0:0375 0:3208 0:3208
0:2500 0:2500 0:2500 0:2500
0:0375 0:4625 0:4625 0:0375 2 6 6 6 6 4 3 7 7 7 7
5 ð6Þ
The vector containing the final PR scores,q, is then computed using the power method shown inEq (7).
q¼z0G
k ð7Þ
Where,qis a [1×n] vector containing the PR scores;z0is a [1×n] vector containing the initial
estimated PR scores, generally populated entirely with the value 1/n; andkis the number of iterations necessary to reach convergence.
For the small web inFig 1, after convergence the PR vector, q, is:
q¼ ½0:1782 0:2819 0:2861 0:2539 ð8Þ
C. Application of the PageRank algorithm
In order to apply the PR algorithm to the Diamond League event, we constructed a [33×33] adjacency matrix for all the competing athletes, which we updated after every race. For each race, any athlete who beat another received a ‘vote’ of 1 from the beaten athlete. So in a race comprising eight athletes, the winner would receive seven ‘votes’ from the other athletes, while the athletes who came second and third would receive six and five ‘votes’ respectively. This pat-tern would continue to the second to last athlete, who would receive one ‘vote’ from the last athlete, who would of course receive no ‘votes’. Where two athletes tied for a position, they were each considered to have voted for each other. After every race, the adjacency matrix was updated with the new ‘votes’ added to the existing ‘votes’ from the previous races. As such, the adjacency matrix maintained a precise updated summary of ‘who beat who’.
The updated adjacency matrices were analysed using an ‘in-house’ PR algorithm, which was used to generate vectors containing the PR scores, together with network graphs showing the connectivity between the athletes. In keeping with previous work [23], when computing the PR scores, we set the damping factor,α, to 0.85.
D. User preference algorithm
Internet based retailers frequently rely on a ‘five star’ rating system to assess user preferences. This performs two functions; firstly it enables users to rate particular products; and secondly it allows similar products to be ranked so that retailers can compare their ‘performance’. This can be done by compiling a skew-symmetric weighted adjacency matrix from UP data, as described by Langville and Meyer [18]. Once this matrix is defined, the product ratings can easily be assessed using:
b¼Ke
n ð9Þ
where,nis the number of products being assessed;bis a [n×1] vector containing the UP ranks for the various products;Kis a [n×n] skew-symmetric adjacency matrix; andeis a [n×1] vector populated entirely with ones.
In order to explain the methodology associated with a typical user preference rating system, we consider the example below, in which six users (u1. . .u6) rate four films (f1. . .f4) to
pro-duce a UP matrix,U, in which the rows denote the users and the columns denote the films. From this we can see that userU5, for example, has given filmf1a rating of five stars (the
high-est rating score) and a rating of three stars to filmf4.
U¼
4 2 3
1 3 2
5 2
4 5 1
5 3
2 2
2
6 6 6 6 6 6 6 6 6 6 4
3
7 7 7 7 7 7 7 7 7 7 5
ð10Þ
The graph associated with matrix,U, is shown inFig 2. From this the paired [n×n] matrixK
between the respective films and the signs representing the direction of these differences.
K¼
0 1
2 1 2
2 3 1
2 0
4 1
2 2 1
2 4
1 0
1 2 2
3 2 2
1
2 0
2
6 6 6 6 6 6 6 6 6 6 6 4
3
7 7 7 7 7 7 7 7 7 7 7 5
ð11Þ
Once matrix,K, is formulated then the rating vector,b, can be derived usingEq (9), as fol-lows:
b¼Ke
4 ¼
0:4167
1:1250
1:0000
0:5417 2
6 6 6 6 4
3
7 7 7 7 5
ð12Þ
From b it can be seen that filmf2is ranked first, followed byf1,f4,and lastly f3.
E. Application of the user preference algorithm
[image:10.612.202.500.80.344.2]In order to apply the UP algorithm to the Diamond League event, we constructed a [10×33] UP matrix in which the races represented the individual ‘user evaluations’. Because the races
Fig 2. Graph for user preference rating example. The nodes represent the films and the edges represent
the user ratings, with edge scores representing the numerical difference between the user ratings for the two nodes.
contained varying numbers of contestants (i.e. some races comprised nine runners, while oth-ers had only seven), we decided to use a revoth-erse scoring system, in which the athletes who came first, second and third received one, two and three ‘stars’ respectively, with the number of ‘stars’ incrementally increasing for the lower finishing places. In this way, the number of athletes competing in any given race had minimal impact on the overall rankings, because the winner would always received one ‘star’, with the second athlete always receiving two ‘stars’, and so on. The rankings were derived for the individual athletes using the methodology described above. Because we used a reverse scoring system, the final ranking vector, b, was multiplied by –1 in order to make the ranking scores positive for the leading athletes.
F. Keener algorithm
In 1993, James Keener proposed a ranking method that utilized a non-negative matrix con-structed using the results of games between competing teams [21]. Although metrics such as win ratio can be used to construct Keener’s matrix,X, it is generally more common to use the number of points or goals that teamiscored against teamj[18]. Indeed, Keener suggested using a score ratio that satisfies Laplace’s rule of succession as follows:
aij¼
Sijþ1
SijþSjiþ2
ð13Þ
where, aijis the value of the statistic produced when teamicompetes against teamj;Sijis the
number of points teamiscores against teamj; andSjiis the number of points teamjscores
against teami.
Since the Keener method utilises game scores to compute ratings, it can be susceptible to bias when teams accumulate high scores. In order to compensate for this Keener suggested applying the non-linear skewing function:
hðxÞ ¼0:5þ0:5 sgnðx 0:5Þ pffiffiffiffiffiffiffiffiffiffiffiffiffiffiffiffij2x 1j
ð14Þ
to each computed value,aij, to generate a non-negative matrix that is irreducible provided
that enough games have been played between the teams. By exploiting the Perron-Frobenius theorem [24] and usingEq (15), Keener was able to compute the Perron vector, (i.e. a unique vector derived from the eigenvector corresponding to the largest eigenvalue of the Keener matrix), which contains the positive ratings of all the teams involved in any given competition [18].
Xrk¼lrk ð15Þ
where,Xis the Keener matrix;rkis the Perron rating vector; andλis the proportionality
constant.
which the rows denote the goals scored by the respective teams and the columns denote goals conceded.
L¼
0 0 0 1 2 2
0 0 3 5 0 0
0 4 0 0 0 1
0 1 0 0 1 0
0 0 0 0 0 1
3 0 0 0 4 0
2 6 6 6 6 6 6 6 6 6 6 4 3 7 7 7 7 7 7 7 7 7 7 5
ð16Þ
By applying Eqs (13) and (14) to the elements in matrix,L, and adding a small perturbation to ensure irreducibility, it is possible to compute the Keener matrix,X.
X¼
0:000 0:000 0:000 0:789 0:854 0:311
0:000 0:000 0:333 0:854 0:000 0:000
0:000 0:667 0:000 0:000 0:000 0:789
0:211 0:147 0:000 0:000 0:789 0:000
0:147 0:000 0:000 0:211 0:000 0:173
0:689 0:000 0:211 0:000 0:827 0:000 2 6 6 6 6 6 6 6 6 6 6 4 3 7 7 7 7 7 7 7 7 7 7 5
ð17Þ
Finally, by solvingEq (15), the Perron rating vector,rk, can be computed, which indicates
that the algorithm ranks the teams in the following order: Liverpool, Tottenham, Arsenal, Chelsea, Stoke and Swansea.
rk¼
0:195
0:153
0:242
0:110
0:079
0:220 2 6 6 6 6 6 6 6 6 6 6 4 3 7 7 7 7 7 7 7 7 7 7 5
[image:12.612.199.578.88.214.2]ð18Þ
Table 2. The results of matches in the mini- soccer league.
Match Score
Arsenal v Swansea 2–0
Chelsea v Stoke 5–1
Liverpool v Tottenham 1–0
Swansea v Tottenham 1–4
Chelsea v Liverpool 2–1
Stoke v Arsenal 0–1
Liverpool v Chelsea 3–1
Arsenal v Tottenham 2–3
Stoke v Swansea 1–0
G. Application of the Keener algorithm
In order to apply the Keener algorithm to the Diamond League event, we constructed a [33×33] adjacency matrix for all the competing athletes, which we populated with data from all ten races. In order to ensure consistency with the other ranking techniques used, we adopted a ‘who beat who’ strategy, in which each athlete who beat another athlete receiving a ‘vote’ of 1 from the defeated athlete, in the similar manner to the PR algorithm. In the event of a tie between two athletes, a ‘vote’ of 0.5 was awarded to each athlete [18].Eq (13)was then used to compute the aijstatistic, which in this case represented the adjusted win ratio, with sijbeing the
number of times athleteibeat athletej, and sjibeing the number of occasions on which athlete
jbeat athletei. For the Diamond League application, the win ratio was used rather than the score ratio, because we felt that this best reflected the ‘who beat who’ approach used in the PR algorithm.
H. Colley algorithm
Unlike the Keener method, which takes into account the outcome of individual matches between teams, the Colley algorithm utilises only the total number of wins, losses and games played to rank competing teams. It was developed by Wesley Colley in 2002 to rate teams in match-orientated sports [19] and utilizes Laplace’s rule of succession [18] to produce a [n×1] vector,v, (where, n is the number of competing teams) usingEq (19):
vi ¼1þ0:5ðwi liÞ ð19Þ
where,viis the combined ‘score’ of theithteam;wiis the number of wins of theithteam; andli
is the number of losses of theithteam. Colley’s method solves the linear system:
Crc¼v ð20Þ
where,rcis the Colley rating vector, which defines the ranking of the teams; andCis the Colley
coefficient matrix defined as [13]:
Cij¼
2þpi if i¼j;
pij if i6¼j; (
ð21Þ
where,piis the total number of times teamihas played; andpijis the number of matches
played between teamsiandj.
If the Colley algorithm is applied to the hypothetical mini-soccer league outlined above (see
Table 2), then the Colley matrix, C, is:
C¼
5 0 0 1 1 1
0 5 2 1 0 0
0 2 5 0 0 1
1 1 0 5 1 0
1 0 0 1 5 1
1 0 1 0 1 5
2
6 6 6 6 6 6 6 6 6 6 4
3
7 7 7 7 7 7 7 7 7 7 5
and the vector,v, is:
v¼
1:5
1:5
1:5
0:5
0:5
1:5 2
6 6 6 6 6 6 6 6 6 6 4
3
7 7 7 7 7 7 7 7 7 7 5
ð23Þ
By solvingEq (20), the Colley rating vector,rc, can be computed, which indicates that the
Colley algorithm ranks the teams in the following order: Liverpool, Chelsea, Tottenham, Arse-nal, Stoke and Swansea.
rc ¼ 0:530
0:644
0:674
0:374
0:197
0:580 2
6 6 6 6 6 6 6 6 6 6 4
3
7 7 7 7 7 7 7 7 7 7 5
ð24Þ
I. Application of the Colley algorithm
In order to apply the Colley algorithm to the Diamond League event, we constructed a [33×33] adjacency matrix in the same manner as used with Keener algorithm. We used this to calculate for each athlete, the total number of contests won and lost against the other athletes, which we then used to compute the vector, v, usingEq (19). The Colley matrix was compiled as described above, with the number of ‘matches’ being the number of times the respective ath-letes ran against each other.
J. Massey algorithm
In 1997 Kenneth Massey proposed a ranking model which used a least squares approach to solve a system of linear equations expressing the relationship between team ratings and the margin of victory [20]. Massey’s method involved constructing a [m×n] matrix,W, recording the outcomes of m matches between n teams. Matrix,W, is populated according to the follow-ing rules [13], wherewkiis an indicator variable for the outcome of thekthgame for teamTi.
Wki¼
1 if team Tiwon the kthgame;
1 if team Tilost the kthgame;
0 otherwise
8 > <
>
: ð25Þ
Massey used matrix,W, and a vector,y, containing the margins of victory, to solve the fol-lowing normal equation, in whichrmis the vector of unknown ratings.
WTWr m¼W
Ty ð26Þ
Conveniently, Massey was able to simplifyEq (26)to:
where, the Massey matrix,M, is:
Mij¼ ðW TWÞ
ij¼
pi if i¼j;
pij if i6¼j; (
ð28Þ
piis the total number of games played by teami;pijis the number of matches played between
teamsiandj, anddis the vector of cumulative points differentials.
d¼WTy ð29Þ
If Massey’s method is applied to the mini-soccer league example (seeTable 2), then the Massey matrix,M, becomes:
M¼
3 0 0 1 1 1
0 3 2 1 0 0
0 2 3 0 0 1
1 1 0 3 1 0
1 0 0 1 3 1
1 0 1 0 1 3
2 6 6 6 6 6 6 6 6 6 6 4 3 7 7 7 7 7 7 7 7 7 7 5
ð30Þ
and the vector of cumulative goal differentials,d, is:
d¼ 2 3 2 4 6 3 2 6 6 6 6 6 6 6 6 6 6 4 3 7 7 7 7 7 7 7 7 7 7 5
ð31Þ
BecauseEq (27)does not necessarily have a unique solution, Massey proposed a work-around solution [18,20], which involved replacing the last row of the matrix,M, with a row of ones, and the last row of the vector,d, with a zero as follows, thus forcing the unique solution forrmshown inEq 33.
3 0 0 1 1 1
0 3 2 1 0 0
0 2 3 0 0 1
1 1 0 3 1 0
1 0 0 1 3 1
1 1 1 1 1 1
2 6 6 6 6 6 6 6 6 6 6 4 3 7 7 7 7 7 7 7 7 7 7 5
rm1
rm2
rm3
rm4
rm5
rm6
2 6 6 6 6 6 6 6 6 6 6 4 3 7 7 7 7 7 7 7 7 7 7 5 ¼ 2 3 2 4 6 0 2 6 6 6 6 6 6 6 6 6 6 4 3 7 7 7 7 7 7 7 7 7 7 5
rm¼
0:500
1:857
2:143
1:714
2:500
0:714 2
6 6 6 6 6 6 6 6 6 6 4
3
7 7 7 7 7 7 7 7 7 7 5
ð33Þ
From vector,rm, it can be seen that the Massey methods ranks the teams in exactly the same
order as the Colley algorithm, namely: Liverpool, Chelsea, Tottenham, Arsenal, Stoke and Swansea.
K. Application of the Massey algorithm
In order to apply the Massey algorithm to the Diamond League event, we constructed a [33×33] adjacency matrix for all the competing athletes, which we populated with data from all ten races. Since the Massey method was developed for competitions in which teams play paired matches, we adopted a strategy that mimicked the scoring in a soccer match. So in a race com-prising eight athletes, the winner was deemed to have scored seven ‘goals’ more than the last athlete, who was deemed to have scored no ‘goals’. Likewise, second and third athletes in the race were deemed to have scored six and five ‘goals’ respectively. This pattern continued until the second to last athlete, who scored only one ‘goal’ more than the last athlete. We used this matrix to calculate the cumulative points differential score for each athlete, which we com-piled into vector,p. The Massey matrix was compiled as described above, with the number of ‘matches’ being the number of times the respective athletes ran against each other.
L. Statistical analysis
The final rankings produced by the various algorithms were compared with each other and also with the standings computed using the official IAAF Diamond League points system. In the 2015 season, for all the races, except the final meeting in Bruxelles, four points were awarded for first place, two points for second place, and one for third place [25]. In the final race in Bruxelles the points awarded were double those awarded for the other races. However, in 2016 the IAAF changed its points system to accommodate lesser positions. Under the ‘2016’ points system, ten points were awarded for a win, six for second, four for third, three for fourth, two for fifth, and one for six [26]. As in the ‘2015’ points system double points were awarded for the final race. Because both IAAF points systems reflected different attributes, we used both methods to compute alternative final standings for the athletes, which we than com-pared with the standings produced using the various algorithms described above.
In order to compare the standings produced by the various ranking systems, we calculated the Kendall’s tau rank distances between the respective standings for the top 23 athletes (i.e. the number of athletes ranked by the Diamond League ‘2016’ points system), which we then normalized (Eq (34)) to compute the percentage of pairs that differed in order between the ranking lists. Kendall’s tau distance is a metric that counts the number of pair order disagree-ments between two ranking lists. It can be normalized to yield the fraction of discordant pairs as follows:
tdist¼ Nd
where,τdistis the normalized Kendall’s tau distance;Nis the number of items in each ranking
list; andNdis the number of discordant pairs.
In addition, Pearson correlation analysis was performed using the paired ranking scores computed by the various systems for the respective athletes. Statistical analysis of the data was performed using ‘in-house’ algorithms written in ‘R’ and Matlab. For all tests, p values<0.05 were deemed to be significant.
Results
[image:17.612.34.584.254.710.2]The standings computed by the PR algorithm for each competing athlete after every race are presented inTable 3. From this it can be seen that as the season progressed, the number of rank scores allocated, steadily increased as more and more athletes became involved in the
Table 3. Rank scores allocated to each competing athlete after every race using the PageRank algorithm.
Doha Eugene Rome Birmingham New York Paris Lausanne Monaco London Bruxelles 15thMay 30thMay 4thJune 7thJune 13thJune 4thJuly 9thJuly 17thJuly 24thJuly 11thSept
Athlete ID Name Rank Rank Rank Rank Rank Rank Rank Rank Rank Rank
1 Harry Adams na na =15 =19 =21 =25 =25 =25 =27 =28
2 Nickel Ashmeade na na na na 16 18 18 16 20 20
3 Guy-Elphege Anouman na na na na na =25 =25 =25 =27 =28
4 Kemar Bailey-Cole na na na na na na na na 13 14
5 Deondre Batson 7 11 9 11 10 11 11 11 14 16
6 Emmanuel Biron na na na na na 24 24 24 26 27
7 Keston Bledman 3 5 7 9 6 9 9 9 10 11
8 Usain Bolt na na na na na na na na 8 10
9 Marvin Bracy na na na 3 4 4 6 5 5 6
10 Nesta Carter 6 7 6 5 5 5 5 6 6 7
11 Kim Collins 4 4 5 7 8 8 7 8 9 9
12 James Dasaolu 8 9 12 15 15 17 17 19 22 21
13 Andrew Fisher na na 14 18 20 23 23 23 25 26
14 Julian Forte na na na =19 =21 =25 =25 =25 =27 =28
15 Justin Gatlin 1 1 1 1 1 2 1 1 1 1
16 Tyson Gay na 2 3 4 3 3 4 2 3 3
17 Adam Gemili na na na 8 9 10 10 10 12 13
18 Ramon Gittens na na na na na na na na na 23
19 Richard Kilty na na na 14 14 16 16 18 19 22
20 Trell Kimmons na na na na 19 22 22 22 17 18
21 Churandy Martina na na na na na 19 19 20 23 24
22 Joseph Morris na na na na =21 =25 =25 =25 =27 =28
23 Femi Ogunode 5 8 10 12 13 15 15 15 21 8
24 Asafa Powell na na na na na 6 2 4 4 5
25 Mike Rodgers 2 3 2 2 2 1 3 3 2 2
26 Akani Simbine na na 11 13 11 12 12 12 15 15
27 Bingtian Su na 6 8 10 12 13 13 13 16 17
28 Richard Thompson na 10 13 17 18 21 21 21 24 25
29 Chijindu Ujah na na na 16 17 20 20 14 11 12
30 Clayton Vaughn na na na na na 14 14 17 18 19
31 Jimmy Vicaut na na 4 6 7 7 8 7 7 4
32 Justin Walker na 12 =15 =19 =21 =25 =25 =25 =27 =28
33 Isiah Young na na na na na na =25 =25 =27 =28
competition. This is illustrated inFig 3, which shows the respective connectivity networks for the system after three, six and ten races. In these network graphs the graph edges (i.e. the straight lines) link competitors who raced against each other, with the direction of the arrow indicating who beat who. It can be seen from this that after three races (Fig 3A) the network is still relatively simple, with only 16 competitors involved in the competition. However, when all 33 athletes have become involved, after ten races, the network becomes much more com-plex and difficult to understand (Fig 3C).
The results inTable 3reveal that, with just one exception, the PR algorithm consistently ranked Justin Gatlin as number one throughout the season, while Tyson Gay and Mike Rogers broadly competed for second and third place. When athletes of higher quality, such as Marvin Bracy and Usain Bolt, entered the competition, they scored relatively highly, depressing the rank scores of less able competitors. Of the lower ranking athletes, Harry Adams, Guy-Elphege Anouman, Julian Forte, Joseph Morris, Justin Walker and Isiah Young only ran once and all finished last in the single race in which they were entered. As such, they all received the same low PR and were ranked in equal last place.
[image:18.612.203.499.79.367.2]Table 4presents the PR, UP, Keener, Colley and Massey standings for the athletes after ten races, together with fastest times achieved and the rankings calculated using the official IAAF Diamond League 2015 and 2016 points systems. This reveals that the PR standings bear a close resemblance to the rankings achieved using the Diamond League points system (particularly the 2016 system) and also, to a lesser extent, those produced by the Keener and UP algorithms. Indeed, the top five places for the PR, UP, Keener and 2016 points system standings were all identical. The Kendall’s tau distances and Pearson correlations between the various standings
Fig 3. Connectivity networks between athletes after: (A) the first three races; (B) the first six races; and (C) all ten races.
Table 4. Final standings computed using the various ranking algorithms together with the standings computed using methods adopted by the Diamond League.
PageRank User Preference
Keener Colley Massey Diamond League
Diamond League
Diamond League Official
Algorithm Algorithm Algorithm Algorithm Algorithm 2015 Points System 2016 Points System Fastest Times Rank Score Rank Order (Score) Rank Order (Score) Rank Order (Score) Rank Order (Score) Rank Order (Score) Rank Order (Points) Rank Order (Points) Rank Order [Time (s)]
1 J Gatlin (0.154) J Gatlin (2.477) J Gatlin (0.088) J Gatlin (1.040) U Bolt (3.955) J Gatlin (24) J Gatlin (60) J Gatlin [9.74] 2 M Rodgers
(0.097) M Rodgers (2.124) M Rodgers (0.072) M Bracy (0.912)
J Gatlin (3.927) T Gay (11) M Rodgers (39) A Powell [9.81]
3 T Gay (0.065) T Gay (1.909) T Gay (0.071) U Bolt (0.907) M Bracy (3.641) M Rodgers (9) T Gay (30) J Vicaut [9.86] 4 J Vicaut (0.061) J Vicaut (1.692) J Vicaut (0.063) T Gay (0.877) A Gemili
(2.641)
J Vicaut (7) J Vicaut (24) U Bolt [9.87]
5 A Powell (0.060) A Powell (1.303) A Powell (0.050) A Powell (0.814) A Powell (2.473)
A Powell (6) A Powell (16) T Gay [9.88]
6 M Bracy (0.045) U Bolt (1.091) N Carter (0.050)
A Gemili (0.801)
T Gay (2.403) M Bracy (4) N Carter (16) M Rodgers [9.90]
7 N Carter (0.043) M Bracy (0.636) K Bledman (0.048)
M Rodgers (0.776)
J Vicaut (2.307) F Ogunode (4) F Ogunode (14)
K Bailey-Cole [9.92] 8 F Ogunode
(0.040)
K Bledman (0.626)
K Collins (0.045)
J Vicaut (0.750) K Bailey-Cole (1.954)
U Bolt (4) K Bledman (14) M Bracy [9.93]
9 K Collins (0.039)
F Ogunode (0.576)
U Bolt (0.043) F Ogunode (0.744)
M Rodgers (1.849)
K Bledman (3) K Collins (11) C Ujah [9.96]
10 U Bolt (0.038) K Bailey-Cole (0.546) F Ogunode (0.042) K Bailey-Cole (0.726) F Ogunode (1.775)
A Gemili (2) U Bolt (10) A Gemili [9.97]
11 K Bledman (0.034)
A Gemili (0.424) C Ujah (0.040) K Bledman (0.671)
K Bledman (0.757)
N Carter (1) M Bracy (10) F Ogunode [9.98]
12 C Ujah (0.027) B Su (0.364) K Bailey-Cole (0.034)
B Su (0.647) B Su (0.535) K Bailey-Cole (1)
C Ujah (7) B Su [9.99]
13 A Gemili (0.024) N Carter (0.283) A Simbine (0.033)
N Carter (0.534)
R Gittens (-0.188)
B Su (1) A Gemili (6) K Collins [9.99]
14 K Bailey-Cole (0.022) C Vaughn (-0.212) D Batson (0.026) K Collins (0.505)
R Kilty (-0.359) K Bailey-Cole (4)
N Carter [10.00]
15 A Simbine (0.020)
R Kilty (-0.212) M Bracy (0.025)
R Gittens (0.502)
N Carter (-0.451)
B Su (4) K Bledman [10.01] 16 D Batson
(0.019) K Collins (-0.222) A Gemili (0.023) C Vaughn (0.477)
C Ujah (-0.475) A Simbine (3) R Kilty [10.05]
17 B Su (0.017) R Gittens (-0.364)
T Kimmons (0.022)
C Ujah (0.472) C Vaughn (-0.835)
C Vaughn (3) J Forte [10.06]
18 T Kimmons (0.015)
A Simbine (-0.379)
B Su (0.021) R Kilty (0.468) K Collins (-0.836)
D Batson (2) T Kimmons [10.07] 19 C Vaughn
(0.014) D Batson (-0.460) J Dasaolu (0.020) A Simbine (0.426) A Simbine (-1.171) N Ashmeade (2)
A Simbine [10.08]
20 N Ashmeade (0.014)
C Martina (-0.546)
E Biron (0.020) I Young (0.398) D Batson (-1.835)
R Kilty (2) D Batson [10.08]
21 J Dasaolu (0.014) N Ashmeade (-0.576) R Gittens (0.020) D Batson (0.365) I Young (-2.089)
R Gittens (2) C Vaughn [10.08]
22 R Kilty (0.013) C Ujah (-0.591) N Ashmeade (0.019)
T Kimmons (0.350)
N Ashmeade (-2.111)
T Kimmons (1) I Young [10.11]
23 R Gittens (0.013) R Thompson (-0.606) C Vaughn (0.015) N Ashmeade (0.324) T Kimmons (-2.280)
J Dasaolu (1) N Ashmeade [10.11] 24 C Martina
(0.013)
I Young (-0.636) A Fisher (0.014)
C Martina (0.323)
J Forte (-2.359) R Gittens [10.11]
25 R Thompson (0.012)
J Forte (-0.636) C Martina (0.014)
A Fisher (0.256)
C Martina (-2.626)
C Martina [10.12]
are presented inTable 5. From these it can be seen that the tau distance between the PR stand-ings and ‘2016’ points system standstand-ings was 15, indicating that only 5.9% of pairs differed in their order between the two lists. The equivalent tau distances for the Keener and UP standings were 76 (30.0% pair order disagreement) and 95 (37.5% pair order disagreement) respectively,
Table 4. (Continued)
PageRank User Preference
Keener Colley Massey Diamond League
Diamond League
Diamond League Official
[image:20.612.34.578.91.338.2] [image:20.612.35.578.470.684.2]Algorithm Algorithm Algorithm Algorithm Algorithm 2015 Points System 2016 Points System Fastest Times Rank Score Rank Order (Score) Rank Order (Score) Rank Order (Score) Rank Order (Score) Rank Order (Score) Rank Order (Points) Rank Order (Points) Rank Order [Time (s)]
26 A Fisher (0.012) T Kimmons (-0.833)
H Adams (0.013)
R Thompson (0.247)
E Biron (-3.122) J Dasaolu [10.12]
27 E Biron (0.012) J Walker (-0.849)
R Kilty (0.012) J Forte (0.245) J Dasaolu (-3.289)
A Fisher [10.14]
28 J Walker* (0.011) J Morris (-0.849) GE Anouman (0.011) J Dasaolu (0.234) R Thompson (-3.465)
E Biron [10.17]
29 H Adams* (0.011)
A Fisher (-0.849)
R Thompson (0.010)
E Biron (0.217) A Fisher (-3.601)
H Adams [10.24]
30 J Forte*(0.011) GE Anouman (-1.091)
I Young (0.010) H Adams (0.165)
GE Anouman (-4.391)
R Thompson [10.27] 31 J Morris*
(0.011) H Adams (-1.121) J Walker (0.010) GE Anouman (0.159) J Walker (-4.465)
J Walker [10.28]
32 GE Anouman* (0.011)
E Biron (-1.303) J Morris (0.009) J Walker (0.147)
H Adams (-4.601)
GE Anouman [10.32] 33 I Young*
(0.011)
J Dasaolu (-1.717)
J Forte (0.007) J Morris (0.116) J Morris (-4.670)
J Morris [10.45]
*Athletes finished last in their respective races and are therefore ranked in race order.
https://doi.org/10.1371/journal.pone.0178458.t004
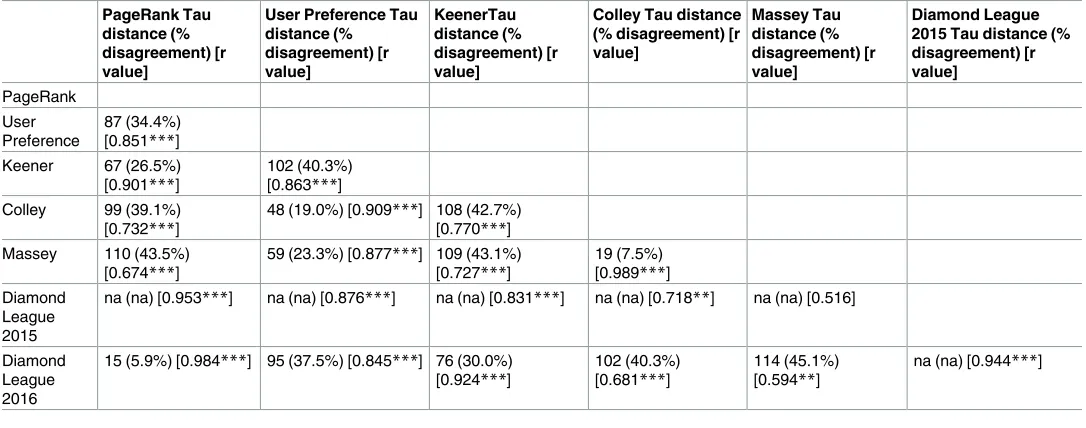
Table 5. Kendall’s tau distance and percentage disagreement in pair order, together with Pearson correlation r-values, between the top 23 athletes in each of the respective standings.
PageRank Tau distance (% disagreement) [r value]
User Preference Tau distance (% disagreement) [r value] KeenerTau distance (% disagreement) [r value]
Colley Tau distance (% disagreement) [r value] Massey Tau distance (% disagreement) [r value] Diamond League 2015 Tau distance (% disagreement) [r value] PageRank User Preference 87 (34.4%) [0.851***] Keener 67 (26.5%) [0.901***]
102 (40.3%) [0.863***] Colley 99 (39.1%)
[0.732***]
48 (19.0%) [0.909***] 108 (42.7%) [0.770***] Massey 110 (43.5%)
[0.674***]
59 (23.3%) [0.877***] 109 (43.1%) [0.727***] 19 (7.5%) [0.989***] Diamond League 2015
na (na) [0.953***] na (na) [0.876***] na (na) [0.831***] na (na) [0.718**] na (na) [0.516]
Diamond League 2016
15 (5.9%) [0.984***] 95 (37.5%) [0.845***] 76 (30.0%) [0.924***]
102 (40.3%) [0.681***]
114 (45.1%) [0.594**]
na (na) [0.944***]
**Pearson r value significant at p<0.01 ***Pearson r value significant at p<0.001
indicating that their agreement with the 2016 Diamond League points system was much less strong than that produced using the PR algorithm. The close relationship between PR scores and the ‘2016’ points is highlighted in the scatter plot shown inFig 4. From this it can be seen that there is a very strong positive correlation (r = 0.984, p<0.001) between the two. By com-parison, the ‘2016’ and UP standings displayed a less strong relationship (r = 0.845, p<0.001) (Fig 5), as did the ‘2016’ and Keener standings (r = 0.924, p<0.001). These differences are
Fig 4. Scatter plot of the paired PageRank scores and points (calculated using the 2016 points system) awarded to the top 23 athletes.
https://doi.org/10.1371/journal.pone.0178458.g004
Fig 5. Scatter plot of the paired user preference scores and points (calculated using the 2016 points system) awarded to the top 23 athletes.
[image:21.612.202.502.443.688.2]reflected in the tau distances between the PR and the UP and Keener standings, which were 87 (34.4% pair order disagreement) and 67 (26.5% pair order disagreement) respectively.
While the Colley and Massey algorithms yielded standings that were very similar to each other (tau distance = 19, 7.5% pair order disagreement), the standings produced by both these methods were markedly different from those produce by either the PR and Keener algorithms, or indeed the Diamond League points systems. For example, the Colley and Massey algorithms ranked Usain Bolt and Marvin Bracy much higher, and Mike Rogers much lower, than any of the other methods. Notwithstanding this, some similarities were observed between the UP standings and the Colley and Massey standings, with the tau distances between these ranking lists being only 48 (19.0% pair order disagreement) and 59 (23.3% pair order disagreement) respectively, much smaller than the equivalent distances between the UP standings and the PR and Keener algorithms.
Discussion
The results of our study are promising and suggest that graph based algorithms have consider-able potential as tools for ranking the performance of track athletes, without the need for com-plex tables. Currently, the ‘All-athletics’ World Rankings [27,28] rely on a complicated system in which athletes accumulate points as they compete in IAAF approved competitions. For any given competition the overall performance score of the athlete is the sum of the ‘result score’ (based on the time achieved) and a ‘placing score’ (generally based on the athletes placing in the final of the competition) [27]. The results score is awarded for the result (i.e. time) achieved according to the IAAF Scoring Tables of Athletics [3] and is modified depending on factors such as wind speed and hand timing [27]. By comparison, placing scores are awarded only to those who reach the final of a competition (or semi-final in the case of the Olympic Games and the IAAF World Outdoor Championships), with competitions allocated different amounts of points depending on their perceived quality of the event. For example, while winning a track event at a IAAF Diamond League meeting will earn a placing score of 170, winning the same event at a IAAF World Challenge meeting will only earn 100 points [28]. As such, the IAAF system does not primarily assess ‘who beat who’, but rather, relies more on the times achieved and a series arbitrary classifications designed to reflect the quality of the competition. Consequently, there is the potential for subjectivity to enter the ranking system. By compari-son systems such as the PR and UP algorithms are more objective and are much simpler, rely-ing purely on a ‘who beat who’ matrix, no matter the level of competition, thus eliminatrely-ing the need for complex tables. Furthermore, because the IAAF ranking system only allocates placing scores to the top athletes who reach the track finals, it does not reflect the race competitiveness (i.e. placings) of the lesser athletes, something that can be problematic for coaches wanting to assess the true performance of developing athletes. Thus the development of graph based algo-rithms capable of objectively ranking athletes, particularly developing athletes, may be of con-siderable benefit to all those involved in athletics.
However, greater variability was observed between the two sets of standings for the lower ranked competitors. This is probably due to the fact that the Diamond League points system allocates placing points, irrespective of the quality of the competitors involved. So in a weak race, a lesser athlete might score more highly than would otherwise be the case if the competi-tion were stronger, with the result that the standings may not accurately reflect the true perfor-mance of that athlete. Also, because the Diamond League points system is integer based, this means that it tends to lose definition when the point scores are low, with the result that points scored in a weak race can make a considerable difference to the rank position amongst the weaker athletes. In comparison, because the PR system has greater definition and accurately reflects ‘who beat who’, it is more able to capture true race performance and distinguish between athletes in the lower reaches of the standings.
In our PR model an athlete who beats another athlete can be considered as receiving a ‘vote’ from the beaten athlete. Consequently, the winner of a race involving eight athletes will receive seven votes. However, in the PR model these votes are not all equal, because beaten athletes with a higher PR score will make a greater contribution to the PR score of the race winner, than those from beaten athletes exhibiting a low PR score. As such, the PR algorithm tends to favour individuals who race more often and perform reasonably well (e.g. Mike Rodgers, who raced many times and was placed second or third in most races), over outstanding athletes, such as Usain Bolt, who participate sparingly. However, the same would generally be true for a points based system. As such, both approaches tend to favour athletes who perform consis-tently well, over those who put in outstanding ‘one-off’ performances. So although the PR algorithm and the points system utilise very different methodologies, in the context of the Dia-mond League, they appear to achieve very similar results.
When compared with the other ranking systems, the PR algorithm produced results that were most similar to those of the Keener algorithm, with a 26.5% pair order disagreement between the two ranking lists. This suggests that the Keener algorithm, as executed here, pro-duces standings that capture some of the attributes displayed in the PR standings, and indi-cates that it may also have potential as a tool for assessing track athletes. Having said this, it is noticeable that the Keener algorithm ranked Marvin Bracy relatively lowly, despite this athlete winning the race in which he competed. This appears to be due to the fact that only seven ath-letes competed in Bracy’s race, whereas the Keener algorithm ranked Usain Bolt six places above Bracy, primarily because he won a race in which nine athletes competed. As such this represents a serious limitation of the Keener method, which may impede its application to track athletics.
better suited to predicting future performance, say in knockout tournaments, rather than assessing performance in competitions such as the Diamond League. The differences between the PR and UP algorithms are starkly highlighted in Figs4and5. Not only did the PR algorithm rank the athletes in a similar order to the Diamond League ‘2016’ points sys-tem, it did so using broadly similar intervals to the Diamond League method, as demon-strated by the general linearity of the scatter plot inFig 4. By comparison, the scatter plot in
Fig 5displays marked non-linearity between the results of the UP algorithm and the Dia-mond League system.
Linear algebra based sports ranking models such as the Coley matrix method [13,19] and the Massey least squares system [13,20] have been used for many years to rate teams in the Bowl Championship Series in American college football [18]. While these algorithms are well suited to team sports where each match consists of two teams playing each other, they are more difficult to apply in sports such as track athletics, where eight athletes may compete against each other in a single race, and where athletes compete in different numbers of races. Attempts have been made to address this later point by introducing the concept of a ‘super-user’ into the competition, where unequal numbers of games have been played, with promis-ing results [29]. However, this does not address the former point, and so when applying the Colley and Massey algorithms to the Diamond League, we had to adapt them so that the ath-letes mimicked ‘teams’ playing each other. While the standings produced by both these algo-rithms tended to rank strong ‘on-off’ athletes such as Usain Bolt and Marvin Bracy very highly, overall they did not reflect the structure and ethos of the Diamond League. By com-parison, the PR algorithm appears much better suited to track athletics tournaments such as the Diamond League. Prior to the present study, the PR algorithm had been used to rate the performance of teams in the NFL [11–13], international soccer teams [14], and individual soccer players [15,16], but not track athletes. As such, there was no prior precedence regard-ing the construction of the adjacency and UP matrices used in the study. Consequently, one of the major challenges associated with the study was to develop a suitable methodology for ensuring that these matrices accurately reflected the characteristics of the competition. After due consideration, for the PR algorithm, we decided to construct an adjacency matrix in which the more successful athletes received ‘votes’ from the defeated athletes whom they beat. So for a race containing eight athletes, the winner would receive seven votes, while the last athlete would receive none. This meant that at the end of the ten race series, there were a few athletes who were placed equal bottom of the standings by the PR algorithm simply because they competed only once and came last in their respective races. With regard to the UP algorithm, one major challenge was how best to cope with the varying number of athletes in each race. If, as is normal for Internet retailing, we had adopted a ‘five star’ system, then only the first five athletes in each race would have been ranked. Conversely, if we had awarded ‘stars’ to every athlete that competed, then the winner of a race containing nine competitors would receive two more ‘stars’ than an athlete who won a race involving just seven individuals. We therefore decided on the reverse ‘star’ strategy described in the meth-odological section above, because this best preserved scoring parity amongst the leading ath-letes. This strategy did however have a downside, in that an athlete who finished last in a race involving just seven athletes would receive more ‘stars’ than one involved in a race with eight athletes. As such, this led to a few anomalies amongst the lower ranked athletes for the UP algorithm. For example, the UP algorithm ranked Julian Forte relatively high (twenty-fifth) compared to other athletes, despite the fact that he finished last in his respective race, simply because that race contained just seven athletes.
context were competition is fragmented. With respect to this both the PR and UP algorithms appear to have potential. Because they are both essentially ‘who beat who’ models that auto-matically rank the contestants, they minimise any subjectivity that would otherwise be involved. Consequently, they have the potential to objectively rank individuals and teams in sports where competition between competitors can be sparse, such as in boxing, tennis and athletics, or in international soccer and rugby. In these sports, lower ranked competitors fre-quently compete at a more regional level, making comparisons between individuals and teams difficult. In athletics, the ability to assign a ‘fine tuned’ score to lesser ranked athletes based solely on who beat who, rather than an arbitrary points system, may be something of particular interest to coaches seeking to assess the true performance of developing athletes, and also sporting authorities seeking to prioritise funds. Such athletes often fail to reach the finals of competitions and therefore, under the IAAF system, are not awarded a placing score, making it difficult for the coaches to assess their true performance.
While in the present study we used race position to construct the respective adjacency and UP matrices, we are aware that the difference in race time between athletes was also an option. However, in this study we decided against this because of potential differences between race tracks and variations in weather conditions, which might have compromised our results. Con-sequently, both the PR and UP models are essentially ‘who beat who’ methods that take no account of race times. While this approach appears well suited to the ethos of the Diamond League, we are conscious that our models could be improved by incorporating race times and plan to investigate this in the future. We are also aware that we have ignored other ranking sys-tems that might prove useful with regard to track athletes, the foremost of which is perhaps Elo’s system which has been used for many years to rate chess players [18], and has latterly been applied to the NFL [30], soccer [31] and even the study of animal behaviour [32]. Elo’s system uses the difference in the ratings between two players to predict the outcome of any given contest, but has an interesting self-correcting mechanism, which may have applicability to track athletics. After every contest, the winning player takes points from the loser, with the amount of rating points transferred governed by the difference between the prior ratings of the two players. For any given contest, if the high-ranked player wins, then only a few points are taken from the low-ranked player. However, if an upset occurs and the lower ranked player wins, then many rating points are transferred from the high-rank loser. Consequently, Elo’s system is self-correcting, with players whose rating is too low, in the long run doing better than their initial rating might predict, with the result that they gain points until their rating reflects their true performance level. As such, Elo’s system shares some similarities with the PR algorithm, insomuch that they both consider prior rating positions when calculating outcome ranks. However, unlike the PR algorithm, which updates the whole directed graph of the sys-tem after every contest, Elo’s method restricts itself to updating the ratings of just the players involved in any given match [32].
Author Contributions
Conceptualization: CB SS BJ.
Data curation: CB.
Formal analysis: CB SS.
Investigation: CB.
Methodology: CB BJ.
Software: CB.
Writing – original draft: CB BJ SE.
Writing – review & editing: CB BJ SE SS.
References
1. Till K, Cobley S, Morley D, O’Hara J, Chapman C, Cooke C. The influence of age, playing position, anthropometry and fitness on career attainment outcomes in rugby league. Journal of sports sciences. 2015; 34(13):1240–5.https://doi.org/10.1080/02640414.2015.1105380PMID:26512761
2. Till K, Jones BL, Cobley S, Morley D, O’Hara J, Chapman C, et al. Identifying Talent in Youth Sport: A Novel Methodology Using Higher-Dimensional Analysis. PLoS One. 2016; 11(5):e0155047. PMID:
27224653.https://doi.org/10.1371/journal.pone.0155047
3. Spiriev B, Spiriev A. IAAF scoring tables of athletics: International Association of Athletics Federations; 2014.
4. RFL. Rugby Foofball League: Section B3: League competition rules2016 1st December 2016.http:// media.therfl.co.uk/docs/Section%20B3%20-%20League%20Competiton%20Rules_Final%20PDF. pdf.
5. Robinson J. Understanding the Premier League2016 1st December 2016.http://worldsoccer.about. com/od/soccer101/a/101_Prem.htm.
6. Premiership_Rugby. League Rules2016 1st December 2016.http://rd.premiershiprugby.com/ matchcentre/tables/index.php#u7BeJIr0kp3sZAey.97.
7. OWG. Official world golf ranking: How the ranking system works2016 30th November 2016.http://www. owgr.com/about.
8. ATP. ATP world rankings: What is the ranking structure and formula for 2016?2016 1st December 2016.http://www.atpworldtour.com/en/rankings/rankings-faq.
9. Brin S, Page L. The anatomy of a large-scale hypertextual web search engine. Computer Networks and ISDN Systems. 1998; 33:107–17.
10. Brin S, Page L. Reprint of: The anatomy of a large-scale hypertextual web search engine. Computer Networks. 2012; 56(18):3825–33.
11. Zack L, Lamb R, Ball S. An application of Google’s PageRank to NFL rankings. Involve, a Journal of Mathematics. 2012; 5(4):463–71.
12. Govan AY, Meyer CD, editors. Ranking national football league teams using google’s pagerank. AA Markov Anniversary Meeting; 2006; Charleston: Boson Books.
13. Govan AY. Ranking theory with application to popular sports. Raleigh: North Carolina State University; 2008.
14. Lazova V, Basnarkov L. PageRank Approach to Ranking National Football Teams. arXiv preprint arXiv:150301331. 2015.
15. Pena JL, Touchette H, editors. A network theory analysis of football strategies Sports Physics: Euro-mech Physics of Sports Conference 2012; Palaiseau: Proc. 2012, Editions de l’Ecole Polytechnique.
16. Brandt M, Brefeld U. Graph-based Approaches for Analyzing Team Interaction on the Example of Soc-cer. Machine Learning and Data Mining for Sports Analytics; 11th September; Porto2015.
17. Balreira EC, Miceli BK, Tegtmeyer T. An Oracle method to predict NFL games. Journal of Quantitative Analysis in Sports. 10(2):183–96.
19. Colley WN. Colley’s bias free college football ranking method: The Colley matrix explained. Princeton University, Princeton. 2002.
20. Massey K. Statistical models applied to the rating of sports teams. Bluefield College. 1997.
21. Keener JP. The Perron-Frobenius theorem and the ranking of football teams. SIAM review. 1993; 35 (1):80–93.
22. 2015 Diamond League results [Internet]. 2015 [cited 4th September2016].https://www.diamondleague. com/lists-results/archive/2015/.
23. Bressan M, Peserico E. Choose the damping, choose the ranking? Journal of Discrete Algorithms. 2010; 8(2):199–213.
24. Meyer CD. Chapter 8: Perron-Frobenius theory of nonnegative matrices. Matrix analysis and applied linear algebra. Philadelphia: Society for Industrial and Applied Mathematics; 2000.
25. How it works: IAAF Diamond League 2015 media guide [Internet]. IAAF. 2015 [cited 4th September 2016].https://www.diamondleague.com/fileadmin/IDL_Default/files/documents/2015/2015_IDL_ media_guide.pdf.
26. The Diamond Race Rules and Points System [Internet]. IAAF. 2016 [cited 4th September 2016].https:// www.diamondleague.com/rules/.
27. Rules of the All-Athletics World Rankings—2016 [Internet]. All-athletics.com. 2016 [cited 4th September 2016].http://www.all-athletics.com/en-us/rules-all-athletics-world-rankings-2016.
28. Rules of the All-Athletics World Rankings—2016—Overall Rankings [Internet]. All-athletics.com. 2016 [cited 4th September 2016]. http://www.all-athletics.com/en-us/rules-all-athletics-world-rankings-2016-overall-rankings.
29. Chartier TP, Harris J, Hutson KR, Langville AN, Martin D, Wessell CD. Reducing the Effects of Unequal Number of Games on Rankings. IMAGE-The Bulletin of the International Linear Algebra Society. 2014; 52(1).
30. Paine N. NFL Elo Ratings Are Back!2015 10th March 2017. https://fivethirtyeight.com/datalab/nfl-elo-ratings-are-back/.
31. World football Elo ratings [Internet]. 1997 [cited 10th March 2017].http://www.eloratings.net/.