FORECASTING EARNINGS PER SHARE FOR COMPANIES
IN IT SECTOR USING MARKOV PROCESS MODEL
1M.P. RAJAKUMAR, 2V. SHANTHI
1Research Scholar, Sathyabama University, Chennai-119, Tamil Nadu, India 2 Professor, St.Joseph’s College of Engineering, Chennai-119, Tamil Nadu, India
E-mail: [email protected] , [email protected]
ABSTRACT
Investors rely growth on earnings per share (EPS) which is the net income less dividends on preferred stock divided by the number of outstanding share for measuring the financial soundness of a company as it represents the profitability of a common stock. Many investors select stocks on the basis of earnings forecast, cost of capital and the particular company’s profitability compared to other companies. As this seems to be the base for any development phase, market analysts spend ample time in evaluating and refining EPS estimates. In this work Markov process model is applied for forecasting the subsequent quarter EPS for companies in information technology (IT) sector. Two models namely two state basic model and extended state interval model with time independent transition probability matrices are applied to analyze and predict the EPS for subsequent quarter of HCL infosystem, Reliance, Infosys and Wipro. The EPS data obtained from Bombay stock exchange (BSE) are used to test the proposed prediction model. The experimental results declare that two companies’ show optimistic sign of success, one company strikes a balance and the other company provides state of loss. The outcome of the prediction process is consistent in the real situation.
Keywords: Markov process model, earnings per share, forecasting, IT sectors
1. INTRODUCTION
In the recent scenario, stock market has become a vital part of the global economy. The economic situation of any country is influenced by the market fluctuation thereby creating a drastic change in our personal and financial lives. Though stock market is said to be one of the popular investments, involvement of high risks due to unpredictable behavior of stock market creates havoc in the mind of investors. An ideal prediction model for stock market will contribute market analysts and induce the investors to make investments.
EPS is the most important variable which is considered as the prime determinant of market share price. The financial performance and the extent of profitability of common stock of a particular company is represented by the EPS which is the earnings return on original investments. In spite of its limitation as an investment analysis tool, investment analysts rely growth on EPS which is said to be of classical model to measure the performance of business [1]. EPS reflects healthy or unsound financial positions of a company, the market price in the stock exchange and also profit earnings (PE) ratio,
dividend yield, earnings yield [2]. The impact of EPS, PE ratio and market to book ratio explain 63 percent of change in one period ahead stock returns [3]. In the long-run investment there exists a thick relationship between EPS and stock prices. Furthermore, for the industry with a low level of growth rate, EPS has strong impact in share prices [4]. Investors take major decisions of investments only on the basis of the EPS of a particular company and accuracy of EPS prediction is said to be the major factor of market prediction. Many factors like net sales, operating profit and non-operating revenues are said to be the major factors influence the EPS of a company. Such factors should be analyzed in detail and accurate estimation about the earnings should be made before making market prediction and determining EPS.
interest for describing the behavior of a system evolving over period of time.
Stochastic process in the form of discrete sequence of random variables {xn}, n =1, 2…. is said to have Markov property if P (Xn+1=i n+1/ xn=in,xn-1=in-1……x2=i2,xi=i1) = P (X n+1=i n+1/xn=in) holds for any finite n, where particular realizations xn belong to discrete state space S ={si}, i=1,2…k. The process of moving one state of the system to another with the associated probabilities of each transition is known as a chain. The transition probabilities from m x m transitional probability matrix T, where
= = mm m2 m1 2m 22 21 1m 12 11 ij p p p p p p p p p ] [P T L M M M M L L
with the following properties
(i) Pij > 0 for all i and j
(ii) P 1
n 1 j ij=
∑
=for all i and j
(iii) the diagonal element represents transition from one state to same state
Each row of T is the probability distribution relating to a transition from state i to state j. A chain is said to have a steady state distribution if there exists a vector P such that given transition matrix T, we have ΠT=Π. This steady state vector can be viewed as the distribution of random variable in the long run. In our study, we aim at forecasting the subsequent quarterly EPS value by Markov chain.
Forecasting EPS is a very interesting and challenging work though the concept of EPS seems to be simple and straightforward. Forecasting quarterly accounting EPS are of great interest to market investors, top level managers, financial analysts and capital market researchers [5]. It is essential to measure the accurate forecast for both optimum portfolio management and optimum resource allocation since high level management use these forecasts as a basis to configure their financial decisions, investment portfolios, operational budgeting and market risks [6] [7].
The work enumerates the Markov process approach for forecasting the subsequent quarter EPS for companies in IT sector. The Markov process model is applied to forecast the EPS for HCL info system, Reliance, Infosys and Wipro.
The work classify the proposed Markov process approach into two models where the input is portioned into two basic trends namely growth and decrease in the first model and in the second model the input is classified into various state intervals to obtain better accuracy and confidence.
The rest of the paper is presented as follows: Section 2 depicts related works including neural network, fuzzy system, Markov process model, Hidden Markov model (HMM) and fusion model comprising of Auto regression (AR) with Adaptive neuro fuzzy inference system (ANFIS) , Auto regressive moving average (ARMA) with ANFIS. The proposed model is presented in section 3. A detailed discussion of the results is carried out in Section 4. The conclusions obtained from the study are composed in section 5.
2. RELATED WORKS
The work explored HMM approach for forecasting the next day’s closing price of the some of the airlines stock [8]. The system used only one HMM trained on the past data set. The likelihood value for current day’s data set was calculated using this trained HMM. The forecasting strategy was analyzed by interpolating the neighboring values of the chosen airlines datasets. The results shows that HMM offer a new paradigm for stock market forecasting.
In [9], the study explored the application Markov chain to analyze and predict the stock market index and closing price more effectively. The results are presented probability of a certain state of stock prices in the future. This prediction model consists of construction of state, state probability, state transition probability matrix, deriving all kinds of state vector and predicting in stable condition.
The research work incorporated the Markov chain concept into fuzzy stochastic prediction of stock indexes [10]. The parameters for prediction model are determined using both fuzzy linguistic summary and probability of stock indexes rising or falling. The model combines the advantages of fuzzy linguistic summarization approaches and proved able to consider simultaneously both the charge rates, rising and falling probability of stock indexes.
forecasts. The finding provides how analysts perform different in the competitive market of investment information services.
The purpose of this work was to determine the relationship between a diverse portfolio of stocks and the market using a discrete time stochastic model called a Markov chain [12]. The models of the portfolio highlighted were state of gain or loss and small, moderate or large gain or loss. Markov process model established the fact of how the entire market was useful in gauging the behavior of portfolio of stocks.
In [13], the author explored a hybrid EPS forecasting model for leading industries that combines an AR model into ANFIS model. The hybrid model consists of test the lag period of EPS, partition into linguistic variable by fuzzy C-means clustering, generating fuzzy inference system (FIS), and training the parameters of FIS. The forecasting accuracy of this hybrid model is better than that of AR (1), linear regression, multilayer perceptron and radial basis function in 5 out of 8 datasets.
In [14], the work predicted the stock index trend of Prague stock exchange using Markov chain analysis with the help of the four models. Model 1 provides two basic states growth and decrease of time series Yt. Model 2 has eight states distinguishing different levels of growth and decrease of time series Yt. Model 3 has eight states distinguishing different levels of growth and decrease of time series Kt. Model 4 provides problem oriented filtering sequence of Kt.
The author proposed an integrated ANFIS model by adopting the ARMA concept into ANFIS model to predict the quarterly EPS [15]. The integrated model consists of testing the lag period using ARMA, processing inputs, training inputs using ANFIS and framing rules to predict the EPS. The performance evaluation of the proposed model is tested with mean error, mean squared error, mean absolute deviation, mean absolute percentage error and root mean squared error. The result of the fusion model outperforms the other models namely neural network, fuzzy logic, ANFIS and AR with ANFIS.
The study explored the capability of predicting EPS by expounding Markov process model [16]. The Markov prediction model consists of selecting input variable, data processing, classification of states, construction of state process, state probability, state transition probability matrix and forecasting the subsequent state probability of EPS.
The proposed prediction model is competitive and a complement one in prospective analysis.
3. THE PROPOSED MODEL
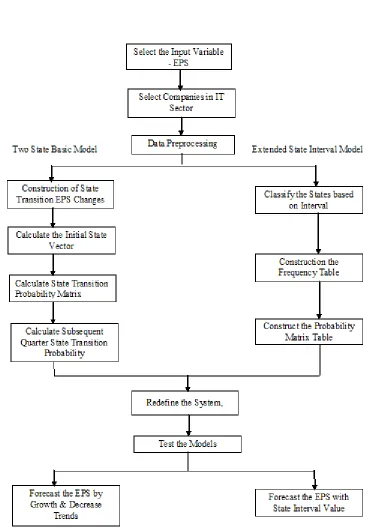
The system framework for forecasting process using Markov process approach with two state basic model & extended state interval model and their specific description is depicted in Figure 1.
The popular companies in IT sector consisted of HCL infosystem, Reliance, Infosys and Wipro. The quarterly EPS data of these 4 companies were gathered from BSE for the period starting from March 1998 to December 2011. The input data were preprocessed to facilitate the effective learning process and to increase the accuracy of the prediction model.
3.1. Two State Basic Model
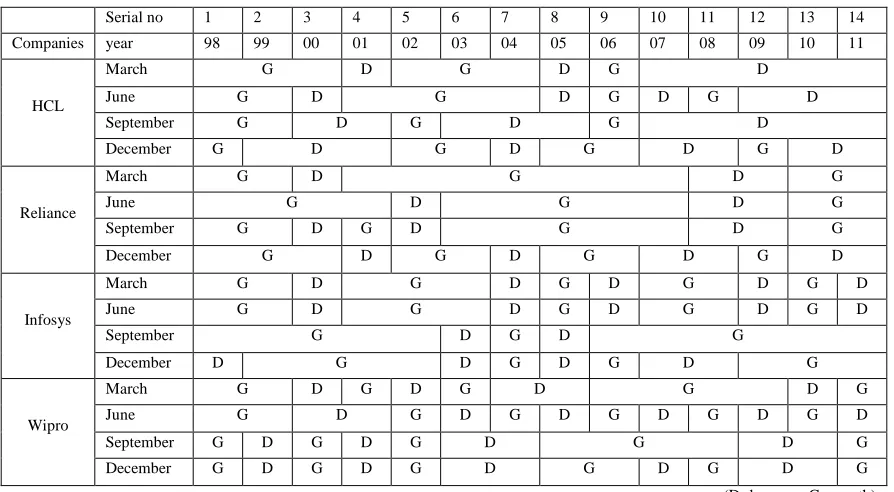
In this model EPS are considered as discrete time units and partitioned into growth and decrease states. The state transition of EPS is calculated by comparing the current quarter EPS value with the next quarter EPS value. If the current quarter EPS value is lesser than the next quarter EPS value then the state of the EPS is said to be as growth state otherwise it is said to be decrease state. The state transition of EPS changes for various quarters for the companies identified in IT sector are listed in Table 1.
The initial state vector is denoted by η(i) = (p1,p2,…pn) where i=1,2..n and pj is the probability of xj j=1,2..n. For HCL infosystem ending up with March quarter the initial state vector is calculated as follows: Let x1= growth state and x2= decrease state. Here x1= 7 and x2= 7.The probability of each
state is as follows: P1=
14 7 and P
2=
14
7 and the
initial state vector η(0) = (0.5, 0.5). Similarly we can obtain the initial state vector for the remaining companies. The initial state vectors for various quarters are listed in Table 2.
The construction strategy of state transition probability matrix analyse the state process and state probabilities information by Markov chain. The state transition probability matrix can be calculated by identifying the number of growth to growth, growth to decrease, decrease to growth and decrease to decrease transitions. In this case for
HCL infosystem P11 =
7 4
, P12 =
7 3
, P21 =
6 4
P22 =
6 2
. Similarly we can obtain the transition
probabilities for the remaining quarters. The state transition probability matrices for various quarters are listed in Table 3.
3.2. Extended State Interval Model
In this extended state model the quarterly EPS value is classified into various state intervals. Intelligent classification techniques used for classification of state intervals. In this case EPS of HCL infosystem ending up with March quarter are classified into three state intervals for better results. Similarly other companies EPS values are classified according to the EPS value using smart classification techniques. Table 4 lists the state intervals for all companies end up with March quarter. This table can be extended to other quarters also.
Once classification of state interval is identified then construction of state interval probability matrix is calculated. The last EPS value of HCL infosystem belongs to the state interval S1, the initial state vector η(0) = (1, 0, 0). All the EPS Values of HCL infosystem for March quarter comes under these three states S1, S2 and S3.The
state interval probability P11 =
5 2
, P12 =
5 1
, P13 =
5 2
,
P21 =
4 2
, P22 =
4 2
, P23 = 0, P31 =
4 1
, P32 =
4 1
,
P33 =
4 2
. Similarly the other companies state
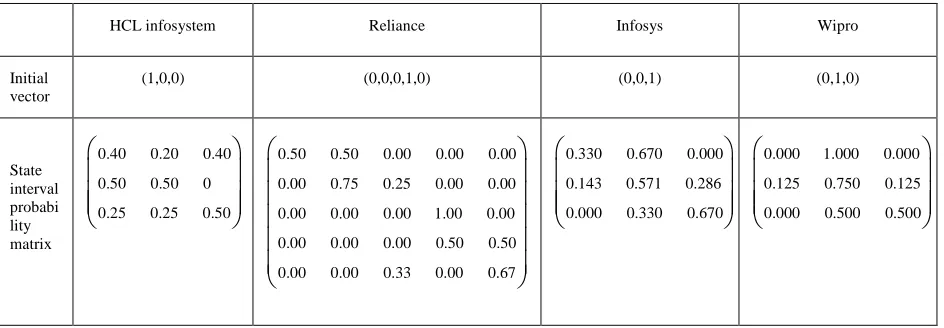
interval probability matrix is calculated using state interval transition. The initial state vector and state interval transition probability vector for this model is listed in Table 5.
4. RESULTS AND DISCUSSIONS
Forecasting EPS for the subsequent quarter is calculated by identifying the initial vector and the state transition matrix P. Using Markov chain prediction model the state probability of March 2012 and 2103 is calculated as follows: Since the last quarter of HCL infosystem is in decrease state, the initial vector is (0, 1) and the transition matrix
P = 0.5714 0.4286
0.3330 0.1670
.State probability vector of EPS on March 2012 can be identified asη(1) =η(0) * P = (0,1) *
0.5714 0.4286
0.3330 0.1670
=(0.3333,0.6667) and State probability vector of EPS on March 2013 as η(2) =η(1) * P =(0.3333,0.6667) *
0.5714 0.4286
0.3330 0.1670
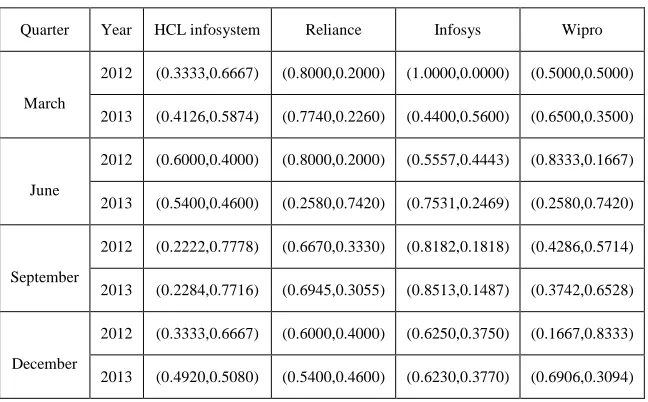
=(0.4126,0.5874). Thecalculation of subsequent EPS for the identified companies is listed in Table 6.
The quarter ending up with March 2012 for HCL infosystem is growth about the possibility of 33 percent and decrease about 67 percent whereas for Reliance growth about 80 percent and decrease about 20 percent. For Infosys growth is about 100 percent and decrease about 0 percent while for Wipro growth is about 50 percent and decrease about 50 percent. The quarter ending growth with March 2013 for HCL infosystem growth is about 41 percent and decrease about 59 percent whereas for Reliance growth is about 77 percent and decrease 23 percent. For Infosys growth is about 44 percent and decrease about 56 percent while for Wipro growth is about 65 percent and decrease about 35 percent. Similarly growth and decrease states can be inferred for different quarters ending up with June, September and December 2012 & 2013. Further when analyze the projection for the first quarter HCL infosystem and Infosys are inferred to be decrease trend whereas Reliance and Wipro show growth trend during the same quarter. Similarly the projection differs during other quarters. The summary of this projection inclusive of all 4 quarters shows optimistic for Reliance & Infosys in future. Wipro strikes a balance with growth trend and decrease trend while HCL infosystem gives a state of loss. The outcome of the forecasting is consistent in the real situation.
Forecasting state interval EPS value for the subsequent quarter for extended model is calculated by identifying the initial vector and the state transition matrix P. Since the last quarter EPS value is in state S1 for HCL infosystem the initial vector is (1, 0, 0). State probability vector of EPS on March 2012 can be identified as η(1) =η(0) * P =
(1,0,0) *
0.40 0.20 0.40
0.50 0.50 0
0.25 0.25 0.50
= (0.40,0.20,0.40) .
According to the data given in Table 7, the predicted EPS value for HCL infosystem is less than 4 which belongs to the state interval S1 and the same as the actual situation of 0.9. Similarly the predicted EPS of Infosys occurred in S3 which is greater than 30 and the same as the actual situation of 48.07. This method can be used to predict EPS value for various quarters with regard to the other two companies.
5. CONCLUSION
Any investor likes to have the complete financial picture of a company before decides to make investments. In spite of many investment tools that are available to analyse the financial positions of business, EPS is said to be the prime investment tool that detects the financial soundness and future prospects of a company in the business scenario thereby assist the investor to make wise decisions of investment. The results of the two state basic model and extended state interval model with time independent transition probability transition matrices to analyse and predict the EPS for subsequent quarters of HCL infosystem, Reliance, Infosys and Wipro are proposed and discussed. Markov process model poses to be more effective in analysing and predicting EPS than the other models thereby suiting perfectly to the fluctuating market conditions. The accuracy of the prediction model can be enhanced by introducing problem oriented filter procedures and computationally intelligent classification algorithm. Furthermore incorporating the Markov prediction model into fuzzy stochastic process leads significantly better accuracy and confidence. It is clear that in future EPS along with PE ratio may be used to carry out the market analysis for better results as they are the vital functions in the investment process.
REFRENCES:
[1] A. Seetharaman and John Rudolph Raj, “An empirical study on the impact of earnings per share on stock prices of a listed bank in Malaysia,” The International Journal of Applied Economics and Finance, Vol. 5, No. 2, 2011, pp. 114-126.
[2] A. Seetharaman, “Emergence of convertible debentures in Malaysia,” Akauntan nasional, Journal of Malaysian Institute of Accountant, Sep 1995.
[3] E. Zeytinoglu, “The impact of market-based ratio on stock returns: The evidence from insurance sector in turkemore,” International
Journal of Finance and Economics, Issue 84, 2012, pp. 41-48.
[4] H.L. Chang, Y.S. Chen, C.W. Su and Y.W. Chang, “The relationship between stock price and EPS: Evidence based on Taiwan panel data,” Economics Bulletin, Vol. 30, Issue 3, 2008, pp. 1-12.
[5] L. Brown, “Earnings forecasting research: its implications for capital market research,” International Journal of Forecasting, Vol. 9 1993, pp. 295-320.
[6] J. Jarret, “Forecasting seasonal time series of corporate earnings: A note,” Decision Sciences, Vol. 24. No. 4, 1990, pp. 888-896. [7] P.T. Elgers, M.H. Lo and D. Murray, “Note
on adjustments to analysts’ earnings forecasts based growth on systematic cross-sectional components of prior-period errors,” Management Science, Vol. 41, No. 8, 1995, pp. 1392-1396.
[8] Md. Rafiul Hassan and Baikunth Nath, “Stock market forecasting using hidden Markov model: A new approach,” Proceedings of the International Conference on Intelligent systems Design and Applications, Sep. 2005, pp. 192-196. [9] Deju Zhang and Xiaomin Zhang, “Study on
forecasting the stock market trend based on stochastic analysis method,” International Journal of Business and Management, Vol. 4, No. 6, June 2009, pp. 163-170.
[10] Yi-Fan Wang, Shihmin Cheng and Mei-Hua Hsu, “Incorporating the Markov chain concept into fuzzy stochastic prediction of stock indexes,” Applied Soft Computing, Vol. 10, Issue 2, March 2010, pp. 613-617. [11] Derran Hzu and Cheng-Huai Chiao,
“Relative accuracy of analysts’ earnings forecasts over time: A Markov chain analysis,” Review of Quntative Finance and Accounting, Vol. 37, Issue 4, 2011, pp. 477-507.
[12] Kevin J. Doubleday and Julius N. Esunge, “Application of Markov chains to stock trends”, Journal of Mathematics and Statistics, Vol. 7, Issue 2, 2011, pp.103-106. [13] L.Y. Wei, C.H. Cheng and H.H. Wu, “
Fusion ANFIS model based on AR for forecasting EPS of leading Industries,” International Journal of Innovative Computing, Information and Control, Vol. 7, No. 9, Sep. 2011, pp. 5445-5458.
Proceedings of International Conference on Mathematical Methods in Economics, Sep. 2012, pp. 848 – 853.
[15] M.P. Rajakumar and V. Shanthi, “Fusion model for forecasting the major indicator of leading industries,” Advances in Computational Sciences and Technology, Vol. 6, No. 1, 2013, pp.47 – 59.
Table 1. State Transition of EPS Changes
Serial no 1 2 3 4 5 6 7 8 9 10 11 12 13 14
Companies year 98 99 00 01 02 03 04 05 06 07 08 09 10 11
HCL
March G D G D G D
June G D G D G D G D
September G D G D G D
December G D G D G D G D
Reliance
March G D G D G
June G D G D G
September G D G D G D G
December G D G D G D G D
Infosys
March G D G D G D G D G D
June G D G D G D G D G D
September G D G D G
December D G D G D G D G
Wipro
March G D G D G D G D G
June G D G D G D G D G D G D
September G D G D G D G D G
December G D G D G D G D G D G
(D-decrease, G-growth)
Table 2. Initial State Vectors
Company March Quarter June Quarter September Quarter December Quarter
HCL infosystem (0.5000,0.5000) (0.5714,0.4286) (0.2857,0.7143) (0.5000,0.5000)
Reliance (0.7857,0.2143) (0.5000,0.5000) (0.7143,0.2857) (0.5714,0.4286)
Infosys (0.6429,0.3571) (0.7143,0.2857) (0.5714,0.4286) (0.5000,0.5000)
Table 3. State Transition Probability Matrix
Company March Quarter June Quarter September Quarter December Quarter
HCL infosystem 0.5714 0.4286 0.3330 0.1670
0.5000 0.5000 0.6000 0.4000
0.2500 0.7500 0.2222 0.7778
0.3333 0.6667 0.5714 0.4286
Reliance 0.8000 0.2000 0.6667 0.3330
0.1429 0.8571 0.8333 0.1667
0.6667 0.3333 0.7500 0.2500
0.5000 0.5000 0.6000 0.4000
Infosys 0.4400 0.5600 1.0000 0.0000
0.5557 0.4443 1.0000 0.0000
0.4280 0.5714 0.3333 0.6667
0.1667 0.8333 0.6000 0.4000
[image:9.612.204.412.397.511.2]Wipro 0.5000 0.5000 0.8000 0.2000
0.8000 0.2000 0.6667 0.3330
0.8182 0.1818 1.0000 0.0000
0.6250 0.3750 0.8000 0.2000
Table 4. State Interval for Extended Model
company S1 S2 S3 S4 S5
HCL infosystem < 4 4-8 >8
Reliance < 5 5-10 10-15 15-20 > 20
Infosys < 20 20-30 > 30
[image:9.612.72.544.542.706.2]Wipro < 5 5-10 > 10
Table 5. Initial State Vector & State Interval Probability Matrix - March Quarter
HCL infosystem Reliance Infosys Wipro
Initial vector
(1,0,0) (0,0,0,1,0) (0,0,1) (0,1,0)
State interval probabi lity matrix
0.40 0.20 0.40
0.50 0.50 0
0.25 0.25 0.50
0.50 0.50 0.00 0.00 0.00
0.00 0.75 0.25 0.00 0.00
0.00 0.00 0.00 1.00 0.00
0.00 0.00 0.00 0.50 0.50
0.00 0.00 0.33 0.00 0.67
0.330 0.670 0.000
0.143 0.571 0.286
0.000 0.330 0.670
0.000 1.000 0.000
0.125 0.750 0.125
0.000 0.500 0.500
Table 6. Forecasting EPS for Subsequent Quarter
Quarter Year HCL infosystem Reliance Infosys Wipro
March
2012 (0.3333,0.6667) (0.8000,0.2000) (1.0000,0.0000) (0.5000,0.5000)
2013 (0.4126,0.5874) (0.7740,0.2260) (0.4400,0.5600) (0.6500,0.3500)
June
2012 (0.6000,0.4000) (0.8000,0.2000) (0.5557,0.4443) (0.8333,0.1667)
2013 (0.5400,0.4600) (0.2580,0.7420) (0.7531,0.2469) (0.2580,0.7420)
September
2012 (0.2222,0.7778) (0.6670,0.3330) (0.8182,0.1818) (0.4286,0.5714)
2013 (0.2284,0.7716) (0.6945,0.3055) (0.8513,0.1487) (0.3742,0.6528)
December
2012 (0.3333,0.6667) (0.6000,0.4000) (0.6250,0.3750) (0.1667,0.8333)
2013 (0.4920,0.5080) (0.5400,0.4600) (0.6230,0.3770) (0.6906,0.3094)
Table 7. State Interval of EPS - March 2012 Quarter
HCL infosystem Reliance Infosys Wipro
March Quarter S1 S5 S3 S2
Predicted EPS < 4 > 20 > 30 5-10