ANALYSIS OF THE TEMPERATURE INFLUENCE ON
GALVANIC CORROSION AND MATHEMATICAL MODEL
1,2CHUNLI WANG, 1,2JIANHUA WU, 3QINGFEN LI
1College of Materials Science and Chemical Engineering, Harbin Engineering University, Harbin 150001,
Heilongjiang, China
2
State Key Laboratory for Marine Corrosion and Protection, Luoyang Ship Materials Research Institute, Xiameng 361002, Fujian, China
3College of Mechanical and Electrical Engineering, Harbin Engineering University, Harbin 150001,
Heilongjiang, China
ABSTRACT
The general and galvanic corrosion of high strength steel (980), high strength steel (907) and high strength steel (921A) in seawater at elevated temperatures has been analyzed using electrochemical measurements and a zero-resistance ammeter (ZRA). After the tests, the surface morphologies of the samples have been detected by SEM. Results show galvanic corrosion behavior of 980/907/921A fulfill the mixed potential theory, 921A acts as the anode and both 980 and 907 act as the cathodes. These results using ZRA have been compared with results estimated from the polarization curves according to the mixed potential theory (imposed potential measurements). The effect of temperature on the galvanic corrosion estimated using both types of measurements are basically in agreement, since temperature increases the galvanic current density of the pair in both cases. The galvanic current density with increasing temperature is estimated by the exponential function.
Keywords: Galvanic Corrosion, Temperature, Seawater, High Strength Steel
1. INTRODUCTION
Galvanic corrosion is originally defined as the enhanced corrosion between two or more electrically connected “dissimilar metals” [1]. The galvanic corrosion is stimulated because of the potential difference existed among the different metals in ocean engineering structures that a lot of metal materials are widely used. The effect of coupling different metals/alloys together, either directly or through an external path, increases the corrosion rate of the anodic alloy and reduces or suppresses the corrosion rate of the cathodic alloy. When two different metals or alloys are coupled together, the metal or alloy with the more negative potential undergoes anodic dissolution [2-4]. On the surface of the more positive alloy, these excess electrons are consumed by a cathodic reaction that, in seawater, is usually oxygen reduction. The driving force for galvanic corrosion is the potential difference between two or more metals or alloys in a conductive medium that generates current flow between the anodic and cathodic members. The extent of galvanic corrosion between two or more coupled dissimilar alloys depends on other factors such as the temperature, effective area ratio of the
anodic vs. cathodic members, solution conductivity and the stability of passive films and so on [5-8].
Several authors have studied galvanic corrosion in seawater in the fields of bimetal coupling system. However, studies on the galvanic corrosion in the fields of multimaterial coupling system(more than two dissimilar metals electrically connected)in seawater is scarce in the literature.
The objective of this work was to study the effect of temperature on the galvanic corrosion between three high strength steel (980/907/921A) in seawater (three alloys electrically connected in existence in the real-world engineering structures).
2. EXPERIMENTAL DETAILS
The materials tested were the high strength steel 980(0.1% C, 0.25% Si, 0.56% Mn, 0.04% S, 4.56% Ni , 0.54% Cr, 0.39% Mo, 0.06% V, Bal. Fe), the high strength steel 907 (0.1% C, 0.63% Si, 0.97% Mn, 0.012% P, 0.06% S, 0.64% Ni , 0.70% Cr, Bal. Fe) and the high strength steel 921A (0.12% C, 0.33% Si, 0.37% Mn, 0.08% P, 0.04% S, 2.27% Ni , 1.05% Cr, 0.24% Mo, 0.08% V, Bal. Fe). The test samples with a size of 60mm×20mm
ISSN: 1992-8645 www.jatit.org E-ISSN: 1817-3195
whose surfaces were wet abraded from 100 SiC (silicon carbide) grit to 600 SiC grit then degreased with acetone and rinsed with absolute alcohol. And then measuring the sizes of specimen covered partially by use of Model AB glue in order to determine the working areas of materials of galvanic couples to 10cm2. The specimens were stored in desiccators before use. Measurements were carried out in natural seawater collected from the North Yellow Sea and off the Qingdao Coast.
To carry out the galvanic corrosion test, the three metals were immersed face to face at each vertex of equilateral triangle with sides of 8cm in stagnant seawater programmable temperature and humidity chamber Model ESS-SDJ201 then connected and their common potentials were followed with time until constancy (shown in Figure 1).
8cm sample
SCE
8cm
[image:2.612.338.490.471.710.2]8cm
Figure 1: Layout Diagram Of Samples In The Multimaterial Galvanic System
Potentiodynamic polarization measurement was conducted using electrochemical workstation IM6. Potential sweep rate was 0.1667mV·s-1. Rectangle test specimens, sized 10mm×10mm×5mm, were made from the coupled materials. Before the tests, the sample surfaces were pretreated with the same method as above. And then measuring the sizes of specimen covered partially by use of Model AB glue in order to determine the working areas to 1cm2. The specimens were stored in desiccators before use.
In test the galvanic corrosion currents were measured over a zero-resistance ammeter (ZRA). A detailed description of this type of measurement is given elsewhere [9]. By inserting a ZRA in the electrical circuit that connects three members, it was possible to measure the galvanic current between members and simultaneously, the galvanic potential was registered against a saturated calomel electrode (SCE) as a reference electrode. The galvanic current and potential were measured at sampling rate of 1 point h-1. The ZRA was program-ed to record 240 points potential and current plots for each hour of total 240 h measurement duration. Corrosion tests were carried out at 0, 5, 15, 35, 45 and 65°C. After 240h, the corrosion samples were removed from the chamber and rinsed with deionized water. The surface morphologies of the samples were detected by SEM in order to estimate
the possible micro-structural variations. Energy dispersive X-ray analysis (EDX) was adopted to trace the galvanic corrosion production.
3. RESULTS AND DISCUSSIONS
3.1The Self-Corrosion Behavior of the Alloys
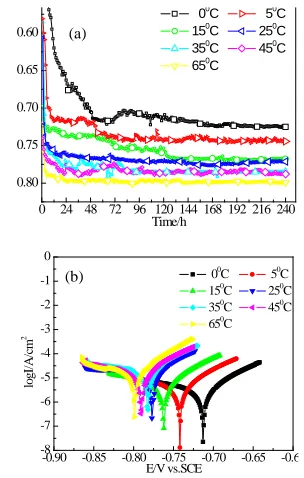
Figure 2(a), (c) and (e) respectively shows the self-corrosion potential data plots of 921A, 907 and 980 at 0, 5, 15, 35, 45 and 65°C. It can be seen that the selfcorrosion potential of 921A varies from -0.702 to -0.798 V, and it decreases about 0.1V with the increase of temperature. In comparison with the 921A, the self-corrosion potential of 907 and 980 varies respectively from -0.725 to -0.789V and from -0.654 to -0.748V, and they also exhibit a maximum drop of 0.65V and 0.1V as temperature increases due to the general acceleration of corrosion with temperature.
Figure 2(b), (d) and (f) shows that the polariz-ation curves of the three materials rightward shift obviously with the increase of temperature. Consequently, the corrosion rate increases with increasing temperature. Accordingly, the corrosion rates (CRs) of the three materials increases slightly at temperature from 0 up to 25°C, and then CRs increased greatly above 25°C.
A conclusion can be drawn from Figure 2 that the order of corrosion sensitivity of the uncoupled single phases is: 980 < 907 < 921A.
0 24 48 72 96 120 144 168 192 216 240
0.80 0.75 0.70 0.65 0.60
00C 50C
150C 250C
350C 450C
650C
Time/h
-0.90 -0.85 -0.80 -0.75 -0.70 -0.65 -0.6
-8 -7 -6 -5 -4 -3 -2 -1 0
lo
gI
/A
/c
m
2
E/V vs.SCE 00
C 50
C 150
C 250
C 350
C 450
C 650
C
(a)
0 24 48 72 96 120 144 168 192 216 240 0.80 0.75 0.70 0.65 0.60
0 C 5 C 150C 250C
350C 450C
650C
Time(h)
-0.90 -0.85 -0.80 -0.75 -0.70 -0.65 -0.6
-8 -7 -6 -5 -4 -3 -2 -1 0 lo gI /A /c m 2 E/V vs.SCE 00
C 50
C 150
C 250
C 350C 450C 650
C
0 24 48 72 96 120 144 168 192 216 240
0.75 0.70 0.65 0.60 0.55
0.50 0
0C 50C
150C 250C
350C 450C
650C
Time(h)
-0.85 -0.80 -0.75 -0.70 -0.65 -0.60 -0.55
-8 -7 -6 -5 -4 -3 -2 -1 0 lo gI /A /c m 2 E/V vs.SCE 00
C 50
C 150
C 250
C 350
C 450
C 650
[image:3.612.87.525.66.564.2]C
Figure 2:Potential And Polarization Curve At 0, 5,15,
25, 35, 45 And 65°C: (A) Potential Of 921A, (B) Polarization Curve Of 921A, (C) Potential Of 907, (D)
Polarization Curve Of 907, (E)Potential Of 980, (F) Polarization Curve Of 980
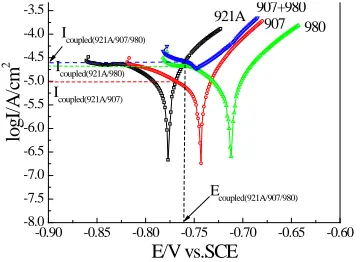
For example, the self-corrosion potential of 980 is more than about 0.04V to that of 907 and about 0.05V to that of 921A at 65°C. In addition, status is almost similar at 0, 5, 15, 25, 35 and 45°C. Therefore, the high strength steel (921A) would acts as the anode and both the high strength steel (907) and the high strength steel (980) act as the cathodes in multimaterial system.
In general, at the mixed potential ( Econple ) of
multiphase material systems the conditions
anode cathode
i i
∑ = ∑ has to be fulfilled to maintain charge neutrality [10]. For 980, 907 and 921A this condition can be fulfilled if 921A acts as the anode and both 980 and 907 act as the cathodes. Accordingly, Econple for three coupled steels is a
consequence of i921A =i907+i980 . For example, in
Figure 3, the estimated value obtaines from superposition of potentiodynamic polarization of
conple
E for the three alloys composition is -0.765V.
-0.90 -0.85 -0.80 -0.75 -0.70 -0.65 -0.60
-8.0 -7.5 -7.0 -6.5 -6.0 -5.5 -5.0 -4.5 -4.0 -3.5 907+980 Icoupled(921A/980) Icoupled(921A/907) Icoupled(921A/907/980) Ecoupled(921A/907/980) 921A 907 980 lo g I/A /c m 2 E/V vs.SCE
Figure 3: The Plots Of Potentiodynamic Polarization For 921A, 907 And 980 At 25°C
3.2 Galvanic Current Density and Potential
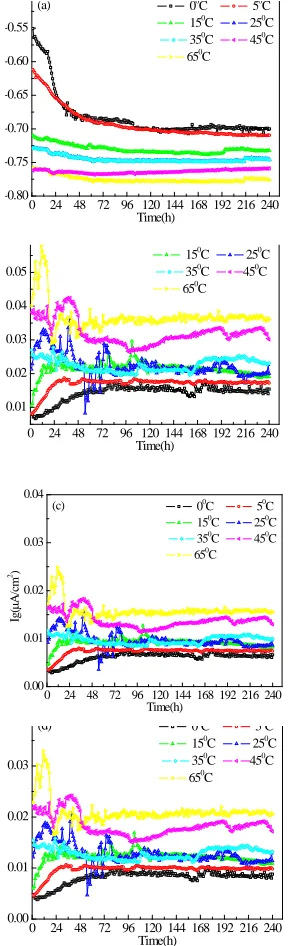
Figure 4(a) shows the galvanic potential registered between 980, 907 and 921A in seawater at 0°C to 65°C. The galvanic potential shifted to more negative values during the two days and it tended to stabilize from the third day at any temperature. The increase of temperature caused the galvanic potential to shift to more negative values with acceleration of corrosion.
Results of the galvanic current density (Ig)
921A 907 980
i =i +i shown in Figure 4(b), (c) and (d) demonstrate that 921A acts as the anode and both 980 and 907 act as the cathodes in show system. Because at the mixed potential ( Econple ) of
multimaterial systems the conditions ∑ianode = ∑icathodehas
to be fulfilled to maintain charge neutrality[10]. For 980, 907 and 921A this condition can be fulfilled when 921A acts as the anode and both 980 and 907 act as the cathodes.
It can be found obviously that changes in temperature can cause an increase of the galvanic current density. Furthermore, in Figure 4(b), (c) and (d), it is clearly seen that Ig line of both 0°C and (c)
(d)
(e)
[image:3.612.98.300.77.576.2] [image:3.612.331.512.251.382.2]ISSN: 1992-8645 www.jatit.org E-ISSN: 1817-3195
65°C has an obvious distance with 15°C and 45°C (medium temperature), which indicates the small influence on CRs at the medium temperature compared with low and high temperature.
0 24 48 72 96 120 144 168 192 216 240
-0.80 -0.75 -0.70 -0.65 -0.60 -0.55
00
C 50
C 150
C 250
C 350C 450C 650
C (a)
Time(h)
0 24 48 72 96 120 144 168 192 216 240
0.01 0.02 0.03 0.04 0.05
150
C 250
C 350
C 450
C 650
C
Time(h)
0 24 48 72 96 120 144 168 192 216 240
0.00 0.01 0.02 0.03 0.04
00
C 50
C 150
C 250
C 350
C 450
C 650
C (c)
Ig(
µ
A/
cm
2)
Time(h)
0 24 48 72 96 120 144 168 192 216 240
0.00 0.01 0.02 0.03
0 C 5 C 150
C 250
C 350
C 450
C 650
C (d)
[image:4.612.121.265.145.618.2]Time(h)
Figure 4: Galvanic Potential And Galvanic Current Density Of 980, 907 And 921A Coupling In Seawater For 240h At 0, 5,15, 25, 35, 45 And 65°C: (A) Galvanic
Potential, (B) Ig Of 921A, (C) Ig Of 980,(D) Ig Of 907
Figure 5 shows galvanic current density between 980, 907 and 921A in seawater at 0, 5, 15, 25, 35, 45 and 65°C by both types of measurements (potentiodynamic polarization and ZRA). The fitting curves of Ig by both types of measurements
are similar parabolas using the exponential
functions of y=0.0153e0.0128x(R2=0.9902) (ZRA)
and 0.0121 2
0.0147 x( 0.9927)
y= e R = (potentiodynamic
polarization) respectively. Two methods reflecting the severity of galvanic corrosion are basically in agreement. Moreover, the parabolas increase by degree. As is known, Ig are important measuring indexes for investigating galvanic corrosion, which reflects the behaviors of galvanic corrosion exactly.
-10 0 10 20 30 40 50 60 70
0.01 0.02 0.03
y = 0.0147e0.0121x
(R2
= 0.9927) y = 0.0153e0.0128x
(R2
= 0.9904)
IgZRA
Igpotentiodynamic polarization
Fit
g(
µ
)
Temperature/ 0
[image:4.612.346.486.213.323.2]C
Figure 5:Galvanic Current Density Of 980, 907 And
921A Coupling In Seawater At 0, 5,15, 25, 35, 45 And 65°C
3.3 Micro-structural Examination
Figure 6 presents SEM micrographs of the three alloy members’ surface obtained after self-corrosion and electrically connected for 240h immersed in natural seawater at 65℃. It can be seen that 921A as anode suffers from corrosion greater than that of self-corrosion (Figure 6a(2),(3)), both 980 and 907 as cathodes suffers from corrosion lighter than that of self-corrosion.(Figure. 6b(2),(3) and 6c(2),(3)).
a(1)
a(2)
a(3)
b(1)
b(2)
b(3)
c(1)
ISSN: 1992-8645 www.jatit.org E-ISSN: 1817-3195
Figure 6:The Surfaces Morphology Of 921A, 907 And
980 For 240h Immersed In Seawater At 65℃(500x):
A(1),(2) 921A, B(1),(2)907 And C(1),(2)980 Show Corrosion Products And Surfaces Rinsed Respectively After Electrically Connected. A(3) 921A, B(3)907 And C(3)980 Show Surfaces Rinsed Of Self-Corrosion For
240h
4. CONCLUSION
The electrochemical behavior of high strength steel 980/907/921A has been characterized in natural seawater at 0, 5, 15, 25, 35, 45 and 65°C for 240h. The following conclusions can be drawn:
(i) The order of corrosion sensitivity of the uncoupled single phases is: 980 < 907 < 921A.
(ii) Galvanic corrosion of 980/ 907/ 921A fulfills the mixed potential theory, 921A acts as the anode and both 980 and 907 act as the cathodes. The galvanic reaction is mainly governed by the anodic oxidation of the 921A, which is the highest active and least polarized.
(iii) Temperature is an important influencing factor determining the corrosion rate of galvanic corrosion. An increase in temperature will accelerate galvanic corrosion. The fitting curves of Ig by both types of measurements (ZRA and potentiodynamic polarization) are similar parabolas
using the exponential functions of 0.0128
0.0153 x
y= e
2
(R =0.9902) and 0.0121 2
0.0147 x( 0.9927)
y= e R =
respectively. The two methods reflecting the severity of galvanic corrosion are basically in agreement.
ACKNOWLEDGEMENTS
This work was supported by “the Fundamental Research Funds for the Central Universities” (HEUCFZ1124, HEUCF100213).
REFERENCES:
[1] K.R. Trethewey, D.A. Sargeant, “The galvanic effect: a continuing corrosion problem”, Metals
and Materials,Vol. 8, 1992, pp. 378-382.
[2] R. Baboian, H. Bardner, “Reducing corrosion in aluminium-steel joints”, Automotive Engineering, vol. 102, 1994, pp. 103-105.
[3] F. E. Varela, Y. Kuratat, N. Sanada, “The influence of temperature on the galvanic corrosion of a cast iron-stainless steel couple (prediction by boundary element method)”,
Corrosion Science, Vol. 39, No. 4, 1997, pp.
775-788.
[4] Guangling Song, Birgir Johannesson, Sarath Hapugoda, “Galvanic corrosion of magnesium alloy AZ91D in contact with an aluminium alloy, steel and zinc”, Corrosion Science, Vol. 46, No. 4, 2004, pp. 955-977.
[5] R. Akid, D.J. Mills, “A comparison between conventional macroscopic and novel micro-scopic scanning electrochemical methods to evaluate galvanic corrosion”, Corrosion
Science, Vol. 43, No. 7, 2001, pp.1203-1216.
[6] E. Blasco-Tamarit, A. Igual-Munoz, J. Garcra Anton, “Effect of temperature on the galvanic corrosion of a high alloyed austenitic stainless steel in its welded and non-welded condition in LiBr solutions”, Corrosion Science, Vol. 49, No. 12, 2007, pp. 4472-4490.
[7] John W. Fu and Siu-Kee Chan, “Finite element modeling of galvanic corrosion during chemical cleaning of Westinghouse series 51 steam generator”, Mathematical Modelling, Vol. 8, 1987, pp. 289-294.
[8] C.M. Abreu, M.J. Cristobal, M.F. Montemor, “Galvanic coupling between carbon steel and austenitic stainless steel in alkaline media”,
Electrochimica Acta, Vol. 47, No. 13-14, 2002,
pp. 2271-2279.
[9] F.T. Cheng, K.H. Lo, H.C. Man, “NiTi cladding on stainless steel by TIG surfacing process”,
Surface and Coatings Technology, Vol. 172, No.
2-3, 2003, pp. 308-315.
[10] A.A. Elmoneim, A. Gebert, “Electrochemical characterization of galvanically coupled single phases and nanocrystalline NdFeB-based magnets in NaCl solutions”, Journal of Applied
Electrochemistry, Vol. 33, 2003, pp. 795-805.