1757
EMPIRICAL STUDIES OF GREEN SUPPLY CHAIN
MANAGEMENT PERFORMANCE EVALUATION BASED ON
THE ANP
1XIAOHUA CHEN, 2GUOYI XIU 1
Doctor of philosophy, College of Management, Harbin University of Science and Technology, 150040
2 President of the College, College of Economic, Harbin University of Science and Technology, 150040
E-mail: [email protected], [email protected]
ABSTRACT
With the growing concern with our environment, the practice degree of green supply chain management I attractgetting more and more attention from academic and industry. Therefore, studying green supply chain management practice is a very meaningful work. Green supply chain management performance appraisal will involve a lot of indicators, and there are usually have dependence and feedback relationship between the various indicators. Therefore, this paper introduces how to use the ANP method to solve the problem effectively. This paper uses the Super Decisions 1.6.0 software to calculate the final weight of the network layer indicators, and assesses the performance level of three enterprises which have different implementation degree in green supply chain. Green supply chain management performance evaluation index system and the network model are established by the network level, which provide an effective solution for green supply chain management performance appraisal. The empirical research results prove the method are scientific and feasibile to solve the problem of green supply chain management performance appraisal.
Keywords: Analytic network process, Green supply chain management, Performance appraisal,
Empirical
1. INTRODUCTION
As the environmental regulations continuous perfect and increasing consumer pressure, more and more enterprises include the environmental protection concept into the strategic planning schedule. With the intensification of economic globalization and information technology, the market competition is no longer the competition between enterprises, but the competition between the supply chain and another supply chain, and enterprises’ competition changes from the “point-to-point”competition to “chain on the chain” competition. In this context, in order to obtain and maintain the competitive advantage, and in order to achieve the dual goals of corporate profits and market share, it has become an important strategy for the manufacturing enterprises that they should both improve economic efficiency and inlcude the environmental philosophy into the supply chain management which has become an important strategy for the manufacturing companies.
Based on the classification of the corporate strategy environment, the enterprises which
implement green supply chain management can be divided into three categories: active enterprises, following enterprises and passive enterprises. And active enterprises do best in supply chain management practices, the following enterprises followed, and the passive enterprises do worst.This paper studies the degree of green supply chain management practices of Chinese manufacturing enterprises, and whether the green supply chain management practices can help enterprises to improve their performance.
2. TRAINING OF ANN PARAMETERS
2.1 Literature Review
1758 a definition about the environmental supply chain management in 2004, “green supply chain management is the integrated management of logistics and information flow, which can meet the customer demand for green products and green services through a series of green processes”. Vachon [6] proposed that supply chain could maintain internal health and sustainability based on the external environment information, and their own regulatory function. The enterprises in the supply chain. The enterprises in the supply chain realized that customers increasingly inclined to products and services that they did no harm to the environment, so more and more enterprises supported the implementation of the green supply chain. Sen, Barratt and Oke,and Handfield et al. [7-9]believed that implement environmental sustainability timely and green supply chain could make the enterprises gain a competitive advantage in the supply chain. Jorgensen and Wilcoxen [10] did quantitative analysis about pollution cost control of goods and services in the U.S. economy. Jaffe et al. [11]asserted that there is little evidence to prove that the environmental regulation did harm to competitive. Therefore, we needed more empirical research to prove environmentally sustainable regulation had an important impact on
the competitiveness of enterprises. Zhu et al.,
Vachon,Klassen,Wee and Quazi[12-14] had
done preliminary research work on environmental sustainability indicators and their evaluation scale.
2.2 Hypotheses
There are two hypotheses in this paper:
Hypotheses 1: There are different types of green supply chain management level in Chinese manufacturing enterprises.
Hypotheses 2: The better green supply chain management implement, the better performance improvement can be abtained.
3. EMPIRICAL STUDIES OF GSCM
PERFORMANCE EVALUATION BASED ON THE ANP
Green supply chain performance evaluation is a multi-objective decision that creates problems of the limited program. Because the evaluation indicators are not entirely independent, and there are many dependent and affect relations between the indicators, constructing a network architecture model can sove such problems, and the method can make the assessment process more scientific and reasonable.
According to the experts’ suggestions about the performance appraisal indicators and the surveys, this paper will assess green supply chain management performance of three types of enterprises (active enterprises, to follow the enterprise and passive Enterprises) using the Super Decisions software. The implementation steps are as follows:
3.1 Building The ANP Model About Performance Appraisal
The choices of assessment indicators have a direct impact on the results of the assessment. Zhu
Qinghua,Geng Yong,Kenneth W. Green Jr,
Pamela J. Zelbst, Jeramy Meacham, Vikram S. Bhadauria did a certain degree study to the green supply chain management practices performance appraisal indicators.. Zhu Qinghua and Geng Yong (2006)[15] analyzed the green supply chain practice performance evaluation index system based on the survey data and factor analysis method, and extracted three evaluation factors which were environmental performance, operational performance and economic performance. On this basis, Kenneth W. Green Jr, Pamela J. Zelbst,
Jeramy Meacham, Vikram S. Bhadauria(2011)
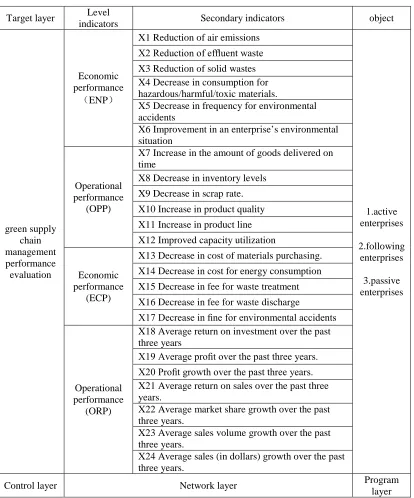
[16]increased organizational performance evaluation factors , and evaluated green supply chain management practice performance from four dimensions, environmental performance, operational performance, economic performance and organizational performance, and built up green supply chain management performance appraisal index system. On the basis of these scholars, this paper builds a green supply chain management performance appraisal model. The index system is shown in Table 1.
The ANP network model by the Super Decisions software is shown in Figure 1.There are feedback and internal and external dependency relationship in the network diagram, and it can describe the most realistic decision-making problem, so this network diagram is universal.The network has a certain representation for the green supply chain performance evaluation in this paper. The interaction of the factors in the network diagram is indicated by arrows, and the direction of the arrow indicates the dominant role of an element (elements set) to another element (element set).
3.2 Construct Judgment Matrix
1759 This paper invited some experts to rate the importance of the element or elements set based on a scale of 1 to 9 , thus the score of every element is obtained. 1,3,5,7,9 is respectively equally important, slightly important, more important, it is important as well as a certain element to the other elements, and 2, 4, 6, 8 is the range between the above two judgments which is corresponding to the
[image:3.612.102.516.202.700.2]intermediate state of the scale, while the reciprocal of 1 to 9 represents the degree of importance to the contrary between the two elements. In order to obtain more objective and accurate results, we invited a number of experts to score, and then take the mean of all the results as the importance score of each indicator.
Table 1 The Appraisal Index System Of Green Supply Chain Management Performance
Target layer Level
indicators Secondary indicators object
green supply chain management performance evaluation
Economic performance
(ENP)
X1 Reduction of air emissions
1.active enterprises
2.following enterprises
3.passive enterprises X2 Reduction of effluent waste
X3 Reduction of solid wastes X4 Decrease in consumption for hazardous/harmful/toxic materials.
X5 Decrease in frequency for environmental accidents
X6 Improvement in an enterprise’s environmental situation
Operational performance
(OPP)
X7 Increase in the amount of goods delivered on time
X8 Decrease in inventory levels
X9 Decrease in scrap rate.
X10 Increase in product quality
X11 Increase in product line
X12 Improved capacity utilization
Economic performance
(ECP)
X13 Decrease in cost of materials purchasing.
X14 Decrease in cost for energy consumption
X15 Decrease in fee for waste treatment
X16 Decrease in fee for waste discharge
X17 Decrease in fine for environmental accidents
Operational performance
(ORP)
X18 Average return on investment over the past three years
X19 Average profit over the past three years. X20 Profit growth over the past three years. X21 Average return on sales over the past three years.
X22 Average market share growth over the past three years.
X23 Average sales volume growth over the past three years.
X24 Average sales (in dollars) growth over the past three years.
Control layer Network layer Program
1760
Figure 1 The ANP Network Model Figure 2 The Importance Determine Matrix Based On
Environmental Performance This paper must build a lot of judgment matrix,
and take one of judgment matrix for example which is as shown in Figure 2. The vale of CR is 0.075 by Super Decisions software, less than 0.1, and it is conducted through the consistency test. The establishment and test of the other matrix are similar to this process. During the process of the consistency checking, if the CR value is greater than 0.1, then we believe there are obvious mistakes about the assignment of it. And those matrix are not satisfied to the consistency, it requires the re-assignment from the expert, and then continue to test their’s consistent until it
satisfy the consistency test.
3.3 Matrix Calculation
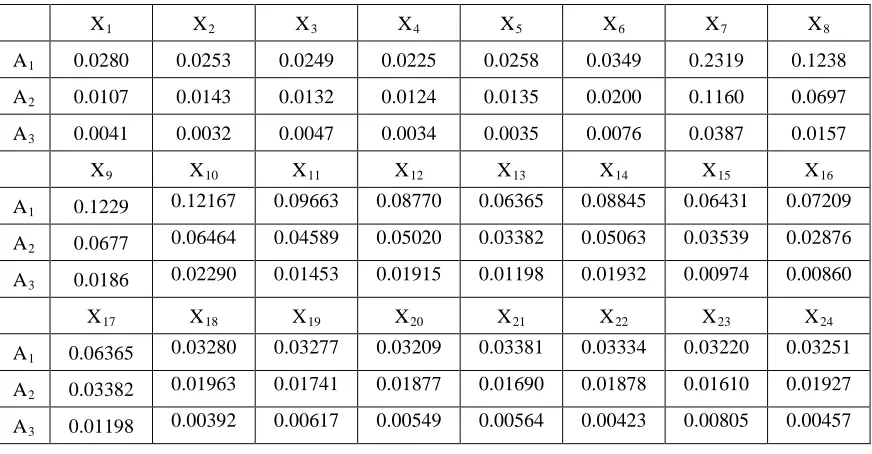
In this model, the control layer is only one objective criterion. After all matrix are built and the consistency test is satisfied , we can use the ANP software to compute the unweighted super matrix, and the result is shown in Table 2.
[image:4.612.304.515.78.293.2]The weight value of a partial weighting value for each sub-criteria weight which is multiplied by the corresponding standards, we can obtain a weighted super matrix, and the result is shown in Table 3.
Table 2 The Unweighted Super Matrix Of Green Supply Chain Management Performance Evaluation
X1 X2 X3 X4 X5 X6 X7 X8
A1 0.0280 0.0253 0.0249 0.0225 0.0258 0.0349 0.2319 0.1238
A2 0.0107 0.0143 0.0132 0.0124 0.0135 0.0200 0.1160 0.0697
A3 0.0041 0.0032 0.0047 0.0034 0.0035 0.0076 0.0387 0.0157
X9 X10 X11 X12 X13 X14 X15 X16
A1 0.1229 0.12167 0.09663 0.08770 0.06365 0.08845 0.06431 0.07209
A2 0.0677 0.06464 0.04589 0.05020 0.03382 0.05063 0.03539 0.02876
A3 0.0186 0.02290 0.01453 0.01915 0.01198 0.01932 0.00974 0.00860
X17 X18 X19 X20 X21 X22 X23 X24
A1 0.06365 0.03280 0.03277 0.03209 0.03381 0.03334 0.03220 0.03251
A2 0.03382 0.01963 0.01741 0.01877 0.01690 0.01878 0.01610 0.01927
[image:4.612.89.525.493.720.2]1761
Table 3 The Weighted Super Matrix Of Green Supply Chain Management Performance Evaluation
X1 X2 X3 X4 X5 X6 X7 X8
A1 0.02804 0.02534 0.02490 0.02250 0.02581 0.03493 0.23190 0.12380
A2 0.01070 0.01427 0.01323 0.01238 0.01349 0.01999 0.11595 0.06971
A3 0.00408 0.00321 0.00469 0.00341 0.00353 0.00763 0.03865 0.01570
X9 X10 X11 X12 X13 X14 X15 X16
A1 0.12294 0.12167 0.09663 0.08770 0.06365 0.08845 0.06431 0.07209
A2 0.06766 0.06464 0.04589 0.05020 0.03382 0.05063 0.03539 0.02876
A3 0.01862 0.02290 0.01453 0.01915 0.01198 0.01932 0.00974 0.00860
X17 X18 X19 X20 X21 X22 X23 X24
A1 0.06365 0.03280 0.03277 0.03209 0.03381 0.03334 0.03220 0.03251
A2 0.03382 0.01963 0.01741 0.01877 0.01690 0.01878 0.01610 0.01927
A3 0.01198 0.00392 0.00617 0.00549 0.00564 0.00423 0.00805 0.00457
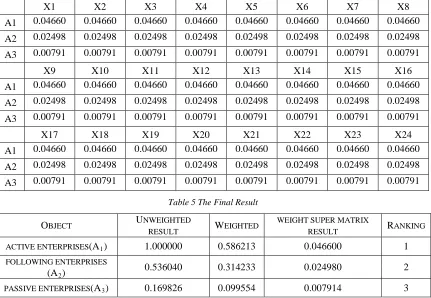
Table 4 The Weight Super Matrix Of Green Supply Chain Management Performance Evaluation
X1 X2 X3 X4 X5 X6 X7 X8
A1 0.04660 0.04660 0.04660 0.04660 0.04660 0.04660 0.04660 0.04660
A2 0.02498 0.02498 0.02498 0.02498 0.02498 0.02498 0.02498 0.02498
A3 0.00791 0.00791 0.00791 0.00791 0.00791 0.00791 0.00791 0.00791
X9 X10 X11 X12 X13 X14 X15 X16
A1 0.04660 0.04660 0.04660 0.04660 0.04660 0.04660 0.04660 0.04660
A2 0.02498 0.02498 0.02498 0.02498 0.02498 0.02498 0.02498 0.02498
A3 0.00791 0.00791 0.00791 0.00791 0.00791 0.00791 0.00791 0.00791
X17 X18 X19 X20 X21 X22 X23 X24
A1 0.04660 0.04660 0.04660 0.04660 0.04660 0.04660 0.04660 0.04660
A2 0.02498 0.02498 0.02498 0.02498 0.02498 0.02498 0.02498 0.02498
[image:5.612.93.524.333.631.2]A3 0.00791 0.00791 0.00791 0.00791 0.00791 0.00791 0.00791 0.00791
Table 5 The Final Result
OBJECT UNWEIGHTED
RESULT WEIGHTED
WEIGHT SUPER MATRIX
RESULT RANKING
ACTIVE ENTERPRISES(A1) 1.000000 0.586213 0.046600 1
FOLLOWING ENTERPRISES (A2)
0.536040 0.314233 0.024980 2
PASSIVE ENTERPRISES(A3) 0.169826 0.099554 0.007914 3
Calculate the limit super-matrix. Normalization processing the weight super matrix, we can obtain the limit super matrix. Due to the dependent relationship and the feedback elements, the normalization process is a iterative gradual stabilization process. In the limit super-matrix, each column value is the relative priority of each element corresponding element in the column under
the guidelines limit. The weight super matrix through Super Decisions software is shown in Table 4.
1762
4. CONCLUSION
The results of the empirical study confirmed the initial assumption: there are different types of green supply chain management practices, which are the initiative enterprises, following the enterprise and passive enterprise; Different implementation degree of green supply chain management can lead to different performance improvement level.
REFRENCES:
[1] Carter, C.R. and Easton, P.L. (2011),
“Sustainable supply chain management:
evolution and future directions”, International
Journal of Physical Distribution & Logistics
Management, Vol. 41 No. 1, pp. 46-62.
[2] Management, Vol. 41 No. 1, pp. 46-62.Carter,
C.R. and Rogers, D.S. (2008), “A framework of sustainable supply chain management:
moving toward new theory”, International
Journal of Physical Distribution & Logistics
Management, Vol. 38 No. 5, pp. 360-87..
[3] Linton, J.D., Klassen, R. and Jayaraman, V.
(2007),“Sustainable supply chains: an
introduction”, Journal of Operations
Management, Vol. 25 No. 6, pp. 1075-82.
[4] Preuss, L.L. (2002), “Green light for greener
supply”,Business Ethics: A European
Review,Vol.11No.4,pp. 308-17.
[5] Seuring, S. (2004), “Industrial ecology, life
cycles, supply chains: differences and
interrelations”, Business Strategy & The
Environment, Vol. 13 No. 5, pp. 306-19.
[6] Vachon, S. (2007), “Green supply chain
practices and the selection of environmental
technologies”, International Journal of
Production Research, Vol. 45 No. 18 and 19,
pp. 4357-79.
[7] Sen, S. (2009), “Linking green supply chain
management and shareholder value creation”,
The IUP Journal of Supply Chain Management,
Vol. 7 No. 3 and 4, pp. 95-109.
[8] Barratt, M. and Oke, A. (2007), “Antecedents
of supply chain visibility in retail supply chains:
a resource-based theory perspective”, Journal
of Operations Management, Vol. 25 No. 6, pp.
1217-33.
[9] Handfield, R., Walton, S., Seegers, L. and
Melnyk, S. (1997),“‘Green’ value chain
practices in the furniture industry”, Journal of
Operations Management,Vol.15No.4, pp.
293-315.
[10] Jorgensen, D.W. and Wilcoxen, P.J. (1990),
“Environmental regulation and US economic
growth”, Rand Journal of Economics, Vol. 21
No. 2, pp. 314-40.
[11] Jaffe, A.B., Peterson, S., Portney, P. and
Stavins, R. (1995),“Environmental regulation and the competitiveness of US manufacturing:
what does the evidence tell us?”, Journal of
Economic Literature, Vol. 33 No. 1, pp. 132-63.
[12] Zhu, Q., Sarkis, J. and Lai, K. (2008a),
“Confirmation of a measurement model for green supply chain management practices
implementation”, International Journal of
Production Economics, Vol. 111 No. 2, pp.
261-73.
[13] Vachon, S. and Klassen, R.D. (2006),
“Extending green practices across the supply chain: the impact of upstream integration”,
International Journal of Operations &
Production Management, Vol. 26 No. 7, pp.
795-821.
[14] Wee, Y.O. and Quazi, H.A. (2005),
“Development and validation of critical factors
of environmental management”, Industrial
Management & Data Systems, Vol. 105 No. 1,
pp. 96-114.
[15] ZHU Qing-hua, GENG Yong. Statistics
analysis on chinese manufacturers based on practice of green supply chain management and
their performance[J]. Application of Statistics
and Management,2006,25(4):392-398.
[16] Kenneth W. Green Jr, Pamela J. Zelbst, Jeramy
Meacham, Vikram S. Bhadauria. An International Journal Emerald Article: Green supply chain management practices: impact on
performance[J]. Supply Chain Management,