INFANT CRIES IDENTIFICATION
BY USING CODEBOOK AS FEATURE MATCHING,
AND MFCC AS FEATURE EXTRACTION
1MEDHANITA DEWI RENANTI, 2AGUS BUONO, 2WISNU ANANTA KUSUMA
1
Diploma Program of Bogor Agricultural University
2
Computer Science Department of Bogor Agricultural University
E-mail: [email protected], [email protected] , [email protected]
ABSTRACT
In this paper, we focused on automation of Dunstan Baby Language. This system uses MFCC as feature extraction and codebook as feature matching. The codebook of clusters is made from the proceeds of all the baby’s cries data, by using the k-means clustering. The data is taken from Dunstan Baby Language videos that has been processed. The data is divided into two, training data and testing data. There are 140 training data, each of which represents the 28 hungry infant cries, 28 sleepy infant cries, 28 wanted to burp infant cries, 28 in pain infant cries, and 28 uncomfortable infant cries (could be because his diaper is wet/too hot/cold air or anything else). The testing data is 35, respectively 7 infant cries for each type of infant cry. The research varying frame length: 25 ms/frame length = 275, 40 ms/frame length = 440, 60 ms/ frame length = 660, overlap frame: 0%, 25%, 40%, the number of codewords: 1 to 18, except for frame length 275 and overlap frame = 0 using 1 to 29 clusters. The identification of this type of infant cries uses the minimum distance of euclidean distance. Accuracy value is between 37% and 94%. Sound ‘eh’ is the most familiar, whereas sound ‘owh’ is always missunderstood and generally it is known as ‘neh’ and ‘eairh’. The weakness point of this research is the silent is only be cut at the beginning and at the end of speech signal. Hopefully, in the next research, the silent can be cut in the middle of sound so that it can produce more specific sound. It has impact on the bigger accuracy as well.
Keywords: Codebook, Dunstan baby language, Infant cries, K-means clustering, MFCC
1. INTRODUCTION
The first verbal communication which is mastered by a baby is crying. Currently, there is a system that learns the meaning of a 0-3 month old infant cries which is called Dunstan Baby Language (DBL). DBL is introduced by Priscilla Dunstan, an Australian musician who has got talent to remember all kinds of sounds, known as sound photograph. According to DBL version, there are five baby languages: “neh” means hunger, “owh” means tired which indicates that the baby is getting sleepy, “eh” means that the baby wants to burp, “eairh” means pain (wind) in the stomach, and “heh” means uncomfortable (could be due to a wet diaper, too hot or cold air, or anything else).
The expertise to determine the meaning of infant cries in DBL version is still a bit sparse so the information of baby’s cry meaning is not readily available to the parents. Currently, a system to transfer knowledge about DBL is by attending a training or seminar, or by studying their own infant cries meaning (in DBL version) which is already
packaged in the form of optical discs. The materials of DBL can also be downloaded on the internet. DBL system users, particularly in Indonesia, will be more confident with the conclusion they make if there is a software that can automatically generate the meaning of their infant cries. It can strengthen their conclusions. In addition, this software will also be useful for parents who do not attend any DBL training or seminar, so parents can understand the language or the crying of their baby.
using a neural network which produces 86% accuracy [3].
The classification of infant cries studies have previously used a neural network or HMM as the classifier. The research to identify the DBL infant cries used codebook as a classifier or pattern identifier which is obtained from the k-means clustering and MFCC as feature extraction. The choice of the method is based on the high accuracy results from the researches, such as: automatic recognition of birdsongs using MFCC and Vector Quantization (VQ) codebook and produces 85% accuracy [4]. Besides, the research about speaker recognition system also successfully created by using MFCC dan VQ [5]. The same research that Singh and Rajan [6] did, got 98,57% accuracy by doing speaker recognition research using MFCC and VQ. The research about speech recognition and verification using MFCC and VQ which Patel and Prasad (2013) did can do recognition with training error rate about 13% [7]. The making of this codebook using k-means clustering.
This research aims to perform the modeling of codebook method with k-means clustering technique, and Mel Frequency Cepstrum Coefficients (MFCC) to identify the infant cries. The scope of this research are: the infant cries classification used is the version of the Dunstan Baby Language which is divided into groups of hungry baby, tired/sleepy baby, like burping baby, infants experience pain in the stomach, and uncomfortable baby. This software is used to identify the meaning of 0-3 month old infant cries.
2. MATERIALS AND METHODS
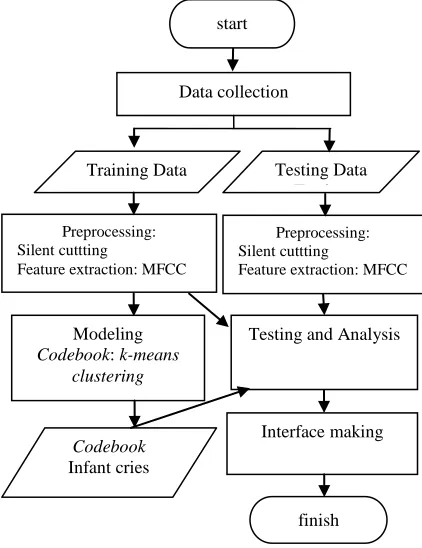
The methodology of this research consists of several stages of process: data collection, preprocessing, codebook modeling of infant cries, testing and analysis, and interface manufacturing. The methodology of the infant cries meaning identification process is shown in Figure 1.
2.1 Data Collection
The data used for this study is the infant cries that are grouped into five cries of hungry baby, sleepy baby, like burping baby, in pain baby (in the stomach), and the uncomfortable baby. The data is taken from Dunstan Baby Language videos that has been processed.
The data is divided into two, training data and testing data. There are 140 training data, each of which represents the 28 hungry infant cries, 28 sleepy infant cries, 28 wanted to burp infant cries, 28 in pain infant cries, and 28 uncomfortable infant cries (could be because his diaper is wet/too
hot/cold air or anything else). The testing data is 35, respectively 7 infant cries for each type of infant cry.
[image:2.612.316.527.129.403.2]
Figure 1: The methodology of identifying the meaning of a crying baby
2.2 Preprocessing
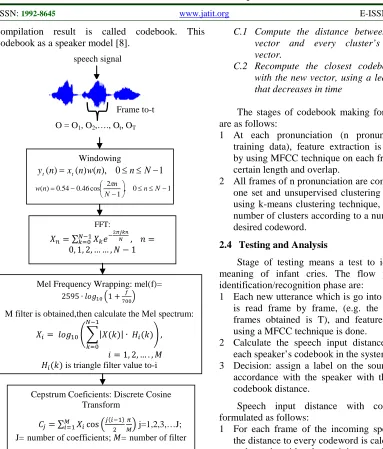
Silent cutting is in the preprocessing stage and the feature extraction uses MFCC method. The MFCC flow diagram can be seen in Figure 2.
2.3 Infant Cries Codebook Modeling
The codebook that is going to be made is the codebook of each infant cry data. The codebook of clusters is made from the proceeds of all the baby’s cries data, by using the k-means clustering. Codebook is a set of points (vectors) that represent the distribution of a particular sound from a speaker in a sound chamber. Each point of the codebook is known as a codeword. The recognition process means that in every sound, the distance of the sound is always counted to each speaker codebook. The distance of incoming sound signals to a speaker codebook is calculated as the sum of the distances of each frame which is read to the nearest codeword. Finally, input signal is labeled as speaker corresponding the smallest codebook distance. Speaker modeling using VQ based is made by clustering from speaker feature to K which is not overlapping. Every cluster is representated by code vector ci that is centroid. Code vector
start
Data collection
Preprocessing: Silent cuttting
Feature extraction: MFCC
Testing Data T i Training Data
Modeling
Codebook: k-means clustering
Codebook
Infant cries
Testing and Analysis
Interface making
finish Preprocessing: Silent cuttting
compilation result is called codebook. This codebook as a speaker model [8].
Figure 2: Diagram Alur MFCC
K-means clustering is a well-known
partitioning method. Objects are classified as belonging to one of k groups, k chosen a priori. Cluster membership is determined by calculating the centroid for each group (the multidimensional version of the mean) and assigning each object to the group with closest centroid. This approach minimizes the overall within-cluster dispersion by iterative reallocation of cluster members.
The pseudo code of the k-means algorithm is to explain how it works [9]:
A. Choose K as the number of clusters
B. Initialize the codebook vectors of the K clusters (randomly, for instance)
C. For every new sample vector:
C.1 Compute the distance between the new vector and every cluster’s codebook vector.
C.2 Recompute the closest codebook vector with the new vector, using a learning rate that decreases in time
The stages of codebook making for a speaker are as follows:
1 At each pronunciation (n pronunciation as
training data), feature extraction is performed by using MFCC technique on each frame with a certain length and overlap.
2 All frames of n pronunciation are combined into one set and unsupervised clustering is done by using k-means clustering technique, choosing a number of clusters according to a number of the desired codeword.
2.4 Testing and Analysis
Stage of testing means a test to identify the meaning of infant cries. The flow process of identification/recognition phase are:
1 Each new utterance which is go into the system is read frame by frame, (e.g. the number of frames obtained is T), and feature extraction using a MFCC technique is done.
2 Calculate the speech input distance signal to each speaker’s codebook in the system.
3 Decision: assign a label on the sound input in accordance with the speaker with the smallest codebook distance.
Speech input distance with codebook is formulated as follows:
1 For each frame of the incoming speech input, the distance to every codeword is calculated and codeword with the minimum distance is selected.
2 The distance between the input speech and the codebook is a number of minimum distance (equation 1). 𝑑𝑖𝑠𝑡𝑎𝑛𝑐𝑒(𝑖𝑛𝑝𝑢𝑡,𝑐𝑜𝑑𝑒𝑏𝑜𝑜𝑘) =
∑𝑡=1𝑇 ∀𝑐𝑜𝑑𝑒𝑤𝑜𝑟𝑑𝑚𝑖𝑛𝑘[𝑑(𝑓𝑟𝑎𝑚𝑒𝑡,𝑐𝑜𝑑𝑒𝑤𝑜𝑟𝑑𝑘)]
(1) Distance used in this research is Euclidean distance.
Euclidean distance between i object is defined by equation 2 [10].
𝐷(𝑋,𝑌) =�∑𝐷𝑖=1(𝑥𝑖− 𝑦𝑖)2 (2)
The research using 35 testing data and 140 training data.The analysis on the obtained results according to previous phase of testing will be carried out in this phase. The analysis will be performed based on the results of a combination of factors and levels:
O = O1, O2,…., Ot, OT
Windowing 1 0 ), ( ) ( )
(n =x nw n ≤n≤N−
yt t
1 0 , 1 2 cos 46 . 0 54 . 0 ) ( ≤ ≤ − − −
= n N
N n n w π
FFT:
𝑋𝑛=∑ 𝑋𝑘𝑒− 2𝜋𝑗𝑘𝑛
𝑁 𝑁−1
𝑘=0 , 𝑛=
0, 1, 2, … … ,𝑁 −1
𝑋𝑖= 𝑙𝑜𝑔10��|𝑋(𝑘)|∙ 𝐻𝑖(𝑘) 𝑁−1
𝑘=0
�,
𝑖= 1, 2, … . ,𝑀
Mel Frequency Wrapping: mel(f)= 2595∙ 𝑙𝑜𝑔10�1 +700𝑓�
M filter is obtained,then calculate the Mel spectrum:
𝐻𝑖(𝑘) is triangle filter value to-i
Cepstrum Coeficients: Discrete Cosine Transform
𝐶𝑗=∑𝑀𝑖=1𝑋𝑖cos�𝑗(𝑖−12 )𝑀𝜋� j=1,2,3,…J;
J=number of coefficients; 𝑀=number of filter
speech signal
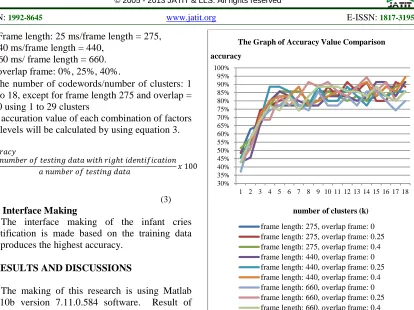
• Frame length: 25 ms/frame length = 275, 40 ms/frame length = 440,
60 ms/ frame length = 660. • overlap frame: 0%, 25%, 40%.
• the number of codewords/number of clusters: 1 to 18, except for frame length 275 and overlap = 0 using 1 to 29 clusters
The accuration value of each combination of factors and levels will be calculated by using equation 3.
𝑎𝑐𝑐𝑢𝑟𝑎𝑐𝑦
= 𝑎𝑛𝑢𝑚𝑏𝑒𝑟𝑜𝑓𝑎𝑡𝑒𝑠𝑡𝑖𝑛𝑔𝑛𝑢𝑚𝑏𝑒𝑟𝑑𝑎𝑡𝑎𝑜𝑓𝑡𝑒𝑠𝑡𝑖𝑛𝑔𝑤𝑖𝑡ℎ𝑟𝑖𝑔ℎ𝑡𝑑𝑎𝑡𝑎𝑖𝑑𝑒𝑛𝑡𝑖𝑓𝑖𝑐𝑎𝑡𝑖𝑜𝑛𝑥 100
(3) 2.5 Interface Making
The interface making of the infant cries identification is made based on the training data that produces the highest accuracy.
3. RESULTS AND DISCUSSIONS
The making of this research is using Matlab R2010b version 7.11.0.584 software. Result of accuracy comparison using euclidean distance with testing data is shown in Figure 3. According to Figure 3 the higher accuracy when the frame length = 440, overlap frame = 0.4, and k = 18 with 94% accuracy. The same accuracy can be got when frame length = 660, overlap frame = 0.25, and k = 14.
Result of testing using the data testing when k = 18, frame length = 440 and overlap frame = 0.4 can be seen in Table 1. Result of testing using the data testing when k = 18, frame length = 660 and overlap frame = 0.25 is shown in Table 2. Result of testing using the data testing when k = 18, frame length = 275 and overlap frame = 0.25 can be seen in Table 3.
[image:4.612.107.521.64.374.2]Table 1: Testing using testing data when k=18, Frame length = 440, and overlap = 0,
[image:4.612.314.511.451.558.2]Figure 3: The graph of accuracy value comparison using testing data
Table 2: Testing using Testing Data when k=18, Frame length = 660, and overlap = 0,25
Data testing to- Type of
cries
1 2 3 4 5 6 7
'o' 'a' 'a' 'a' 'a' 'a' 'a' a-eairh
'e' 'e' 'e' 'e' 'e' 'e' 'e' e-eh
'h' 'h' 'h' 'h' 'h' 'e' 'h' h-heh
'n' 'n' 'n' 'n' 'n' 'n' 'n' n-neh
'n' 'o' 'n' 'o' 'a' 'o' 'o' o-owh
Table 3: Testing using Testing Data when k=18, Frame length = 660, and overlap = 0,25
wrong identification
30% 35% 40% 45% 50% 55% 60% 65% 70% 75% 80% 85% 90% 95% 100%
1 2 3 4 5 6 7 8 9 10 11 12 13 14 15 16 17 18 accuracy
number of clusters (k) The Graph of Accuracy Value Comparison
frame length: 275, overlap frame: 0 frame length: 275, overlap frame: 0.25 frame length: 275, overlap frame: 0.4 frame length: 440, overlap frame: 0 frame length: 440, overlap frame: 0.25 frame length: 440, overlap frame: 0.4 frame length: 660, overlap frame: 0 frame length: 660, overlap frame: 0.25 frame length: 660, overlap frame: 0.4
Data testing to- Type of
cries
1 2 3 4 5 6 7
'a' 'a' 'a' 'a' 'a' 'a' 'a' a-eairh
'e' 'e' 'e' 'e' 'e' 'e' 'e' e-eh
'h' 'h' 'h' 'h' 'h' 'e' 'h' h-heh
'n' 'n' 'n' 'n' 'n' 'n' 'n' n-neh
'o' 'o' 'o' 'o' 'a' 'o' 'o' o-owh
Data sample to- Type of
cries
1 2 3 4 5 6 7
'a' 'a' 'a' 'a' 'a' 'a' 'a' a-eairh
'e' 'e' 'e' 'e' 'e' 'e' 'e' e-eh
'h' 'h' 'h' 'h' 'h' 'h' 'h' h-heh
'n' 'o' 'n' 'n' 'n' 'o' 'n' n-neh
From the result of testing we know that sound ‘eh’ is the most familiar (Table 1, Table 2, Table 3). Whereas sound ‘owh’ is always missunderstood and generally it is known as ‘neh’ and ‘eairh’ (Table 2, Table 3). The mistake in identification is caused by training data variation ‘owh’ is bigger than the others. Codebook ilustration ‘eh’ and ‘owh’ when k-18, frame length=440, and overlap frame = 0.4 is shown in Figure 4. The figure show codebook distribution ‘owh’ is bigger than ‘eh’ codebook.
Figure 4: Ilustrasi codebook of ‘eh’ and ‘owh’
[image:5.612.313.523.254.427.2]The testing comparison of testing data and training data accuracy use euclidean distance with frame length = 275 and overlap frame = 0 can be seen in Figure 5.
Figure 5: The graph of accuracy using testing data and training data when frame length = 275, overlap = 0
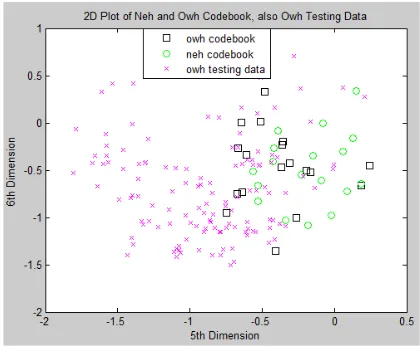
The illustration about the explanation is displayed in Figure 6 and Figure 7. Codebook illustration of ’owh’, ‘neh’, and ‘owh’ testing data is displayed in Figure 6. Codebook illustration of
’owh’, ‘neh’, and ‘owh’ training data is displayed in Figure 7.
There are 2 codebook in Figure 6 and Figure 7, that is codebook ‘owh’ and ‘neh’. When the testing using ‘owh’ testing data, sound ‘owh’ is known as owh (illustration in Figure 6) but when ‘owh’ training data is tested, its known as ‘neh’ (illustration in Figure 7). It is because ‘owh’ training data (symbol * red coloured in Figure 7) is close to neh codebook (symbol o green coloured) (Figure 7). It proves that evethough owh training data has been modelled as ‘owh’ codebook, the testing still identify it as ‘neh’.
Figure 6: Codebook illustration of owh and neh, also ‘owh’ testing data
Figure 7: Codebook illustration of owh and neh, also ‘owh’ training data
The interface of identification of infant cries is displayed in Figure 8. Codebook model is frame length = 440, overlap frame = 0.4, k = 18.
40% 50% 60% 70% 80% 90% 100%
1 3 5 7 9 11 13 15 17 19 21 23 25 27 29 accuracy
number of clusters (k)
The Graph of Accuracy using Testing Data and Training Data when Frame Length= 275, Overlap = 0
training data
[image:5.612.313.522.480.650.2]Figure 8: The Interface Of Identification Of Infant Cries
4. CONCLUSION
Codebook model and MFCC with the higher accuracy is: frame length = 440, overlap frame = 0.4, k = 18. The distance using which produce the higher accuracy is euclidean distance. That model can produce accuracy recognition of infant cries with the higher about 94%. The research is just cut the silent at the beginning and at the end of speech signal. Hopefully, in the next research, the silent can be cut in the middle of sound so that it can produce more specific sound. It has impact on the bigger accuracy as well.
REFRENCES:
[1] Poel M, Ekkel T. Analyzing Infant Cries Using a Committee of Neural Networks in order to Detect Hypoxia Related Disorder.
International Journal on Artificial Intelligence Tools (IJAIT) Vol. 15, No. 3, 2006, pp. 397-410.
[2] Lederman D, Zmora E, Hauschildt S, Stellzig-Eisenhauer A, Wermke K. 2008. Classification of cries of infants with cleft-palate using parallel hidden Markov models.
International Federation for Medical and Biological Engineeering, Vol. 46, 2008, pp. 965-975.
[3] Reyes-Galaviz OF, Reyes-Garcia CA. 2004. A System for the Processing of Infant Cry to Recognize Pathologies in Recently Born Babies with Neural Networks. International Speech Communication Association, Rusia, September 20-22, 2004.
[4] Lee C, Lien C, Huang R. Automatic Recognition of Birdsongs Using Mel-frequency Cepstral Coefficients and Vector Quantization. International MultiConference
of Engineers and Computer Scientists, Hong Kong, June 20-22, 2006.
[5] Kumar C. Rao PM. Design of an Automatic Speaker Recognition System using MFCC, Vector Quantization, and LBG Algorithm.
International Journal on Computer Science and Engineering (IJCSE) Vol. 3, No. 8, 2011, pp. 2942-2954.
[6] Singh S, Rajan EG. Vector Quantization Approach for Speaker Recognition using
MFCC and Inverted MFCC. International
Journal of Computer Applications Vol. 17, No. 1, 2011, pp. 1-7.
[7] Patel K, Prasad RK. Speech Recognition and
Verification Using MFCC & VQ.
International Journal of Emerging Science and Engineering (IJESE) Vol. 1, No. 7, 2013. pp. 33-37.
[8] Linde Y, Buzo A, Gray RM. 1980. An Algorithm for Vector Quantizer Design. IEEE Transactions On Communications, Vol. 28, No. 1, 1980, pp. 84-95.
[9] Abbas OA. Comparisons Between Data Clustering Algorithms. The International Arab Journal of Information Technology, Vol. 5, No. 3. 2008, pp. 320-325