346
A POWER DISTRIBUTION NETWORK RESTORATION VIA
FEEDER RECONFIGURATION BY USING EPSO FOR
LOSSES REDUCTION
1N. F. NAPIS, 2M. F. SULAIMA, 3R. M. ARIF R. A. YUSOF, 4A. F. A. KADIR, 5M. F. BAHAROM
Faculty of Electrical Engineering, Universiti Teknikal Malaysia Melaka,
Hang Tuah Jaya, 76100, Malacca, Malaysia
E-mail: [email protected], [email protected], [email protected], [email protected],
5
ABSTRACT
This paper deals with 16kV and 33kV Service Restoration via Distribution Network Reconfiguration (DNR) by using hybridization algorithm called as Evolutionary Particle Swarm Optimization (EPSO). The main objectives of this study are to restore as many loads as possible by transferring loads in the out of service areas to other distribution feeders via the system of changing the status of normally close and open switches which is known as Distribution Network Reconfiguration (DNR). Apart from that, this study manages to analyze the difference of losses reduction and improving the voltage profile respectively. A detailed performance analysis is carried out in 16 and 33-bus systems demonstrate the effectiveness of the EPSO method in MATLAB environment. The results are presented and compared with the Particle Swarm Optimization (PSO) algorithm and the original network. EPSO method has shown a good performance as the confirmations for the success of this optimization with has the least power losses and a better improvement in the voltage profile compared to PSO and original network. This advantage will help to solve power loss problem in the electrical power system as well as increasing the efficiency of the real distribution system.
Keywords: Distribution Network Reconfiguration, Service Restoration, voltage profile, power losses, Evolutionary Particle Swarm Optimization
1. INTRODUCTION
Electricity is one of the most important factors in a life as it helps to run the machine to do the works. In electrical field, the main goals that always to be handled is to produce a good quality of power to the consumers. It begins with the generation system by power plant, transmission and distribution. The distribution system is the last stage in the delivery of electric as it carries electricity from the transmission line to the users. This system is important to ensure the power supplied is distributed efficiently and economically. For heavily loaded network, blackout area and power loss become the main problem that must be solved in a short time and need to be discussed when dealing with distribution networks. From this condition, minimum impact to customers is aimed. Many researchers have investigated many theories and practices and proposed an efficient way for solving a reconfiguration problem formulation of
radial distribution system. The analyzing of blackout area and reducing in power losses is the objectives to achieve an efficient and secure in the distribution system. The blackout area happens when there is a fault occurs and need to be isolated from the system. There are several constraints need to be satisfied for distribution network such as radial, bus voltage, feeder current and others to avoid unreliable condition. Apart from that, heuristic method has been applied as an optimization method to solve the local minima issue by reconfiguring the network via changing the open and closed state of switches. An effective system gives more advantages than disadvantages. So, the country needs to be more competitive with others in order to create an efficiency of power distribution system.
347 the distribution system. Radial distribution network configuration is been determining through heuristic algorithm aiming for loss minimization [1]. Genetic Algorithms (GA) proposed in [2] has shown the ability to operate a minimal number of switches and maintaining acceptable operating conditions such as power flow and system voltage level. Apart from that, an improved on optimization method such as Modified Genetic Algorithm (MGA) embedded with Distributed Generation (DG) for power losses minimization has been done in [3]. The results show that MGA have a better performance compared to GA even it has a slight difference in the mutation process. It also ensures only the highest potency chromosomes are selected for the next iteration to make the results nearest to the optimum solution. An Evolutionary Algorithm (EA) also has proposed to solve restoration problem and obtain a feasible solution with an acceptable amount of computational effort [4], [5], [6]. Furthermore, a Particle Swarm Optimization (PSO) is another method that has been widely used in distribution networks with DG based on two-dimensional depth-coded to solve service restoration in the event of large– scale blackout [7]. Then, after many years, the hybrid method become more popular to be applied such as is being developed is Evolutionary Particle Swarm Optimization (EPSO) [8]. There are several research has been reported on the application of EPSO in the distribution network reconfiguration, but none in service restoration by using 16 and 33 radial bus system. In this study, the performance of PSO and EPSO has been compared to show the most optimum losses in the system.
The arrangement of the sub-topic will be presented as follows. Part 2 is the formulation and constraints. Then, Part 3 is the test system. Part 4 is the results and analysis, while the conclusion will be on part 5.
2. FORMULA FORMULATION AND
CONSTRAINTS
2.1 Losses Formula
The network reconfiguration for loss minimization can be formulated as shown below,
∑ ∈ (1)
∑ | | ∈ (2)
Where:
= total power losses of distribution feeders n = total number of zones in distribution system
Current in branch i = resistance of branch i N= total number of branch
= variable that represents the topological status of the branch.
From equation (2), the large amount of current, sending by the main source causes the increasing of total power losses in distribution feeders. However, the solution is by changing the status of open and closed switching during reconfiguration network.
2.2 Radial Network Constraint
Distribution network must be composed of the radial structure considering operational point of view. In order to ensure the network is operated in radial with normal condition of distribution system, there is a condition for the selection of switches which is;
• All switches that do not belong to any loop are to be closed
• All the switches are connected to the sources are to be closed
• All switches contributed to a meshed network need to be closed
2.3 Node Voltage Constraint
Voltage magnitude at each node must be within the permissible ranges to maintain power quality. The standard minimum voltage used is 0.95 and the maximum voltage is 1.05 (1±0.05).
(3)
2.4 Feeder Capability Limits
| | ∈ 1, 2, 3, … , &' (4)
Where = maximum current capability of
branch k.
2.5 Voltage profile formulation
During normal conditions of the power system operation, 0.95p.u and 1.05p.u are acceptable range of voltage magnitude. Voltage profile is presented as follows:
348
3. TEST SYSTEM
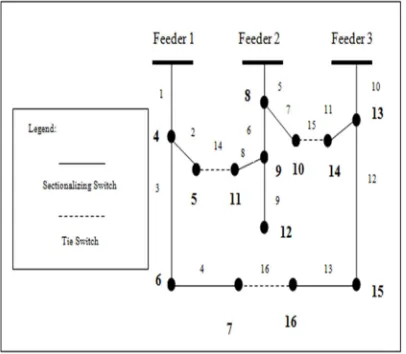
This study applies to IEEE-16 and IEEE-33 bus test system with a radial distribution system as shown in Figure 1and Figure 2. The IEEE-16 system contains of 3 feeders with 13 normally closed sectionalizing switches and 3 normally open tie switches with dotted lines and located on branch 14, 15 and 16 [9] while in the IEEE-33 bus system consists of 1 feeder, 32 normally close switches and 5 normally open switches located on branch 33, 34, 35, 36 and 37 [10]. The total optimization variable is represented by the combination of 3 switches (x1, x2 and x3) for 16 bus systems and 5 switches for 33 bus systems. The base MVA for the system is set at 100MVA. The total load in 16-bus is 2870 kW and for 33-bus system is 3715 kW. The calculations for minimum and maximum voltages for each bus are set in per unit system.
[image:3.612.314.524.57.319.2]Figure 1: 16-Bus Radial Distribution with Initial Network and 3 Tie Switches
Figure 2: 33-Bus Radial Distribution with Initial Network and 5 Tie Switches
[image:3.612.92.295.337.514.2]Table 1 shows the three scenarios to be analyzed by applying service restoration system with different algorithms. These scenarios have been executed in determining their reliability of having PSO and EPSO in the system to achieve best configuration. The effectiveness of the algorithms is considered to be tested in the standards 16 and 33-bus radial distribution system.
Table 1: Description on 3 Different Scenario Studies
Scenario 1
The system operated with original network via DNR in 16 and 33-bus system
Scenario 2
The system operated with service restoration via DNR using PSO and EPSO in 16 -bus system (fault occur at branch 12)
Scenario 3
The system operated with service restoration via DNR using PSO and EPSO in 33-bus system (fault occur at branch 7)
4. RESULTS AND ANALYSIS
4.1 Analysis of Power Losses
[image:3.612.314.527.480.642.2]349 33-bus system respectively. Thus, EPSO algorithm has shown the effectiveness in the analysis of power distribution network with better losses reduction and the combination of open switches changed to 8, 12, and 15 for 16-bus and switches 5, 7, 17, 33, and 34 for 33-bus system accordingly.
Table 2: Comparison Losses between 16-Bus and 33-Bus System
Parameters
16-bus system
Original network
PSO EPSO
Switches 14, 15, 16
12, 14, 15
8, 12, 15 Total power
loss (kW)
511.4 446.5 247.4
Loss reduction (kW)
- 64.9 264
Percentage of loss reduction (%)
- 12.7% 51.6%
(a) 16-Bus System
Parameters
33-bus system
Original network
PSO EPSO
Switches 33, 34, 35, 36,
37
7, 10, 14, 28,
33
5, 7, 17, 33, 34
Total power loss (kW)
202.7 111.4 107.7
Loss reduction (kW)
- 91.3 95
Percentage of loss reduction (%)
- 45.04% 46.87%
[image:4.612.86.536.54.654.2](b) 33-Bus System
Figure 3: Faulted Area
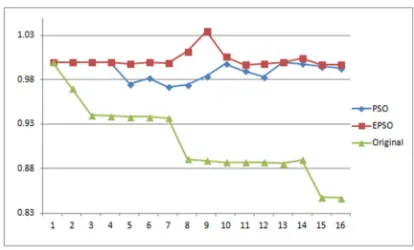
4.2 Analysis of Voltage profile
[image:4.612.321.528.541.666.2]The voltage profile for several nodes after reconfiguration for PSO and EPSO method had shown some significant improvement compared to the original configuration as shown in Figure 3 and 4 (for both 16 and 33-bus system). But, the results obtained are clearly shown that EPSO method has better improvement of voltage profile. It also shows that bus voltage for both methods are in the allowed range. For 16-bus test system, there is some improvement which at nodes 5 has been increased to 0.998 p.u and followed by nodes 6 until 12. While for 33-bus test system, the improvement occurs at nodes 6 until 24. The rest of the bus only shows a little improvement. Thus, the implementation of service restoration through reconfiguration technique has given better voltage profile compared to conventional technique.
350 Figure 5: The Voltage Profile after Service Restoration
for 33 Bus Systems
5. CONCLUSION
Evolutionary Particle Swarm Optimization is an efficient hybridization of heuristic method between Evolutionary Programming (EP) and Particle Swarm Optimization (PSO) which is introduced to make it faster in finding the optimal solution that fits the system requirement. The power flow solution shows the results of power losses and voltage profile after the exchanging of open and close switches of 16 and 33-bus system by using Newton Raphson method.
It is proved even that the solutions have many possibilities, but by using EPSO method after service restoration shows that it can solve the fault problem by searching the best combination of the switch to reduce the power loss in the distribution system.
6. ACKNOWLEDGEMENT
The authors would like to acknowledge the Universiti Teknikal Malaysia Melaka (UTeM) and Ministry of Education Malaysia for the financial support for this research (Grant No:RAGS/1/2014/TK06/FKE/B00051).
REFRENCES:
[1] S. Civanlar, J.J. Grainger, H. Yin, S. S. H. Lee, “Distribution feeder reconfiguration for loss reduction”, IEEE Trans. Power Del, Vol. 3, No. 3, 1988, pp. 1217-1223.
[2] Kyeong Jun Mun, Park, J.H., Hyung-Su Kim, Jung-1l Seo, “Development of real-time-service restoration system for distribution automation system”, Industrial Electronics,
Proceedings. ISIE, Vol. 3, 2001, pp.
1514-1519.
[3] W.M Dahalan, Hazlie Mokhlis, J.J.Jamian, MK Puteri Zarina, A.G Othman, M.F Sulaima, MD Redzuan, “Service restoration
based on Simultaneous Network
Reconfiguration and DG Sizing for Loss Minimization using MGA”, 2014.
[4] Mendiola, M. C., Chang, C. S., and Elangovan, S., “Fuzzy Expert System for Distribution System Restoration and Contingency Operation,” IEEE Explore
Catalogue, No. 95TH8130, 1995, pp. 73–79.
[5] Nara K, “Genetic Algorithm for Power Systems Planning,” The 4th International Conference on Advances in Power System
Control, Operation and Management, 1997,
pp. 60–65.
[6] A. E. Eiben and G. Rudolph, “Theory of evolutionary algorithm: A bird’s eye view,”
Theoretical Computer Science, Vol. 229, No.
1-2, 1999, pp. 3–9.
[7] Chen Dan ; Chen Xingying ; Liu Jian ; Dong Xinzhou ; Liao Yingchen, “Service restoration study of distribution system with distributed generators based on particle swarm optimization”, Advanced Power System
Automation and Protection (APAP), Vol. 2,
2011, pp. 1176- 1181.
[8] Angeline, P.J., “Using Selection to Improve Particle Swarm Optimization”, IEEE World
Congress on Computational Intelligence, No.
4-9, 1998, pp. 84-89.
[9] M. F. Sulaima, M. S. Shidan, W. M. Dahalan, H. Mohlis, H. I. Jaafar, “A 16kV Distribution Network Reconfiguration by Using Evolutionaring Programming for Loss Minimizing”, International Journal of Applied
Engineering Research, Vol. 9, No. 10, 2014,
pp. 1223-1238.
[10] M. F. Sulaima, H. Mokhlis, H. I. Jaafar “A DNR Using Evolutionary PSO for Power Loss Reduction”, Journal of Telecommunication,
Electronic and Computer Engineering, Vol. 5,