DESIGN OF HYBRID CONTROLLER BASED LOAD
FREQUENCY CONTROLLER FOR MULTI AREA HYDRO
THERMAL SYSTEM
1 UMA PAPA GARIMELLA, 2 Dr.K.RAJAN
1
RESEARCH SCHOLAR, DEPARTMENT OF ELECTRICAL & ELECTRONICS ENGG, 2
DEAN, VEL TECH,CHENNAI
E-mail: [email protected], 2 [email protected]
ABSTRACT
This article presents the design of hybrid controller (proportional double integral controller (PDIC) plus fuzzy logic controller (FLC)) in load frequency control (LFC) for multi area hydro thermal system (MAHTS). In this case, two control areas connected through the tie line and each area consists of both the hydro and thermal power system. The conventional controllers are incapable of stabilizing the frequency deviation as well as the power oscillation of it at load variations conditions. In order to stabilize the frequency deviation and improve the dynamic performance of MAHTS, a PDIC plus FLC is developed. The complete model with various controllers is implemented in MATLAB/Simulink. The performance of designed controller is validated at various operating state in comparison with a conventional controllers. The simulation results are indicated that the designed controller more superior than the conventional controllers.
Keywords: Multi Area Hydro Thermal System, Fuzzy Logic Controller, Proportional Double
Integral Controller, Load Frequency Control, MATLAB Simulink
1. INTRODUCTION
The power system became more multifaceted owing to the sudden development of the industries. In industries the demand of real power always keeps changing, which also to vary in the system frequency. This is solved only by means of load frequency controller (LFC). The power system can drop its stability mainly due to non-working of LFC. The most efficient as well as very active performance LFC is essential to keep the system stability under load changes [1]-[2]. The LFC is designed using the transfer function model of system. The power system transfer function model is furnished by Elgerd and is utilized by most of the researchers has been reported [3]-[5].
In this study, the multi source multi area system (i.e. each area can have both combinations of hydro and thermal plants) is considered. The variable structure based fuzzy gain scheduling LFC for multi source multi area has been addressed [6]. However, the response of frequency deviation for each area of the power system is settled long time and also produced more frequency error using this controller. Sliding mode controller (SMC) and proportional integral (PI) controller, based LFC is well executed [7]. Nevertheless, the numerical simulation results of both controller showed the
ISSN: 1992-8645 www.jatit.org E-ISSN: 1817-3195
(FLC)) based LFC for MAHTS.
Various SMC
based LFC for multi area power system has been addressed [10]. Yet, the calculation is major problem for designing SMC and it produced more transient overshoots and chattering problems. The superconducting magnetic energy storage and SSSC is connected between the interconnected area and tie line for LFC [11]. However, this kind of model produced more start-up overshoot and long settling time. The above mentioned problem is overcome by the designed hybrid controller (combination of proportional double integral controller (PDIC) plus fuzzy logic controller (FLC)) based LFC for multi area hydro thermal system (MAHTS).
Therefore, in this paper is to design the PIC plus FLC based LFC for MAHTS. The PDIC is designed using Ziegler Nichols Tuning method. The FLC rules are developed based on the system responses. The performance of the controller is validated through the computer simulation using MATLAB/Simulink during transient region as well as load variations in comparison with conventional controllers.
Section II presents the model of the MAHTS. The design of hybrid controller based LFC for MAHTS is presented in section III. The simulation results of system using various controllers under the various operating regions are discussed in section IV. The conclusions are discussed in section V.
2. MATHEMATICAL MODEL OF MAHTS
The MATHS is depicting in Fig. 1 and it consists of two areas. Each area has both combinations of thermal and hydro systems. Each area should be subjected to load disturbances. These two areas are connected through Tie line for power flow between the areas to enhance the reliability and stability [3]. The transfer function model of the both areas is of 2000MW capacity working at 1000MW at 50Hz. The model is developed for this condition. The thermal power model (TPM) during the both areas consists of speed governor (acting as a primary controller), which helps to equalize the generation with demand by regulating the steam input to the turbine. The reference power setting of the governor is changed by the secondary controller for fine tuning of the frequency. The speed governor can be expressed as equation (1)
1
Pg Pref f
R
∆ = ∆ − ∆
(1)
Fig.1. Transfer function model of MAHTS
The hydraulic amplifier performs as a high pressure steam into the turbine based of the governor. The transfer function model of the hydraulic amplifier can be engraved as equation (2)
1
1
PH Pg
sTH
∆ = ∆
+
(2)
The governor regulates the steam input to the non-reheat turbine, which acts as a prime mover for the generator and also, supplies the energy to the power system model. Now, the transfer function model of it can be written as equation (3)
1 1
P P
T H
sT T
∆ = ∆
+
(3)
The working of the hydro power model (HPM) is similar to that of the TPM. The speed governor of HPM using hydraulic amplifier mechanism is expressed as equation (4)
1 1
1 ( )
1 1 1 2
K sTR
PHV Pref f
sT sT R
+
∆ = ∆ − ∆
+ +
(4)
The hydro turbine applied in HPMs various performance characteristics from the thermal turbine and is expressed as equation (5)
1
1 0.5
sTw
P P
HT HV
sTw
−
∆ = ∆
+
(5)
system in load variation is represented as equation (6)
1 K p
PT PD f
sTp
∆ − ∆ = ∆
+ (6)
The power is traveled in between the two area through the tie line and is expressed as equation (7)
2
( )
12 1 2
T
Ptie f f
s π
∆ = ∆ − ∆ (7)
In load changes, each one of the area faces the cries of the frequency deviations separately from the tie line power deviations. Cohn regulate method applied in this article is expressed as equation (8)
12
ACE= ∆Ptie + ∆β f (8)
The area control error (ACE) is the input for controller (secondary) which in turn regulates the reference power setting of the governor.
3. DESIGN OF HYBRID CONTROLLER
In this section, detailed design procedure of hybrid controller in LFC for MAHTS has been discussed. It is a combination of PDIC plus FLC (acts as a secondary controller).
3.1 Design of FLC
In this paper, the FLC is applied to control the change in frequency of the given system. Here, the triangular membership function is selected as inputs and output of the controller (see the Fig. 2).
(a)
(b)
[image:3.595.84.514.75.396.2](c)
Fig. 2 Membership’s Functions Of Flc, (A) Error (E), (B) Change In Error (Ce), And (C) Output (O)
TABLE I
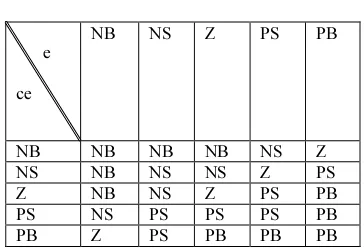
FUZZY RULE BASE TABLE OF MAHTS
e
ce
NB NS Z PS PB
NB NB NB NB NS Z
NS NB NS NS Z PS
Z NB NS Z PS PB
PS NS PS PS PS PB
PB Z PS PB PB PB
The fuzzy sets are [NB, NS, Z, PS, PB] where, NB (negative big), NS (negative small), Z (zero), PS (positive small), PM (positive medium), PB (positive big), respectively. The rules of the FLC are obtained based on the system performance. In this case, 25 rules are framed (refer the Table 2). Then, weighted average method (defuzzification-method) is used to finish the controller operation.
3.2 Design of PDIC
[image:3.595.315.497.448.572.2]ISSN: 1992-8645 www.jatit.org E-ISSN: 1817-3195
parameters, proportional gain (Kp) and double
integral times (Tis), are evaluated using Zeigler – Nichols tuning method with help of the model of MAHTS (refer the section 2). The PDIC
parameters, proportional gain (Kp) and double
integral times (Tis), are obtained by using Zeigler– Nichols tuning method [14],[15]. Using this method the values of Kp = 0.1 and integral times Tis= 0.11s and 0.1s (this value is chosen based on the MAHTS change in frequency response) are found.
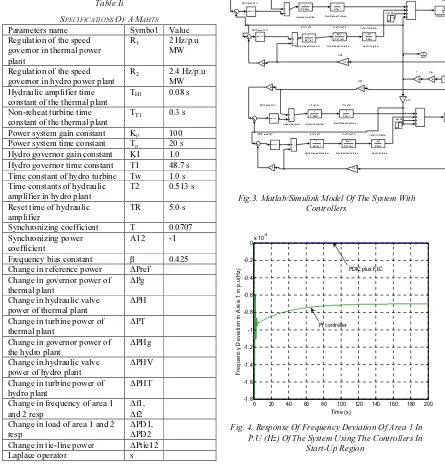
[image:4.595.309.581.250.447.2]4. SIMULATION RESULTS
Table Ii SPECIFICATIONS OF AMAHTS
Parameters name Symbol Value
Regulation of the speed governor in thermal power plant
R1 2 Hz/p.u
MW
Regulation of the speed governor in hydro power plant
R2 2.4 Hz/p.u
MW Hydraulic amplifier time
constant of the thermal plant
TH1 0.08 s
Non-reheat turbine time constant of the thermal plant
TT1 0.3 s
Power system gain constant Kp 100 Power system time constant Tp 20 s Hydro governor gain constant K1 1.0 Hydro governor time constant T1 48.7 s Time constant of hydro turbine Tw 1.0 s Time constants of hydraulic
amplifier in hydro plant
T2 0.513 s
Reset time of hydraulic amplifier
TR 5.0 s
Synchronizing coefficient T 0.0707
Synchronizing power coefficient
A12 -1
Frequency bias constant β 0.425
Change in reference power ΔPref Change in governor power of
thermal plant
ΔPg
Change in hydraulic valve power of thermal plant
ΔPH
Change in turbine power of thermal plant
ΔPT
Change in governor power of the hydro plant
ΔPHg
Change in hydraulic valve power of hydro plant
ΔPHV
Change in turbine power of hydro plant
ΔPHT
Change in frequency of area 1 and 2 resp
Δf1, Δf2 Change in load of area 1 and 2 resp
ΔPD1, ΔPD2 Change in tie-line power ΔPtie12
Laplace operator s
The main aim of this section is to discuss the simulation of the designed hybrid controller (PDIC plus FLC) in LFC for MAHTS in comparison with linear PI controller. The verification of the complete model is tested at transient and load variations conditions. The MATLAB/Simulink simulation models are performed on the MAHTS
using controller (refer the Fig. 3) with
specifications listed in TABLE II.
POWER SYSYTEM df1 1/R1
Hydrul ic Ampl ifi er Non -Reheat T urbi ne
Hydro Speed Governor Non -Reheat T urbi ne Hydro T urbi ne 1/1+sTh 1 1/1+sT t1
1/R2
K1/1+sT1 1+sT r/1+sT2 1-sTw/1+0.5sT w
Kp/1+sTp
del Pd1
2*pi T
POWER SYSY TEM 1/R1
Speed Govern or Hydru li c Ampli fier Non-Rehea t Tu rbin e
Hydro Speed Governor Non-Rehea t Turbi n e Hydro Tu rbin e 1/1+sTh1 1/1+sTt1
K1/1+sT 1 1+sTr/1+sT2 1-sTw/1+0.5sTw
Kp/1+sTp
del Pd2 A12 PDIC pl us FLC
PDIC pl us FLC
PDIC plu s FLC
PDIC plu s FLC
3 del f3 2 del f1 1 del f2 -s+1 0.5s+1 1 0.3s+1 5s+1 0.513s+1 -s+1 0.5s+1 1 0.3s+1 5s+1 0.513s+1 1 48.7s+1 1 0.08s+1 100 20s+1 1 48.7s+1 1 0.08s+1 100 20s+1
v opuls es 1 v o pulses1 v o pulses1
v opuls es 1
1 s .02 .02 -K--1 1/2.4 1/1 -K-1/2.4 .02 .02 1/1
Fig.3. Matlab/Simulink Model Of The System With Controllers
0 20 40 60 80 100 120 140 160 180 200 -1.8 -1.6 -1.4 -1.2 -1 -0.8 -0.6 -0.4 -0.2
0x 10
-4 Time (s) F re q u e n c y D e v ia ti o n i n A re a 1 i n p .u (H z
) PDIC plus FLC
PI controller
Fig. 4. Response Of Frequency Deviation Of Area 1 In P.U (Hz) Of The System Using The Controllers In
[image:4.595.80.525.275.750.2]0 20 40 60 80 100 120 140 160 180 200 -1.8 -1.6 -1.4 -1.2 -1 -0.8 -0.6 -0.4 -0.2
0x 10 -4 Time (s) F re q u e n c y D e v ia ti o n i n A re a 2 i n p .u ( H
z) PDIC plus FLC
PI controller
Fig.5. Response Of Frequency Deviation Of Area 1 In P.U (Hz) Of The System Using The Controllers In
Start-Up Region
Figs. 4 and 5 show the dynamic behavior in the start-up for the frequency deviation of area 1 and area 2 of the MAHTS using the PDIC plus FLC and PI controller. It can be seen that frequency deviation of a system using designed controller has a little overshoot of 0.000001in p.u (Hz) and quick settling times of 1s for step change in load of 10%, whereas the PI controller for the same system has produced 0.00018 p.u (Hz) of maximum overshoots and taking long settling time of 100s respectively. Fig. 6 indicates the Tie line power distribution between the area 1 and area 2 of the given system using designed controller. From this figure, it is clearly observed that the Tie line power distribution between the area 1 and area 2 for the system has very little overshoot during transient region using this PDIC plus FLC.
0 20 40 60 80 100 120 140 160 180 200 -1 -0.8 -0.6 -0.4 -0.2 0 0.2 0.4 0.6 0.8 1 Time (s) T ie L in e P o w e r in A re a 1 a n d 2 i n p .u
PDIC plus FLC
Fig.6. Response Of Tie Line Power Distribution Between The Area 1 And 2 Using The Pdic Plus Flc
0 20 40 60 80 100 120 140 160 180 200
-3 -2.5 -2 -1.5 -1 -0.5
0x 10
-4 Time (s) F re q u e n c y D e v ia ti o n i n A re a 1 i n p .u ( H z )
PDIC plus FLC
[image:5.595.292.505.81.296.2]PI controller
Fig. 7. Response Of Frequency Deviation Of Area 1 In P.U (Hz) Of The System For Step Change Load
Power From 10% To 30% In P.U
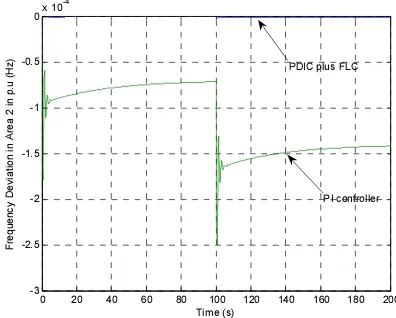
Figs. 7 and 8 show the dynamic behavior in the load variations for the frequency deviation of area 1 and area 2 of the MAHTS using the PDIC plus FLC and PI controller. It can be seen that frequency deviation of a system using designed controller has a small overshoot of 0.0000011in p.u (Hz) and quick settling times of 1.12s for step change in load of 10% to 30% in p.u (M.W), whereas the PI controller for the same system has produced 0.0025 p.u (Hz) of maximum overshoots and taking long settling time of 120s respectively. In summary, from the Figs. 4 to 8 showed that the designed controller performed well in all working conditions in comparison with PI controller.
0 20 40 60 80 100 120 140 160 180 200
-3 -2.5 -2 -1.5 -1 -0.5
0x 10 -4 Time (s) F re q u e n c y D e v ia ti o n i n A re a 2 i n p .u ( H z )
PDIC plus FLC
[image:5.595.313.511.487.646.2]PI controller
Fig. 8. Response Of Frequency Deviation Of Area 2 In P.U (Hz) Of The System For Step Change Load
ISSN: 1992-8645 www.jatit.org E-ISSN: 1817-3195
5. CONCLUSIONS
In this paper, design of hybrid controller like PDIC plus FLC in LFC for MAHTS has been demonstrated successfully through the computer simulation with help of MATLAB/Simulink. The main merits of designed controller has good stability during load variations, excellent transient and dynamic responses in comparison with PI controllers. The many simulation results are offered owing to prove the success of the controller.
The simulations are presented to demonstrate the efficacy of designed controller in LFC for given system resulted in fast dynamic response, proficient regulated frequency deviation, good steady state and transient responses in comparisons with PI controller. In future, the neuro-fuzzy controller and sliding mode controller for the same is going to analyze for the same system.
REFERENCES
[1] Elgerd OI. “Electric energy systems theory – an introduction.” 2nd ed. Tata McGraw Hill, 2000.
[2] Fosha CE, Elgerd OI., “The
megawatt-frequency control problem: a new approach via
optimal control theory”, IEEE Trans Power
Syst , Vol. 89 :pp. 563–77, 1970.
[3] Parmar KP, Majhi S, Kothari DP, “Load
frequency control of a realistic power system
with multi-source power generation,” Int J
Electr Power Energy Syst, Vol. 42, No. 1: pp.
426–33, 2012.
[4] Chatterjee Kalian, “PI controller for automatic generation control based on performance indices”, World Acad Sci Eng Technol, Vol. 75, pp. 321–8, 2011.
[5] Ramakrishna KSS, Sharma Pawan, Bhatti TS,
“Automatic generation control of
interconnected power system with diverse sources of power generation”, Int J Eng Sci
Technol, Vol. 2, No. pp. 51–65, 2010.
[6] K.R.M. Vijaya Chandrakala, S. Balamurugan
K. Sankaranarayanan, “Variable structure fuzzy gain scheduling based load frequency controller for multi source multi area hydro
thermal system”, Electrical Power and Energy
Systems, Vol. 53, pp. 375–381, 2013.
[7] Yang Mi, Yang Fu, Chengshan Wang, Peng
Wang, “Decentralized Sliding Mode Load Frequency Control for Multi-Area Power
Systems”, IEEE Transactions on Power
Systems, Vol. 28, No. 4, pp. 4301-4309, 2013.
[8] Gabriel Iovan, Ion Mircea, “The Load
Frequency Control Simulation in the
Interconnected Electrical Power Systems”,
IEEE conference, 2012.
[9] Dr. S.Kalyani, S. Nagalakshmi, Marisha. R, “Load Frequency Control Using Battery Energy Storage System in Interconnected
Power System”, ICCCNT'12, 26th-28th July
2012, Coimbatore, India.
[10]Mi yang, Pan da, Wu xiao, “The Different
variable structure control strategy applied in
power system load frequency control”, 2013
25th Chinese Control and Decision
Conference, pp. 1776-1779, 2013.
[11]Fida Hasan Md Rafi, Md. Zahid Ansary, Md. Hafizur Rahman, Md. Abu Shahab Mollah, Md. Atifur Rahman, “Load Frequency Control
Analysis Using AGC, TCPS and SMES”, IEEE
conference, 2013.
[12]Daneshfar Fatemeh, Bevrani Hassan, Multi
objective design of load frequency control using genetic algorithms, Int J Electr Power
Energy Syst, 2012, Vol. 42, No. 1, pp.257–63.
[13]Chatterjee Kalian, PI controller for automatic generation control based on performance
indices, World Acad Sci Eng Technol,
2011,Vol. 75, No.32, pp.1–8.
[14]S. Ramesh and A. Krishnan, “Stabilization of
Frequency Deviation in an AC-DC
Interconnected Power Systems Using
Supervisory Fuzzy Controller”, Tamkang
Journal of Science and Engineering, Vol. 14,
No. 4, pp. 341-349,2011.
[15]B. Anand, “Load Frequency Control of
Hydro-Hydro System with Fuzzy Logic Controller
Considering DC Link”, Life Science Journal,
Vol. 10, No.7, pp. 499- 504, 2013.
[16]Katsuhiko Ogata, Modern Control
Engineering, Published by Prentice – Hall of
India Private Limited, New Delhi, Third
Edition.
[17] R.D. Middlebrook, S. Cuk, A General Unified
Approach to Modeling Switching Converter
Stages, IEEE Power Electronics Specialists