5138
DIAGNOSIS OF ESCHERICHIA COLI BACTERIA PATIENT
BY DATA MINING
AMIR RAJAEI1, VAHID HEYDARI2
1,2Department of Computer Engineering, University of Velayat, Iran E-mail: 1[email protected] , 2[email protected]
ABSTRACT
The number and size of medical databases are rapidly growing and thus, developed models of data mining technique can help physicians to make effective decisions. The present paper is aimed at reporting a research project to compare data mining algorithms according to their precision, characteristics and speed in order to select the most accurate model in diagnosis of E.coli activities in urine specimens. In this paper, the practical application of data mining in diagnosing the activities of bacteria using the recorded data in the database which helps physicians to provide necessary information and knowledge for a better decision-making. Providing intelligent diagnosis system for the patient identification , in addition improving the rate and accuracy of detection are the subsequent paper aims. Activities of the bacteria in patients are divided into three groups: normal, active and semi-active. We have applied Fuzzy C Mean clustering and Differential Evolution on the collected database. The obtained results indicated that FCM algorithm was the same as DE algorithm in terms of precision, but it had better function than DE algorithm in terms of speed.
Keywords: Escherichia Coli (E.coli), Data Mining, Differential Evolution Algorithm (DE), Fuzzy C-Means
Algorithm, Healthcare, Diagnosis.
1. INTRODUCTION
It is well known that in an information technology driven society, knowledge is one of the most significant assets of any organization. The role of information technology with the help of data mining is well established in healthcare system. Data mining is the non-trivial extraction of implicit, previously unknown and potentially useful information from the data and trends in databases. Alternatively, it can be defined as the process of data selection and exploration and building models using massive data to discover unknown patterns [1].
Several factors have caused the use of data mining applications in healthcare. It can improve decision-making by discovering patterns and trends in large amount of complex data generated by healthcare transactions. Data mining technology provides a user-oriented approach to novel and hidden patterns in the data. The discovered knowledge can be used by healthcare administrators to improve the quality of service. It can also be used by medical practitioners to reduce the number of drugs’ adverse effects and
to suggest less expensive therapeutically equivalent alternatives[8].
Currently, diagnosis of diseases is one of the most widely-used data mining applications in medicine and physicians are faced with a large amount of data. Since it is not always easy to diagnose a disease, the experts should confirm the result of patient examination considering similar cases in the past. At last, final decisions should be made by the physician based on all observations[10].
5139 Healthcare information systems contain large volumes of information about patients, and data from laboratories that are constantly growing. With the use of data mining methods, useful patterns of information can be found in this data, which will be later used for further research and report evaluations. However, a very important issue is how to classify large volumes of data. Automatic classification is done based on the similarities of the data. This type of classification is useful only if the conclusion is acceptable for the doctor or the end user. Data mining provides support for identification of reliable relations between treatment and outcome[12].
Given the issues raised, modern societies are heavily affected by infectious diseases. These diseases are detectable by bacterial coli, which save and prolong the life of humans, especially babies. The purpose of this system is to identify the E.coli activity in certain periods and urine specimens in patients. In fact, the rate of change in future activities, compared to the past, is based on the criteria set by the physician, and active, semi-active and normal classes of E.coli bacteria are identified.
In general, the target of this paper is evaluating for the bacteria activity of E.coli to classify patients. Therefore, providing intelligent diagnosis method for the patient identification , as well as improving the rate and accuracy of detection of E.coli bacteria infected urine specimens are the subsequent research aims.
The active bacterium is widely seen in their activity before and after taking the drug through injection. The bacteria, with normal activity, have slight effect on their activity before and after injection. Also, the semi-active bacterium is a bacteria whose activity before and after administration of the drug have moderate levels between normal and active.
According to the above-mentioned objectives, the questions of the research are as follows:
Is it possible to provide an efficient method for diagnosis of Escherichia coli in urine specimens of patients by data mining?
Is the fuzzy clustering algorithm fast and accurate in diagnosis of bacteria?
Is it possible to apply the criteria for diagnosis of Escherichia coli in the fuzzy clustering algorithm?
Is the fuzzy clustering algorithm able to classify members of a cluster?
This paper is organized as follows. Section 2 reviews the related works. Section 3 presents the proposed method as well as experimental results are given in section 4. Conclusion are reported in the last section.
2. RELATED WORKS
Literature review showed that there have been several studies about anticipating the diagnosis of various diseases using data mining. However, no studies related to E.coli bacteria diagnosis have
been yet reported.
Su et al. proposed a method combining the
artificial neural networks, decision tree, logistic regression and dependency rules by the use of 3D
body images. They took 2D as well as 3D images
of all body organs in different people (diabetics and healthy). Then, they extracted features such as abdominal surface, leg perimeter and hands' volume from the images. The features were given to four mentioned algorithms by the help of which the authors could achieve 89% accuracy in prediction of diabetic diagnosis. Artificial neural network was combined with logistic regression model to predict cancer by Lundin et. al. They selected 868 patients containing five, ten and fifteen years old patients with cancer. Tumour size, lymph node, tissue type, tubule formation, tumour necrosis and age were extracted as the features. They obtained 81.3% accuracy in average[2].
Delen et al. used neural networks and decision
trees along with statistical method (logistic regression) to develop predictive models of breast cancer using data mining. The results indicated that the decision tree (C5) was the best predictor
with 93.6% accuracy, artificial neural networks came out to be the second with 91.2% accuracy and the logistic regression models came out to be the worst of all with 89.2% accuracy. Their research results indicated that the decision tree algorithm was superior to other methods for extracting the knowledge from the existing data; and results were close to the reality[3].
Lakshmi et al. used technologically-developed
predictive models for breast cancer diseases using medical data mining techniques to find out the best model. They applied C4.5, SVM, K-NN, BLR
(Binary Logistic Regression), MLR (Multinomial
Logistic Regression), PLS-DA, PLS-LDA, K-Mean and apriori on the data set consisting of
5140 features of their study consisted of nine variables, namely clump thickness, uniformity of cell size, uniformity of cell shape, marginal adhesion, single epithelial cell size, bare nuclei, bland chromatin, normal nucleoli, and mitoses. Thus, the accuracy of above algorithms were 95.94%, 95.94%, 95.86%, 94.20%, 94.20%, 96.66%, 94.79%, 9425% and 92.97% respectively [4].
As it is clear from the literature review, all papers regarding data mining are related to other diseases and no papers are reported of this bacteria. Therefore, we will attempt to bring data mining to help of bacteria detection and achieve acceptable results. For instance, all reported works are in the field of cancer diagnosis and none of them in the area of diagnosis.
3. PROPOSED MODEL
In this paper, we have proposed to use of Fuzzy C Mean (FCM) algorithm to identify E.coli
bacterial activity in certain periods and urine specimens of patients. The identified bacteria are then measured against previous activities based on established criteria, and active, semi-active, and normal classes are determined. Fuzzy C-Means (FCM) is the most important and
widely-used algorithm for clustering which mainly extensively utilized fuzzy algorithm. The superiority of FCM to other clustering methods is
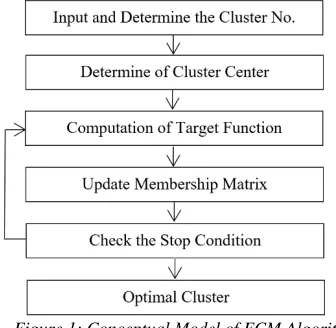
its fuzzy environment that has a better accuracy in solving problems than definitive environment. The flow diagrams of FCM clustering are shown
[image:3.612.96.264.516.680.2]in Figure 1.
Figure 1: Conceptual Model of FCM Algorithm
Fuzzy C-Means algorithm is a split clustering method which uses the Euclidean distance to measure the similarity of data and clusters. FCM
algorithm aims to find the best degree of sample membership in each cluster. In C-Means method,
each object belongs to a single cluster, while in
FCM each object might belong to several clusters
with degrees of membership between 0 and 1.
FCM algorithm optimizes the following objective
function:
2
1 1
( , ) c n m ( , )
ij i j i j
J U V U d v x
(1)where, m is called the fuzzy parameter, which is usually equal to 2 and C represents the number
of clusters. Uij stands for the degree of
membership of xi in the cluster j and it is obtained
using the following equation:
2/( 1) 1 ) 1 ( , ) ( , ij m c j i
k j k
u
d x v d x v
(2)The matrix for cluster centers is also obtained by equation (3).
1 1 n m ij j j i n m ij j U x v U
(3)In this paper, the number of clusters (C) is set
to three, which is the normal, active and semi-active cluster to determine the degree of membership for each sample based on the number of clusters and cluster centers. The specified target function for Fuzzy C-Means algorithm is
defined according to equation (4).
c n c n 2
m 2 m
ik ik ik k i
i=1 k=1 i=1 k=1
Target=
U d =
U x -v (4)where, m is a real number (usually 2) larger
than 1, xk is the bacterial activity (kth sample) and Vi is the representative of the ithcluster center.
Here, Vi determines the center of the normal,
active and semi-active cluster, and how much the activity of each bacteria depends on the Euclidean distance. uik shows the degree of membership of
the ithsample in the k-cluster, determined by the
5141
4. EXPERIMENTAL RESULT
In order to achieve the research objectives and to answer the research questions, the data obtained from the statistical society were analyzed. Data analysis is a multi-stage process in which the data is provided through the use of collection tools, and then summarized, categorized and eventually processed. 200 records of the patient’s dataset from Imam Ali Hospital at Zahedan are considered for clustering. Finally, accuracy results of FCM clustering are compared
with the Differential Evaluation (DE) algorithm.
The E.coli bacteria is divided into three normal, active and semi-active clusters. People with normal cluster are not patient and their E.coli
activity is normal. People who are in active clusters are suspected of being ill or on the verge of entering the disease. Active cluster people are completely sick and should be given priority to start special treatment.
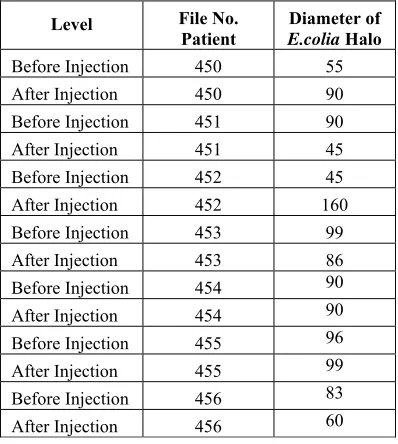
[image:4.612.335.510.181.337.2]First of all, the bacteria activity is calculated based on the size of the halo diameter. The degree of change in bacteria activity before and after drug administration is uses as the data for creating the cluster matrix. The period of the experiments is one month which consist of 6 stages before and after injection. Diameter of E.coli halo are reported before and after injection in Table 1. Diameter of E.coli Halo
Table 1: Sample of the Process of Testing People
Level File No.
Patient E.coliaDiameter of Halo
Before Injection 450 55 After Injection 450 90 Before Injection 451 90 After Injection 451 45 Before Injection 452 45 After Injection 452 160 Before Injection 453 99 After Injection 453 86 Before Injection 454 90 After Injection 454 90 Before Injection 455 96 After Injection 455 99 Before Injection 456 83 After Injection 456 60
The clustering results may be invalid if the main data is directly used for clustering. Figure 2
shows the clustering without any data pre-processing, which is based on the activity level of the E.colia bacteria. The first cluster contains the
individuals with normal bacteria (star sign); the
second cluster has semi-active bacteria (plus sign)
[image:4.612.90.289.473.695.2]and the third cluster contains the individuals with active bacteria (circle sign).
Figure 2: Clustering E.coli Activity without Pre-processing Data
The failure of this clustering was due to the lack of proper and accurate detection of bacteria with normal, active and semi-active activity. Therefore, the research procedure to decide cluster center can direct us to appropriate response to the problem. In fact, each iteration for determining the position of the cluster center can be a proposed solution to solve the problem.
The activity was first divided into the highest and lowest activity of the bacteria in the same period. In other words, the lowest bacterial activity in the period is divided by the highest bacterial activity in the same period. This is called the data normalization which aims to prevent the information dispersion and determine the bacterial activity in a fuzzy interval. The obtained number is between 0 to1. The difference of
normalized numbers, before and after injection, is considered for each period. This operation is in fact a criterion for bacteria clustering; and the highest number of differences indicates a large difference in activity during the same period. According to physicians, the model is also put in the cluster of the active bacteria. For each person, the amount of bacteria activity, at the same period before and after injection, was divided into the maximum and minimum amounts of activity of that period, so that all the data have values between 0 and 1.
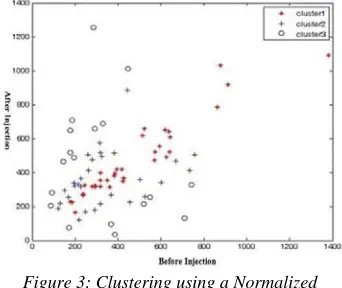
5142 As it is seen in Figure 3, people whose activity of
E.colia bacteria is too low or too high before and
after the injection are recognized as patients with active bacteria and placed in cluster 3. Here, people with a semi-active bacteria activity are shown with a plus sign at the bottom and top of the graph. Individuals diagnosed with normal bacteria activity are marked with a star sign at the middle of the graph. Table 2 presents normalized sample and absolute value of difference which indicating the activity amount of the bacteria before and after the injection.
Next, the data of the matrix is m×3, and thus they should be divided into normal, semi-active and active clusters. m refers to the number of samples in the matrix row. The attained amount from the process is between minimum and maximum data in the normal differential matrix, and the membership degree of each bacterium in a period is allocated to a desired cluster. Number of clusters in FCM clustering is equal to three(3).
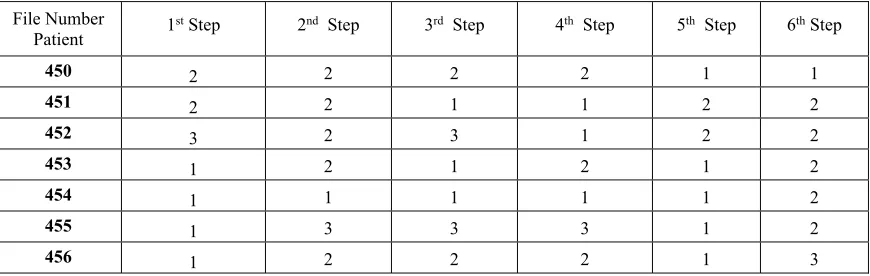
[image:5.612.318.533.36.259.2]A phase-based clustering of tests can be observed in Table 3.
Figure 3: Clustering using a Normalized Difference
Point A in Figure 4 shows a person with almost
no difference in the amount of E.colia activity
before and after drug injection. In clustering, this person is placed in a normal cluster because the amount of bacteria change in E.colia activity is
not significantly different at both or all stages. Point B shows a person who differs in the degree
of E.colia activity before and after the injection.
This person is put in active clustering because the amount of changes in E.colia activity is very
different at both or all stages.
Figure 4. FCM Clustering at the end of the 6th
Period
Figure 5 illustrates the clustered data in 5
regions named as A, B1, B2, C1, and C2. Region A belongs to cluster 1 or normal cluster. In most
diagrams, the largest population belongs to a normal cluster. Regions B1 and B2 belong to
semi-active cluster or cluster 2. Data in both areas may refer to people who are on the verge of disease. Then, regions C1 and C2 belong to
individuals who have high levels of E.colia
activity (cluster 3 or active cluster).
Figure 5. Normal, Active and Semi-active Regions after Clustering
[image:5.612.104.275.376.520.2] [image:5.612.340.503.386.523.2]5143 To identify the patients with E.colia active
bacteria, sum of the values was first calculated based on the results of clustering, and then arranged in a descending order. People with the total cluster values larger than 14 and between 15-18 are known as sample with high-activity E.colia
bacteria. The remaining individuals are part of the semi-active clusters (14-10) and normal (6-9)
clusters. All the results are given in Table 4. From this research observed that according to the obtained results, the convergence rate in the
FCM is more than DE. The Jm validation criterion
has been used to evaluate the convergence rate in
FCM clustering and DE algorithms. As is
observed in the Figure 6, the DE algorithm in
initial replication has higher Jm value than FCM
in the same repetition. So, the FCM algorithm acts
better than DE algorithm based on Jm criteria.
In Table 5, the values are observed by two FCM
and DE algorithms with 20 repetitions. In the first
repetition, the value of FCM is 0.77, while DE
algorithm is 2.93. Finally, in the 20th repetition,
the FCM algorithm convergence to 0.76 and DE
algorithm has a value 0.77.
File Number Patient
Normalized before Injection
Normalized after Injection
Normalized First Stage before
Injection
Normalized First Stage after Injection
Normalized Difference
450 55 90 0.61 1.00 0.38
451 90 45 1.00 0.50 0.50
452 45 160 0.28 1.00 0.71
453 99 86 1.00 0.86 0.13
454 90 90 1.00 1.00 0.00
455 96 99 0.96 1.00 0.03
456 60 83 1.00 0.72 0.27
Table3: Sample Clustering of Test Data
File Number
Patient 1
st Step 2nd Step 3rd Step 4th Step 5th Step 6th Step
450 2 2 2 2 1 1
451 2 2 1 1 2 2
452 3 2 3 1 2 2
453 1 2 1 2 1 2
454 1 1 1 1 1 2
455 1 3 3 3 1 2
[image:6.612.90.525.493.631.2]456 1 2 2 2 1 3
5144
Table4: Sample Sorted by the Total Test Data of People
File Number
Patient 1st Step 2nd Step 3rd Step 4th Step 5th Step 6th Step
Total Cluster Values in Descending Order
452 3 2 3 1 2 2 13
455 1 3 3 3 1 2 13
456 1 2 2 2 1 3 11
450 2 2 2 2 1 1 10
451 2 2 1 1 2 2 10
453 1 2 1 2 1 2 9
454 1 1 1 1 1 2 7
Table5: The value of Jm for 20 Repetitions of the FCM and DE Algorithms
Repetition FCM Algorithm DE Algorithm
1 0.776324 2.932812
2 0.776324 2.140048
3 0.766708 1.751725
4 0.765282 1.229503
5 0.763013 0.945057
6 0.762696 0.851583
7 0.762582 0.821546
8 0.762409 0.808653
9 0.762196 0.801249
10 0.762168 0.796000
11 0.762164 0.791813
12 0.762157 0.788264
13 0.762156 0.785161
14 0.762156 0.782400
15 0.762155 0.779917
16 0.762155 0.777676
17 0.762155 0.775649
18 0.762155 0.773821
19 0.762155 0.772179
20 0.762155 0.770714
5145
5. DISCUSSION
In this paper, we have proposed a model for evaluating of the bacteria activity of E.coli to classify the patients. Next, we have provided intelligent diagnosis method for the patient identification , as well as improved the rate and accuracy of detection of E.coli bacteria infected urine specimens. We have applied FCM
algorithm on our data set which we have collected form Imam Ali hospital of Zahedan.
According to the results obtained in this research, we are able to extract data from the identification of the bacterial activity of individuals in normal, semi-active and active clusters using data mining techniques. An intelligent diagnosis has been made with the use of comparing of each step with the same stage and determines the change in diameter of the E.coli bacteria hole in algorithm. Ultimately, a smart and real diagnosis has taken place.
In this section, it is necessary to point out that the FCM algorithm has been able to categorize individuals using data-mining activity of the E.coli bacteria. This algorithm has found a high convergence rate with respect to the differential evolution algorithm due to the use of fuzzy clustering and its integration with the actual criteria of the physician.
The limitations encountered during this research mainly related to collection of patient samples. Also, the lack of collaboration between patients and hospitals is another difficulty in medical research. Therefore, standard dataset is needed for future research to continue their studies.
REFERENCES
[1] O. Baronepel, A.D. Heymann, N. Friedman, G., Kaplan,
“
Development of an Unsupportive Social Interaction Scale for Patients with Diabetes”
, Patient Prefer Adherence, Vol.9, 2015, pp.1033-1041.[2]C. Su, C. Yang, K. Hsu, H. Chiu,
“
Data Mining for the Diagnosis of Type II Diabetes from Three Dimensional Body Surface Anthropometrical Scanning Data”
,Computers and Mathematics with Applications, Vol.51, 2006, pp.1075-1092.
[3]D. Delen, G. Walker, A. Kadam,
“
Predicting Breast Cancer Survivability: a Comparison ofThree Data Mining Methods
”
, Artificial Intelligence in Medicine, Vol.34 , No.2 , 2010,pp.113-127.
[4]K.R. Lakshmi, Y. Nagesh, M. VeeraKrishna,
“
Performance Comparison of Three Data Mining Techniques for Predicting Kidney Dialysis Survivability”
, International Journal of Advances in Engineering & Technology, Vol. 7,No. 1, 2014, pp.242-254.[5]M. Lundin, J. Lundin, H.B. Burke, S. Toikkanen, L. Pylkkanen, H. Joensuu,
“
Artificial Neural Networks Applied to Survival Prediction in Breast Cancer”
,Oncology , Vol.57, No. 4, 1999, pp.281-286.
[6]P.C. Pendharkar, J.A. Rodger, G. J. Yaverbaum, N. Herman, M. Benner,
“
Associations Statistical, Mathematical and Neural Approaches for Mining Breast Cancer Patterns”
, Expert Systems with Applications,Vol.17, 1999, pp.223–232.
[7]D. Zhang, L. Zhou,
“
Discovering Golden Nuggets: Data Mining in Financial Application”
, IEEE Transactions on Systems, Man, and Cybernetics, Vol. 34,No. 4, 2004,pp.513-522.
[8]H.C. Kob, G. Tan,
“
Data Mining Applications in Healthcare”
, Journal of Healthcare Information Management, Vol.19, No.2,2005, pp.64-72.
[9]H. Kaur, S.K. Wasan,
“
Empirical Study on Applications of Data Mining Techniques in Healthcare”
, Journal of Computer Science,Vol.2, No. 2, 2006, pp.194-200.
[10]B. Milovic, M. Milovic,
“
Prediction and Decision Making in Healthcare using Data Mining”
, International Journal of Public Health Science, Vol.1, No.2, 2012, pp.69-78.[11]J. Soni, U. Ansari, D. Sharma,
“
Predictive Data Mining for Medical Diagnosis: An Overview of Heart Disease”
, International Journal of Computer Applications, Vol.17,No.8, 2011.
[12]P. Panou,