4921
MODELING OF CYBER THREATS IN INFORMATION
NETWORKS OF DISTANCE EDUCATION SYSTEMS
1ADRANOVA A., 2 LAKHNO V., 3AKHMETOV B., 4KYSTAUBAYEVA A., 5MUSSAGULOVA G.
1Abai Kazakh National Pedagogical University, Kazakhstan
2National University of Life and Environmental Sciences of Ukraine, Ukraine 3 Yessenov university, Kazakhstan
4,5Al-Farabi Kazakh National University, Kazakhstan
E-mail: 1[email protected], 2[email protected], 3 [email protected], 4[email protected], 5[email protected]
ABSTRACT
The work is devoted to the further development of the model for solving the problem of information protection systems description in the context of its interpretation for indicators characterizing threats of attacks on information networks (INN) and distance education systems (DES) of large universities. It is shown that on the basis of the proposed additions to the existing models, it is possible to create specific correct Markov threat models of attacks on INN and DES. The researches have shown that, in conjunction with the development of new models and algorithms for choosing a rational investment strategy in cybersecurity (CS) of DES, you can improve the methodology for the creation of a functionally stable and protected DES. There is improved a method for detecting cyber threats in the INN and DES. The improved method, in contrast to the existing ones, contains recursive algorithms of distributed network self-learning and the choice of countermeasures (strategies, in particular, financial or technical for the protection side of the INN of DES) depending on the type of cyber threats. It is shown that the implementation of the proposed additions to the detection of cyber threats will allow the conclusion of informed decisions about the necessary countermeasures in order to improve the level of security of the INN of DES.
Keywords: cyber security, distance education systems, mathematical modeling, cyber threats.
1.INTRODUCTION
In the conditions of global digitalization of society, the distance education system (DES) is becoming more and more widespread in the field of education, due to the quality characteristics and features inherent only to them [1]. In parallel, the tasks of ensuring cybersecurity of information flows that contain confidential information and belong to DES, or are a part of its workflow, have been updated [4]. Existing typical solutions for the CS of DES, in the opinion of many researchers [2, 3, 5], can only partially solve the problems associated with information security and the CS of DES. All of the above mentioned determines the relevance of the research topic. All of the above mentioned determines the relevance of the researches within the article.
2.REVIEW AND ANALYSIS OF PREVIOUS RESEARCHES
4922 ensure that the operating environment is closed for the already tested software; to implement protection against the uncontrolled entry of potentially dangerous software (for example, containing “bookmarks” or leading to critical errors) to the INN (DES); to carry out self-protection against the means of IPT overcoming and protection against the entry and distribution of malicious software; to ensure the availability of DES information resources, for example, by backing up data; to ensure and to control the integrity of critical resources for the DES or for the DESU in general. Our research continues these works. However, as a toolkit, we chose the mathematical apparatus of Markov models, as well as simulation tools on the MatLab platform.
3.STATEMENT OF THE PROBLEM
The purpose of the work is the development of models and methods aimed at researching the issues of ensuring information and cybersecurity (IS and CS) of DES from cyber threats (CTh) in accordance with the concept of the creation of a functionally sustainable digital educational system of the university (DESU) and its component - DES. For this, the article describes an improved method for detection of cyber threats in DES.
4.METHODS AND MODELS
Detection of a cyber attack or an anomaly in the network traffic of the InS of DES is a state in which the function value
F
t
at any moment of timet
is distinguishable from the standard one [15, 16].The sets of internal and external cyber attacks against to the InS and DES can be represented as such tuples [12–15]:
О
(NN)
PP
h
, SS
ne
SS
CE
EST
RCA
,
,
,
,
(1)
)
k
m
(NN
k
О
PP
h
, SS
ne
SS
CE
k
l
ST
I
m
l
ICA
,
,
,
,
1
)
(
, (2)
where
RCA
,
I
CA
l(m)
remote and internal attacks on InS and DES in general, respectively; k – the level of criticality of the resource in the DES;EST
– external source of the CTh for DES;1
k-l
ST
I
– internal source of the CTh for DES; СЕ – network equipment used in the DES;h ne
, SS
SS
– IS and CD services on the attack distribution way in the DES; PP – protocols and packets in the InS; О – objects of access in InS and DES;N
N
mk – the node on which information is processed with the highest level of criticality (k), for example, a DES; l, m – numbers of nodes.The general approach in the course of threats and attacks modeling aimed at DES is the description of the created Markov models of threats of attacks with discrete states [15–18]. There is also taken into account the continuity of time in models of probabilistic modeling of input flows to calculate the required characteristics of cyber threats.
Since the task is to simulate the threats of attacks on DES, it is not necessary to take into account the sequence of use of the system vulnerabilities by the intruder.
Let the threat of attacks on DES is created by two classes (types) of cyber threats. In the simplest case, threats related to technological vulnerabilities are not considered. This is due to the fact that in the majority of cases such threats are leveled by the IPT of DES or DESU. Therefore, only vulnerabilities that are generated by errors (
i
) related to the implementation of software tools (j
) used in the DES are considered.Let consider the flow of events that occur at the input of a Markov chain that corresponds to the states of the DES. Let denote by
the intensity of incoming IF, and byS
ij the state of the system, wherei
,
j
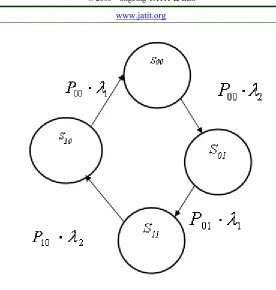
respectively, the vulnerability of the DES. In accordance with [17], it is believed that transitions between the states in a Markov chain occur instantaneously. Then, in accordance with the works [12, 14, 15–17], we can talk about the modification of the Markov model, which consists of the fact that the transitions between states in the graph, see fig. 1, will be marked asP
ij
.
4923
Figure 1: An example of the marking of the DES states graph for modeling the transitions between the states as a result of the implementation of cyber threats
Then the intensity of occurrence in the DES of the real CTh we write in the following form:
1
,
,R i
R i i
S S
S S S
a
P
(3)where
S
R1
the set of DES states, which are characterized by the absence of a CTh and the system is in such a state with a probabilityК1
;
SP
SR the state for which in DES thereis generated a real CTh.
Then the transition of DES from
S
R toR1
S
, as a result of the attack occurs with anintensity
SR1,SR.
For the graph shown onFig. 2.3 the intensity is defined as:
.
1 01 2
10
а
Р
Р
Since in the simplest case we can consider the stationary functioning mode of DES, then the intensity of eliminating real threats for the graph 2.3. can be defined as:
1
.
11 1 01 2 10
0
Р
Р
Р
Р
а а а
(4)Then the probability that the DES is ready for safe operation, in terms of the likelihood of preventing cyber attacks, can be determined:
.
2
2
1
1
1
2
2
1
2
1
0
а
Р
(5)The graph presented on Fig. 1 shows only a general approach to the problem of cyber attack threats modeling, for example, directed on DES or DESU. Taking into account the provisions that are considered in [18–22], we can formulate the following postulates, which relate to the problems solved in the framework of the article:
4924 2. During the process of threats modeling and the subsequent stage of developing strategies in order to counteract these threats for the DES, we can use the mathematical apparatus of Markov chains, i.e. models with discrete states and continuous time for events.
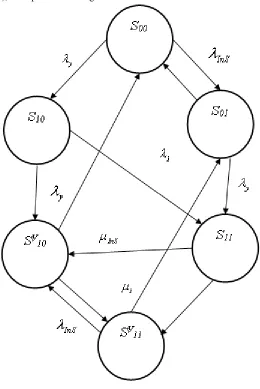
During the cyber threats modeling for DES, in case of the presence of standard protection measures (firewall, antivirus, DES account control, data backup system, etc.), it is possible to neglect
[image:4.612.190.450.207.596.2]the probability that several vulnerabilities appear simultaneously in the system. Then the labeled state graph for the stochastic process, in which the threat of potential vulnerability is leveled immediately after receiving data on its occurrence and till its elimination [20-24], can be represented as follows, see fig. 2:
Figure 2: The state graph for the stochastic process in the DES, in which the threat of potential vulnerability is leveled by the IPT immediately after receiving data on its occurrence and till its elimination
On fig. 2, following notations for system states (vertices of the graph) are adopted:
S
00
there are no not canceled vulnerabilities in the DES;
10
S
vulnerability has arisen, but suitable protection mechanisms are not yet involved;
10
V
4925 IPT (for example, anti-virus signatures are outdated), but not eliminated;
S
11
vulnerabilities in the DES occur, but not eliminated, the IPT has not yet enabled the backup function, since the vulnerability has not yet been confirmed;
11
V
S
vulnerability was confirmed and begins with an intensity
yy the process of its restoration of DES, however, vulnerabilities in IPT have not been eliminated [21-24].Then the intensities that describe the process of transition of the system from state to state will be denoted as follows: ythe intensity with which vulnerabilities occur in the DES;
yV
the intensity with which vulnerabilities are identified in the DES;
yy
the intensity with which the identified vulnerabilities in the DES are eliminated by the staff of the DES or by the software developer;
InS
the intensity with which vulnerabilities occur in IPT of DES;
InS
the intensity with which the identified vulnerabilities in the IPT of DES are eliminated.Then, taking into account the created graph, it is possible to calculate the probability that the DES is ready for safe operation from the point of view of its security, i.e.
P
0yInS:,
10 01 00 0 VyInS
P
P
P
P
(6)
where
P
00,
P
01,
P
V10
probabilities that the DES is in the statesS
00,
S
01,
S
V10,
respectively.For the model shown on fig. 2, the intensity of the occurrence of failures
0 in terms of cybersecurity against the threat of attack (i.e.10 01 00 V
S
S
S
) will be defined as:
00 01
01 10 .0y P P InSP PV
(7)
Then the intensity of the restoration of the DES parameters in relation to the cyber attack threat directed on it can be defined as follows:
. 10 01 00 10 01 01 00 0 V P P P V P P InS P P y (8)
At the final stage of the modeling there can be calculated:
1) the time between failures for DES safety metrics: 0
1
oT
;2) the average recovery time of the DES after the
attack:
1
,
V o
V
T
where
;21 11 01 21 10 P P P a P P inS InS
a
the intensity of the occurrence of real attack threats directed on the DES;
P
11,
P
21
respectively, the probability of statesS
11,
S
21, i.e. when it is possible to implement 2 or more threats of attacks,3) the average recovery time of security systems (ISS) of DES after the attack:
T
Oo
T
o
T
Vo.
The given approach of modeling the CTh for the DES, at the next stage of the research, makes it possible not only to evaluate the reliability characteristics of the DES as an object of protection, but also to develop protective strategies, including such components as technical, organizational and financial. The cumulative implementation of which will allow maintaining the security level of DES from threats for the required period of time.
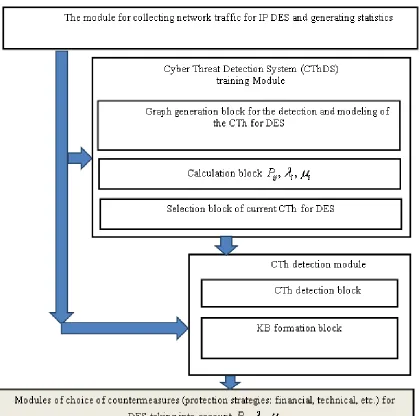
Conceptually and logically, the cyber threat detection system for DES should include the following basic modules, see fig. 3: 1) module for collecting traffic and generating statistics; 2) the training module of the cyber threat detection system (CTh); 3) the module for the detection of the CTh and the alerts module.
In the first module, all traffic is intercepted, which passes through the nodes of the InS of DES and highlights the features of the CTh, and then generates statistics, which it transfers to the training module.
The main objective of the training module is to creaate a cyber-threat detection graph (CThDG). This graph collects information about all known threats, in particular, those that are stored in the knowledge base (KB) of DSS or ES for recognition. Therefore, a complete picture of the current situation in the field of IS and CS of InS DES is obtained [24–29].
4926 impact (for example, by using hardware and software protection) or to choose an appropriate financial or organizational strategy to respond or to prevent potentially dangerous threats. Therefore, the main purpose of the cyber threat detection graph (CThDG) is to describe the possible cyber attacks (CAt) and the results of their impact on network nodes.
The cyber threat detection graph (CThDG) can be described by the following expression:
U
R
CThDG
G
,
, (9) [image:6.612.99.519.213.629.2]where
U
set of graph vertices of cyber attacks directed on at DES;R
a set of directional edges, which connect the tops of the CThDG.Figure 3: Model of cyber threats detection in InS of DES
The top of the cyber attack alert graph (CAtAG) can be of three types:
dv
U
vulnerability display nodes;
ruv2927 The set of vertices of the graph CThDS
U
indicates possible vulnerabilities of DES and is defined as:.
is ruv
dv
U
U
U
U
(10)The set of edges
r
R
pe
U
dv
U
rusreflects the fact that nodes
U
dv must be executed in order to reach the nodesU
ruv.
. The edgedv ruv pos
U
U
R
r
reflects the fact thatnodes
U
dv must be obtained for the equality forthe nodes
U
ruv:,
pos
pe
R
R
R
(11)where
R
pe
the edges that reflect the relationship between the result, when the vulnerability was used in the previous node and the vulnerability of the next node;R
pos
the edges that reflect the relationship between the result of using a vulnerability in the previous node and the possibility of using it in the next node.For the cyber threat detection module in the InS of DES, there is constructed a graph displaying a cyber attack alert (CAtAG). This graph is a set of vertices that reflect vulnerabilities and vertices that reflect the use of these vulnerabilities. The CAtAG graph contains a set of oriented edges that form vertices among themselves from the set of possible cyber attack paths (CAt), in accordance with the time stamps. This generates appropriate network traffic alerts on the InS nodes. As a result, you can get a class of such alerts that will indicate a possible cyber threat in the corresponding node. In this way, we obtain the CThDG, which reflects the alerts in the corresponding nodes. In order to track the development of a cyber attack, you need to track the IP address source and the cyber attack path.
The graph displaying a cyber attack alert (CAtAG) can be described as follows:
A
,
R
,
P
.
G
ГOКрАт
The complexA
is theset of all alerts. In this case, the alert
a
A
is a data structure, including the IP address of the sender, the IP address of the recipient, the type of alert and a time stamp.All messages are tied to two vertices
U
dv,
U
ruv
in the CThDG. This is due to the useof a function
map
a
that shows the route of the nodes:
vul dv U cl a node ruv U pr a node dv U al a ruv U dv U a a map ,, (12)
where
U
dv
a vertex that reflects thevulnerability of a resource in the DES;
U
ruv
a vertex that reflects the result of vulnerability exploit;a
al
an alert with source IP address;
node dv
U
a vertex that corresponds to a specificnode in the DES information network;
a
pr
an alert with the IP address of the destination node;
node ruv
U
a vertex that corresponds to a specific node in the InS of DES associated withU
dvvul ;
cl
a
vulnerability class alert;
vul dv
U
vulnerability in the DES node, which is considered during the modeling process.Oriented edges
R
are a correlation between two alerts
a
,
a
, in case when the criteria do not exceed the threshold values:
atimeatime
atime atimethreshold value
(13)where
a
time
time stamp pointing to previousnode;
a
time
time stamp pointing to the nextnode.
Then, we will obtain:
2928 The cyber attack alert display graph contains a set of cyber attack paths -
P
.
The route
M
i
P
is a set of related alerts in the order of entry into the system, which belong to the same cyber attack scenario directed to the DES.Each ordered pair
a
,
a
in the CAtAG is compared with two adjacent vertices in theCThDG. The difference in the hourly marks of alerts is assumed to be two.
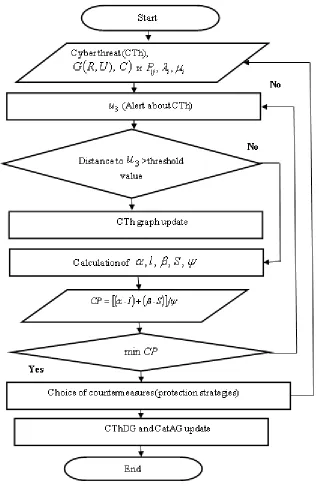
[image:8.612.148.467.206.692.2]The CAtAG graph indicates the dependence of alerts in a temporary order. This allows to find alerts associated with the same cyber attack scenario by searching for alerts in CAtAG, see fig. 4.
4929 The sets of attack paths in the CAtAG are used to store all the paths from the initial node of the graph to the target node in the CTh. Each path is an alert that belongs to the same target of a cyber attack and CThDG. After the detection of a cyber attack, the CThDG is updated for further memorization of possible cyber threats for InS or CICS.
In the cyber threat alert module, there are selected countermeasures for the cyber threat detection scenario for a specific DES or DESU. In order to implement with the help of the DSS the output of decisions on the required form and the level of protection based on data received from disparate sources in the context of dynamic changes in the InS goals control. The purpose of choosing a countermeasure is to protect the InS or CICS nodes from being compromised.
In order to assess the status of network security vulnerabilities and to determine the current InS configuration, it is necessary to use the information security indicators and the CS in the cyber attack detection column. The graph (CAtAG) contains information about the vulnerabilities of the DES.
For the initial or external nodes (i.e. the root node
U
is
U
ruv), there is an a priori probability of a possible source of a cyber attack. To indicate the probability of a priori risk of agraph node
U
is, there is used an indicatorGU
from the vulnerability base. The value
GU
is usually assigned with a high probability, for example, from 0.75 to 1.For the developed method of defining cyber threats, it was proposed to introduce a mitigation index for the effects of an attack, for which there are developed countermeasure instructions in a database (DB) of countermeasures:
С
1,...,
С
n
;
Q
(15)where
Q
DB of countermeasures that are recommended to be accepted by the owner of theDES at detecting vulnerabilities or cyber attacks;
С
countermeasures to prevent compromise of the DES information network node.Each countermeasure
C
Q
.
In this way, countermeasures can be written in general as:
S
,
I
,
C
(16)where
S
the costs required to apply countermeasures in terms of resources and operational complexity;I
a decrease in productivity or a “negative effect” (intrusiveness [26]) that the InS subscriber feels as a result of the implementation of new countermeasures. This parameter is defined in the range from 1 to 10 (we believe that the highest score indicates a higher cost).Intrusiveness is 0 if countermeasures do not reduce the quality of service provision in InS or CICS. Therefore, it is necessary to choose such countermeasures that correspond to the lowest value of the complex indicator of the choice of means of protection - countermeasures.
In order to select the necessary countermeasures and to achieve the goal of DES protection from cyber attacks, it is proposed to use a complex indicator:
I
S
,
CP
(17)where
,
characteristics of the impact of countermeasure indicators on the overall effectiveness of the InS; coefficient of rationing.As a result of the use of an improved method for cyber threats detection in the intelligent information network, it becomes possible to separate the path of a cyber attack. This, in turn, will force the attacker to look for other alternative ways to achieve his goal.
5.IMITATION EXPERIMENT
In order to test the proposed method of cyber threats detection for DES, there was tested a software module, which was described in publications [28, 29].
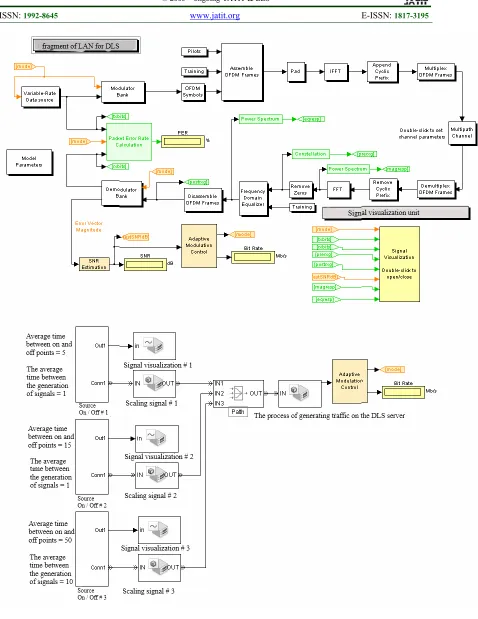
During the simulation in the MATLAB environment for the InS of DES segment, see fig. 5,
4930
4931
Table 1 - The test results during the simulation of the software algorithm and the method of cyberthreats recognition and the selection of appropriate countermeasures to prevent compromising the InS node Cyber threat
class (taken countermeasures - Response variants C)
U2R
А=2, В=3, Ра = 0,54 А=1, В=1, Ра = 0,242
Terminating the Attack Session with the
node – attack source (AST) subscriber (AWS) Sending a warning to the
R2L А=1, В=3, Ра = 0,4-0,45 А=1, В=1, Ра = 0,192
AST AWS
DOS/DDOS А=2, В=3, Ра = 0,6-0,65 А=1, С=2, Ра = 0,4-0,5
AST AWS
External attack via
Wi Fi А=3, С=3, Ра = 0,678 А=1, С=2, Ра = 0,4 А=1, С0,3 =1, Ра = Access point block DOS attack on the
attacking station Lack of response Remote attack
through the InS perimeter
А=3, В=4, С=2, Ра = 0,82
А=1, В=1, С=1, Ра = 0,224
А=1, Ра = 0,076
Blocking access to the InS server
Reconfigure security services in order to block IP
AWS
The results of simulation and testing of an improved method of cyber threats recognition and the selection of appropriate countermeasures in order to prevent the InS node for DES from being compromised have showed that:
1) the proposed approach allows a 5–7% reduction in computational complexity at decision-making on identifying threats in the InS in comparison with the methods described in [2, 16– 25];
2) an improved method for cyber threats detection in the InS and DES (or DESU) can be applied to the designed and existing DSS according to IS and CS of DES of universities and other educational institutions.
The proposed approach has the following advantages in comparison with similar solutions used in threat recognition systems for various informatization objects, including for DES [2, 21– 32]:
the method allows to assess the level of information security on the protection object,
consisting of a set of nodes in which information of different levels of criticality is processed, including for DESU and DES;
you can set the initial data on the amount of segments and nodes of information networks of the university distance education system, taking into account the levels of information resource criticality; there is provided a prompt assessment of countermeasures to protect InS.
However, for the full application of the described method, it is necessary to create a graph of threats for a specific InS, DES and its IPT. This is due to the fact that the specifics of the organization of the DESU can be quite different. For example, depending on the scale of the institution and on the organization of relevant information flows in it. Therefore, at the current stage of research in the framework of the 2nd chapter of the dissertation, we have limited ourselves with the use of the MatLab package and the simulation modeling of the InS of DES segment.
6. CONCLUSIONS
The following results were obtained:
the model for solving the problem of describing information protection systems in the context of its interpretation for indicators characterizing the attacks threats on InS and DES has been further developed. It is shown that on the basis of the proposed additions to the existing models, it is
possible to create concrete correct Markov models of attacks threats on InS and DES;
4932 functionally stable and protected DES can be improved;
the method for cyber threats detection in the InS and DES was improved. The improved method, in contrast to the existing ones, contains recursive algorithms for distributed network self-learning and the choice of countermeasures (strategies, in particular financial or technical for the protection side of the InS of DES) depending on the type of cyber threats;
It is shown that the implementation of the proposed additions to the detection of cyber threats will allow for the conclusion of informed decisions about the necessary countermeasures in order to improve the level of security of InS of DES. At the same time, information about cyber threats coming from different sources in the InS of DES (or DESU) is analyzed in the context of the dynamic change of the InS of DES goals control in real time.
REFERENCES:
[1] R. I. Vergazov. System of automated remote testing / R.I. Vergazov, P.A. Gudkov // New information technologies: Th. report The Eighth International Student School Seminar. - Crimea: Penza State University, 2000. [2] P.S.Lozhnikov. “User Recognition in Distance
Education Systems”, Educational Technology & Society, 2001, № 4.
[3] B.N. Makhutov. “Protection of electronic textbooks in distance learning”, Education of the XXI century: innovative technologies, diagnostics and control in terms of informatization and humanization: Materials of the III All-Russian Scientific and Methodological conferences with international participation (KSPU), Krasnoyarsk,2001, pp. 106 - 108.
[4] A.A. Mochalov. “Effective management of distance education system” / A. A. Mochalov, P. A. Stepanov // Dg. of scientific works - Nikolaev: NUK, No.5(434), 2010, pp. 130– 133.
[5] V.V. Furin. “Directions in the development of legal support of information security in distance education”, Information technologies in education: Mater. All-Russia. scientific-practical conf. MSU, 2005, p.83.
[6] D. I. Kotenko, I. V. Kotenko, I. B. Saenko. “Methods and tools for modeling attacks in large computer networks: the state of the problem”, Tr. SPIIARAS, Vol. 3 (22), pp. 5– 30.
[7] D.Koller, N.Friedman. “Probabilistic Graphical Models”, Principles and Techniques. MIT Press, 2009.
[8] I.V. Kotenko, M. V. Stepashkin. “Analysis of the security of computer networks based on the simulation of the actions of intruders and the construction of an attack graph”, ISA RAS, Vol. 31, 2007, p. 126–207.
[9] A.P. Rosenko. “Internal Security Threats for Confidential Information: Methodology and Theoretical Research”, Krasand, 2010.
[10] K.V.Ivanov, P. I.Tutubalin. “Markov models of protection of automated systems for special purposes”, State Budgetary Institution “Republican Center for Monitoring Quality of Education”, Kazan, 2012.
[11] V.V. Karpov. “Probabilistic model for assessing the security of computer equipment with a hardware and software complex for protecting information from unauthorized access”, Software products and systems, No. 1, 2003, p. 31–36.
[12] K.A. Shcheglov, A.Yu. Shcheglov. “Markov models of information system security threat”, Bl. universities. Instrument makin, Vol. 58, No. 12, 2015, p. 957–965.
[13] K. A. Shcheglov, A.Yu. Shcheglov. “Mathematical models of operational information security”, Information Security, Vol. 106, No. 3, 2014, p. 52–65.
[14] K. A. Scheglov, A. Yu. Scheglov. "Interpretation and modeling of the threat of an attack on an information system. Part 1. Modeling the threat of vulnerability and the interpretation of the threat of attack”, Information technology, Vol. 21, No. 12, 2015, p. 930–940.
[15] K.A. Scheglov, A.Yu. Scheglov. “Interpretation and modeling of the threat of an attack on an information system. Part 2. Modeling the threat of attack”, Information technology, Vol. 22, No. 1, 2016, p. 54–64. [16] T.I. Aliev. “Basics of discrete systems
modeling”, Publishing House of St. Petersburg State University ITMO, St. Petersburg,2009.
[17] E. Wentzel. “Operations Research”, S. radio, 1972.
[18] O.Al-Jarrah, A.Arafat. “Network Intrusion Detection System using attack behavior classification”, 2014 5th International Conference on Information and Communication Systems (ICICS), 2014.
4933 Computers in Human Behavior, Vol. 48, 2015, p. 51–61.
[20] A.Kh. Nishanov, K.F. Kerimov. “Methods of Counteraction from Attacks Carried out Against Users in a Network the Internet”,
ICEIC-Electronics, news and communications, IX-the conference, Tashkent,
2008, p. 298–299.
[21] M.M. Gamal, B.Hasan, A.F.Hegazy. “A Security Analysis Framework Powered by an Expert System”, International Journal of Computer Science and Security (IJCSS), Vol. 4, No. 6, 2011, p. 505–527.
[22] Chang Li-Yun, Lee Zne-Jung. “Applying fuzzy expert system to information security risk Assessment – A case study on an attendance system”, International Conference on Fuzzy Theory and Its Applications (iFUZZY), 2013, p. 346 – 351.
[23] M. Kanatov, L. Atymtayeva, B.Yagaliyeva. “Expert systems for information security management and audit”, Implementation phase issues, Soft Computing and Intelligent Systems (SCIS), Joint 7th International Conference on and Advanced Intelligent Systems (ISIS), 2014, p. 896 – 900.
[24] Kuo-Chan Lee, Chih-Hung Hsieh, Li-Jia Wei, Ching-Hao Mao, Jyun-Han Dai, Yu-Ting Kuang. “Sec-Buzzer: cyber security emerging topic mining with open threat intelligence retrieval and timeline event annotation”, Soft Computing, 2016, p. 1–14.
[25] V.Lakhno, S.Kazmirchuk, Y.Kovalenko, L.Myrutenko, T. Zhmurko. “Design of adaptive system of detection of cyber-attacks, based on the model of logical procedures and the coverage matrices of features”, Eastern-European Journal of Enterprise Technologies, No 3/9(81), 2016, p. 30–38.
[26] P. Louvieris, N. Clewley, X.Liu. “Effects-based feature identification for network intrusion detection”, Neurocomputing, Vol. 121, Iss. 9, 2013, p. 265–273.
[27] Z.Wang, X.Zhou, Z.Yu, Y.He, D.Zhang. “Inferring User Search Intention Based on Situation Analysis of the Physical World”, Chapter Ubiquitous Intelligence and Computing, Vol. 6406, 2010, p. 35–51.
[28] B. Akhmetov et. al. “Designing a decision support system for the weakly formalized problems in the provision of cybersecurity”, Eastern-European Journal of Enterprise Technologies, Vol. 1, Issue 2 (85), 2017, p. 4– 15.
[29] G.Beketova, B.Akhmetov, A.Korchenko. “Simulation modeling of cyber security systems in MATLAB and SIMULINK”, Bulletin of the national academy of sciences of the republic of Kazakhstan, Vol. 3, 2017, p. 54–64.
[30] B.Akhmetov et. al. “Decision support system about investments in smart сity in conditions of incomplete information”, International Journal of Civil Engineering and Technology, 10 (2), 2019, pp. 661-670.
[31] B. Akhmetov et. al. “Model of mutual investment in smart city with costs for obtaining data by second investor”, International Journal of Mechanical Engineering and Technology, 10 (2), 2019 pp. 451-460.