ORIGINAL RESEARCH ARTICLE
STUDY AND APPLICATION OF MORTAR WITH RESIDUES OF EXPANDED POLYSTYRENE
*
Menezes, Izabella, Oliveira, Daiana M. de, Silva, Simone B. da, Souza, Tauane E. B.,
Barbosa, Luisa A.G. and Lintz, Rosa C.C.
Doutora, Universidade Estadual de Campinas Faculdade de Tecnologia
ARTICLE INFO ABSTRACT
The civil construction generates waste throughout its life, from the extraction of the used resources, the work implementation, until its demolition. It also has a very great amount of waste during the execution of the project being a great generator of ”garbage”, causing material waste and increasing the final costs. Furthermore, this intensification of disposed materials can overload the landfill, increasing the price of waste disposal and having a space shortage for this type of service. One way to make construction more sustainable is to replace the conventional aggregate with a recyclable material, minimizing environmental problems and reducing construction costs. In this study, expanded Polystyrene (EPS) was chosen to replace 20% and 40% of the sand which was used in the mortar. Although the EPS consists of 98% air and it takes up a large space to dispose, it has been growing and being increasingly valued in Brazilian civil construction once it is a lighter product and has acoustic and thermal absorption, differently from the sand which consists of 98% of air and it takes up a lot of space at the time of disposal. However, the reuse of EPS has been growing and being increasingly valued in the Brazilian civil construction.The tests of calorimetry, bending traction resistance and compression showed that the EPS is a good material for the mortar production and it has been proven to be a good material to compete with to the others on the market.
Copyright © 2018, Menezes, Izabella et al. This is an open access article distributed under the Creative Commons Attribution License, which permits unrestricted use, distribution, and reproduction in any medium, provided the original work is properly cited.
INTRODUCTION
The civil construction area has grown in Brazil, and with this growth, there is a massive consumption of the raw material, which are non-renewable natural resources and a great residue generation [NBR, 2016]. In attempt of reducing the raw material extraction and resources waste, which brings forth a very large quantity from residue, the reuse of material which would be eliminated is a solution to the production of cement manufacturer. The objective of this paper is to develop mortar substituting the aggregate with EPS (20% and 40%), respecting the requirement of the technical standards. Considering the substitution of sand, which is a natural aggregate extracted from the environment, with one which can be reused and that could be sent to landfill. The EPS known as Styrofoam was discovered in 1949 by the chemists Fritz
*Corresponding author: Menezes, Izabella,
Doutora, Universidade estadual de Campinas Faculdade de Tecnologia.
Stastny and Karl Buchholz when working in the Basf laboratories, in Germany [Abrapex, 2017]; it is a hard cellular plastic, results from the styrene polymerization in water. This material is harmless to the environment, recyclable and can be easily handled [Strecker, 2014]. Furthermore, it has some advantages within the civil construction, such as thermal and acoustic insulation, durability, thermal expansion, steam resistance, impermeability and it also results a much lighter product. The use of EPS in the civil construction are manifold, even in large framework construction, such as roads and railroads [Moraes, 2015], in addition to being present in walls, roof slabs, fillings and light concrete. Mortar is defined as a homogeneous compound which includes little aggregate, inorganic binding agent and water. It may contain additive be titrated in site or industrialize [Strecker, 2014]. There are several kinds of mortars, such as the ones used in layings, cladding and framework recuperation. The mortars are used for laying with load-bearing, sealing and complementation masonry (upperbelt); when cladding, the mortars are used in internally, externally, for general purpose, in plaster,
ISSN: 2230-9926
International Journal of Development Research
Vol. 08, Issue, 06, pp.21097-21102, June, 2018
Article History:
Received 14th March, 2018
Received in revised form 27th April, 2018
Accepted 13th May, 2018
Published online 30th June, 2018
Available online at http://www.journalijdr.com
Key Words:
Recycling, EPS, Mortar.
Citation: Menezes, Izabella, Oliveira, Daiana M. de, Silva, Simone B. da, Souza, Tauane E. B., Barbosa, Luisa A.G. and Lintz, Rosa C.C., 2018.
“Study and application of mortar with residues of Expanded Polystyrene”, International Journal of Development Research, 8, (06), 21097-21102.
decoratives, in tiles, and ceramics sidings. Researches have shown that the use of EPS is viable and possible to be used substituting the sand in mortar. The fresh mortar workability determines its facility of application; the mortar substituting sand with EPS shows consistency above reference trait, obtaining better scattering. In relation to the compression resistance, the replacement with up to 15% of sand did not have a relevant loss [Fontoura, 2017]. When comparing conventional concrete to cement-based composite with addition of EPS, the last one showed smaller water absorption [Fontoura., 2017]. During the years, civil constructions have been the target of researches that focus on discovering new technologies and new materials to be used on the civil construction. The hunt for cannibalization of materials which would be discarded in landfill, such as EPS or residue of the construction itself, has brought on astounding results. Section 2 of this paper will be about material and methods and section 3 about results and discussions.
MATERIALS AND METHODS
All the characterization and tests below were carried out at FT -Unicamp College of Technology, in the Laboratory of Soil and Laboratory of Civil Construction Materials.
Material
From the quartering process with mechanical splitter (ABNT NBR 27:2001), the EPS and the sand were separated during size tests by screening and physical indexes tests. The materials used were: cement: CP V- ARI (Compositions for CP V -ARI: calcium, aluminium and iron silicate, Calcium Sulfate and Carbonate filler), with specific mass of 3,15 kg/m; fine aggregate: fine sand with specific mass of 2,65 kg/m; and EPS (with a diameter of 4,8mm) with specific mass of 10 kg/m; chemicals werent used. The aggregates have been characterized according to the ABNT NBR 30:2001 [Brazil, 2001]; ABNT NBR 45:2006 [NBR, 2016]; ABNT NBR 52:2009 [NBR et al., 2009]; ABNT NBR 248:2003 [NBR,
2003] ; ABNT NBR 7211:2009 [[10] NBR] ; and
ABNT NBR 13281:2005 [NBR, 2005] Brazilian Standards.
Mortar Production
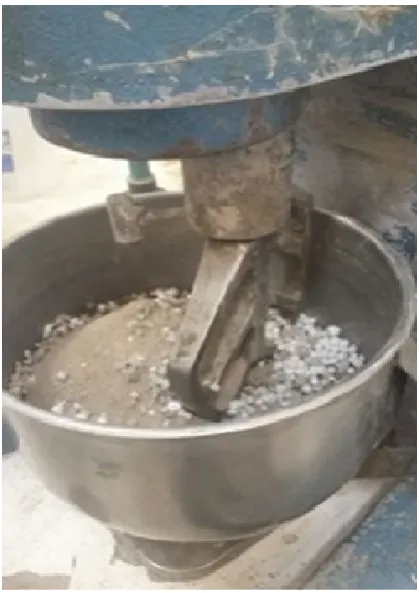
[image:2.595.330.540.65.362.2]After the physical characterized physical characterization of aggregate the specimen production began. The dosage of the mortar destined to the study, illustrated in Table I, was entirely experimental, based on preliminary studies. One reference mark and two displacement marks were done, substituting 20% and 40% sand with EPS and keeping the same quantity of cement. The mark used was 1:3 (cement:sand) and the w/c (water/cement) ratio of the mortar reference was 0,60. Resuming the water cement ratio for the displacement marks, the mortar was more liquid than a conventional mortar. The water cement ratio was adjusted, because EPS doesnt demand as much water as sand [Brs]. The EPS was not earlier saturated and because it absorbs less water than sand, the amount of water was titrated and adjusted for every displacement mark. The measure of the specimen are: 40mm of breadth, 40mm of height, 160 mm of length, base area of 6400mm, smaller area of 16mm and bulkiness of 0,256 litres.The mortar applied in this research was prepared by a mechanical mixer of approximately five liters and a metal
[image:2.595.329.536.384.657.2]Fig. 1. Preparation of mortar in mechanical mixer
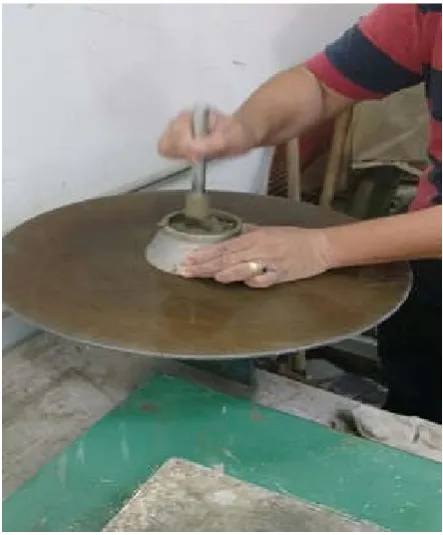
Fig. 2.The mortar after going through narrowing table
blade which rotates around itself and (in planetary movement, around the pan axis, being in opposites directions). For each mark with fresh mortar, 10 prismatic specimen of 4cm x 4cm x 16cm were molded, being narrowed in a narrowing table, and the determination test of consistency index was carried out. The specimen was unmolded 24 hours after densification and hereupon they were flagged and transported to humid camera, remaining until the last test day as established by the ABNT NBR 7215:2009 and ABNT NBR 13276:2016, as shown in Figure 1, Figure 2 and Figure 3.
The test in fresh state- Consistency Index
The consistency index of the mortar has been determined according to ABNT NBR 13276/2016, enabling measurement of the mortar scattering.
Fig. 3. Specimen molded with mortar
[image:3.595.159.437.149.287.2]One test for each mark was carried out, the reference and displacement, emphasizing that for each mark the a/c (water/cement) ratio applied was different.
[image:3.595.143.453.325.461.2]Fig. 4.Consistency index test of performance/execution Table 1. Quantities of Materials (In Grams)
MATERIAL Reference Mark (g) Displacement Mark 20% (g) Displacement Mark 40% (g)
Cement CPV-ARI 624.00 624.00 624.00
[image:3.595.323.545.518.786.2]Sand 1872.00 1497.60 1123.20
Table 2. The tests of resistance compression results (mpa), seventh and 28th days
7th
Specimen Reference 20% 40%
01 30.40 22.80 14.71
02 26.36 21.94 16.92
03 25.62 20.41 16.92
04 26.60 22.49 20.59
05 28.32 24.17 21.21
28th
Specimen Reference 20% 40%
06 32.06 25.62 20.10
07 35.24 26.23 18.76
08 35.06 19.86 20.59
09 34.94 27.21 17.35
10 30.52 25.87 15.75
Table 3. The results of tension resistance tests (mpa), on the seventh and 28th days
7th
Specimen Reference 20% 40%
1 8.61 6.98 6.32
2 8.94 7.86 6.34
3 8.71 6.57 8.32
4 8.87 7.05 6.20
5 7.97 6.59 6.75
28th
Specimen Reference 20% 40%
6 9.21 8.71 6.96
7 9.28 6.48 6.66
8 8.73 6.18 7.74
9 8.80 8.29 5.58
10 8.91 7.24 7.63
[image:3.595.63.262.542.782.2]A cone-shaped mold was filled with fresh
consistency tests. It was centralized on the table in three layers and wacked by the socket, following the norm. After filling the mold, the hand crank was used in a way that the table rose and fell 30 times in 30 seconds and, after the last fall, the scattering was immediately measured. Three measures were realized for each mark and they didnt exceed five mm of difference. In Figure 4 the consistency test was checked. The consistency test result, on average, was 213,66mm.
[image:4.595.35.286.192.309.2]Test of Calorimetry
Fig. 5. Equipment FieldLogger, to the left with the cap closed, in the middle with the cap open, where the mortar was placed for the data collecting and, to the right, with the mortar inserted in
[image:4.595.320.547.349.548.2]equipment
Fig. 6.Mortar separated for the calorimetry test
The calorimetry test doesn’t have specific norm, but it was realized with objective to determine kinetics chemical reactions of mortar substituting the sand with EPS. The equipment utilized contains thermocouple reader sign
Logger with thermocouples T type,that measures the temperatures in the stipulated time). It is made of a wooden box coated with another styrofoam box, and the data collecting is done through an adapted methodology focusing on determination of temperature versus time. The test enable identification of beginning and ending time in an accurate and consistent manner compared to NBR 65 norm. The Figure 5 and 6 represent the equipment and material used for experiment.
Test of resistance to the tension in bending traction and compression
The determination of the resistance to the tension in bending traction and compression were determined according to ABNT NBR 13279:2005, discovering the resistance endured by the compound.
21100 Menezes, Izabella et al.
[image:4.595.43.285.372.512.2]shaped mold was filled with fresh mortar for the consistency tests. It was centralized on the table in three layers and wacked by the socket, following the norm. After filling the the hand crank was used in a way that the table rose and t fall, the scattering was immediately measured. Three measures were realized for each mark and they didnt exceed five mm of difference. In Figure 4 the consistency test was checked. The consistency test
Fig. 5. Equipment FieldLogger, to the left with the cap closed, in the middle with the cap open, where the mortar was placed for
he mortar inserted in
arated for the calorimetry test
The calorimetry test doesn’t have specific norm, but it was realized with objective to determine kinetics chemical reactions of mortar substituting the sand with EPS. The utilized contains thermocouple reader signals (Field that measures the temperatures in the stipulated time). It is made of a wooden box coated with another styrofoam box, and the data collecting is done through an adapted methodology focusing on . The test enable identification of beginning and ending time in an accurate and consistent manner compared to NBR 65 norm. The Figure 5 and 6 represent the equipment and material used for
in bending traction and
The determination of the resistance to the tension in bending traction and compression were determined according to ABNT NBR 13279:2005, discovering the resistance endured by the
The equipment utilized for the tension test and compression test are of MTS, model Sintech 5/G,
number 166970/111596, pat number 14/2838, with maximum capacity of the 30kN, nominal range of 3000 Kgf, with certified calibration DNTT 941 with 17, calibration date bac August 9th 2016. The load cell is of MTS, number 85555 with capacity of 30 kN. The resistance to the bending traction was realized in equipment Sintech 5/G, which is able to apply evenly balanced load and maximum of 30 kN, seen in the Figure 7. Five specimen were used and the tests were realized in days seven and 28, an seen in Figure 8, with resistance result of bending traction through this equation:
Where:
Rt is the resistance to the tension on traction, in Mpa (megapascal); Ft is the load
[image:4.595.332.531.580.774.2]center, in N (newtons) and L is the distance between supports, in mm. The resistance to the compression was realized in equipment Sintech 5/G, which is able to apply evenly balanced load and maximum of 30 kN, as seen in the
Fig. 7. Equipment Sintech 5
Fig. 8. Test of resistance to the bending traction with equipment Sintech 5/G with specimens at 7th day
. Study and application of mortar with residues of Expanded Polystyrene
he tension test and compression test are of MTS, model Sintech 5/G, electro mechanics, number 166970/111596, pat number 14/2838, with maximum capacity of the 30kN, nominal range of 3000 Kgf, with certified calibration DNTT 941 with 17, calibration date back August 9th 2016. The load cell is of MTS, number 85555 with The resistance to the bending traction was realized in equipment Sintech 5/G, which is able to apply evenly balanced load and maximum of 30 kN, seen in the specimen were used and the tests were realized in days seven and 28, an seen in Figure 8, with resistance result of bending traction through this equation:
Rt is the resistance to the tension on traction, in Mpa (megapascal); Ft is the load vertically applied in the prism and L is the distance between supports, The resistance to the compression was realized in equipment Sintech 5/G, which is able to apply evenly balanced load and maximum of 30 kN, as seen in the Figure 9.
Equipment Sintech 5/G for traction resistance test
Fig. 8. Test of resistance to the bending traction with equipment h 5/G with specimens at 7th day
Fig. 9. Equipment Sintech 5/G for realization compression resistance test
Fig. 10. Resistance to the tension in the compression test, with equipment Sintech 5/G with specimen of seven days
Five specimens were used, but each specimen was divided in two, obtaining 10 results. The tests were realized on the seventh and 28th days, shown in Figure 10, getting the results to the compression resistance through this equation:
Where:
Rc is the compression resistance, in MPa (megapascal); Fc is the maximum load applied, in N (newton) and 1 600 is section area considered square in the loading device 40mm x 40mm, in square millimeters.
21101 International Journal of Development Research, Vol. 08, Issue, 06, pp.
ion compression
Fig. 10. Resistance to the tension in the compression test, with 5/G with specimen of seven days
Five specimens were used, but each specimen was divided in The tests were realized on the shown in Figure 10, getting the results to the compression resistance through this equation:
Rc is the compression resistance, in MPa (megapascal); Fc is the maximum load applied, in N (newton) and 1 600 is section square in the loading device 40mm x 40mm,
RESULTS AND DISCUSSION
The calorimetry test obtained the temperatures of the mortar compound in the period of 24 hours. The graphic 1 shows the horizontal the time divided in every 50 minutes, and the vertical is the temperature divided in every 5C. The values of reference mark and displacement resulted the same maximum and minimum temperatures, showing the maximum end temperature of 39,1 Celsius, reaching firstly by the displacement mark of 40% after seven hours, the displacement mark of 20% after seven hours 20 minutes and the reference mark after seven hours 40 minutes.
[image:5.595.309.546.267.409.2]reference mark and the 20% of substitution resu approximate values, while substitution mark of 40%, after reaching maximum value resulted in a faster temperature drop, having end setting time faster than the other marks. The results are shown in Graphic on Figure 11
Fig. 11. Result of calo
Fig. 12. Compression results of each ma seventh and 28th days
The resistance to the compression test on the seventh day, done with an arithmetic average of the specimen, resulted 27,46 MPa in the reference marks, with 20% result
MPa for the displacement marks and with 40%, resulted 18,07 MPa for the displacement marks. The resistance to the compression test at 28th day, also done with an arithmetic average of the specimen, resulted 33,56 MPa for the reference marks, with 20% resulted 24,96 MPa for the displacement marks and with 40% resulted 18,51 MPa for the displacement marks. Graphic on Figure 12 shows the tests of compression results on the seventh and 28th days.
tests of compression results on th each specimen evaluated:
International Journal of Development Research, Vol. 08, Issue, 06, pp.21097-21102, June, 2018
RESULTS AND DISCUSSION
The calorimetry test obtained the temperatures of the mortar compound in the period of 24 hours. The graphic 1 shows on the horizontal the time divided in every 50 minutes, and the vertical is the temperature divided in every 5C. The values of reference mark and displacement resulted the same maximum and minimum temperatures, showing the maximum end Celsius, reaching firstly by the displacement mark of 40% after seven hours, the displacement mark of 20% after seven hours 20 minutes and the reference mark after seven hours 40 minutes. During all test, the reference mark and the 20% of substitution resulted in approximate values, while substitution mark of 40%, after reaching maximum value resulted in a faster temperature drop, having end setting time faster than the other marks. The results are shown in Graphic on Figure 11.
Result of calorimetry test
Compression results of each mark on the seventh and 28th days
The resistance to the compression test on the seventh day, done with an arithmetic average of the specimen, resulted 27,46 MPa in the reference marks, with 20% resulted 22,38 MPa for the displacement marks and with 40%, resulted 18,07 MPa for the displacement marks. The resistance to the compression test at 28th day, also done with an arithmetic average of the specimen, resulted 33,56 MPa for the reference 20% resulted 24,96 MPa for the displacement marks and with 40% resulted 18,51 MPa for the displacement marks. Graphic on Figure 12 shows the tests of compression results on the seventh and 28th days. In Table 2. shows the tests of compression results on the seventh and 28th days, of
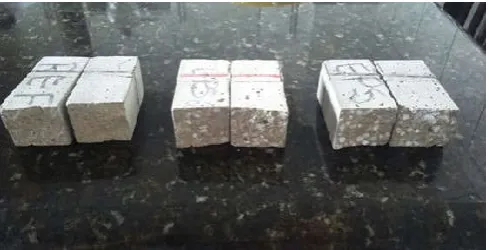
[image:5.595.69.257.360.597.2] [image:5.595.316.550.433.604.2]Fig. 13. Specimen broken after compression test at day seventh. From left to right: reference marks, displacement marks with
[image:6.595.36.287.233.387.2]20% and displacement marks 40%, respectively
Fig. 14. Tension results of each mark on the seventh and 28th days
Result (click ”Generate” to refresh) Copy to clipboard The marks used, without using additives, presented a satisfactory resistance to the compression. Figure 13 shows the specimen after the compression test, of each mark, on the seventh day. It is noticeable the EPS was blended, without segregation. In the Table III the results of tension tests of each specimen evaluated on the seventh and 28th days are shown. The marks useds, without the use of additives, presented a satisfactory resistance to the tension. An arithmetic average of the specimen was taken with the test of resistance to the tension on the seventh day. The results were, for the reference marks - 8,41 MPa, for the displacement marks with 20% - 6,92 MPa and for the displacement marks with 40% - 6,27 MPa. An arithmetic average of the specimen was also taken on 28th day, resulting the reference marks 8,99 MPa, displacement marks with 20% - 7,38 MPa and displacement marks with 40% - 6,91 MPa. Graphic on Figure 14, the results of tension tests of each mark are presented on the seventh and 28th days.
Conclusion
This paper has tested the substitution of sand with EPS in mortar production. The focus was to make use of an industrial resultant, which normally would be discarded into the environment, instead of a natural aggregate.
Even though the use of the mortar with EPS is limited, for instance, it is a non structural mortar, the results were satisfactory compared to the standard brazilian norms. The resistance of the compression on the seventh day, with displacement marks of 20%, the results were satisfactory and bigger than 20 Mpa, and for displacement mark of 40% from the 28th day. The calorimetry test showed that, the bigger the EPS in the mix, the faster the temperature increases and drops, varying the ending setting time. The tests results showed that the 20% displacement mark is the one which stands out resulting in values close to the ones in the reference mortar. It proves it is possible to substitute it without great loss at the final product, enabling the production of this mortar.
REFERENCES
Abrapex, “Associao Brasileira de Poliestireno Expandido,” http://www. abrapex.com.br/01OqueeEPS.html, 2017, [Online; accesse/*d November2017].
Brs, A. M. Leal, and Faria, P. 2013. “Cement-cork mortars for thermal bridges correction. comparison with cement-eps mortars performance,” Construction and Building Materials, vol. 49, pp. 315 – 327, 2013. [Online]. Available: http://www. sciencedirect.com/ science/ article/ pii/S0950061813007368
Fontoura, F. F. S. P. L. B. F. R. C. T. F. and Oliveira, A. C. R. 2017. “Estudo da viabilidade da utilizao de resduos de poliestireno expandido (isopor) em argamassas,” Revista EA.
Moraes, P. C., Brasil, C. B, 2015. “Estudo da viabilidade do poliestireno expandido (eps) na produo de edificaes com baixo impacto ambiental,” Imed.
NBR 13276: Argamassa para assentamento e revestimento de paredes e tetos - Preparo da mistura e determinao do ndice de consistłncia, Rio de Janeiro, Brazil, 2016. NBR NM 13279: Argamassa para assentamento e
revestimento de paredes e tetos - Determinao da resistłncia trao na flexo e compresso, Rio de Janeiro, Brazil, 2005.
NBR NM 248 Agregados - Determinao da composio granulomtrica, Rio de Janeiro, Brazil, 2003.
NBR NM 30: Agregado mido - Determinao da absoro de gua, Rio de Janeiro, Brazil, 2001.
NBR NM 45: Agregados - Determinao da massa unitria e volume de vazios, Rio de Janeiro, Brazil, 2006.
NBR NM 52: Agregado mido - Determinao da massa especfica e massa especfica aparente, Rio de Janeiro, Brazil, 2009.
NBR NM 7215 Cimento Portland - Determinao da resistłncia compresso, Rio de Janeiro, Brazil, 2009. Strecker, K. S. C. A. P. T. H. 2014. “Fabricao e
caracterizao de compsitos a base de cimento com incorporao de poliestireno expandido (isopor),” Scielo.