8132
EXTRACTING THE FACTORS INFLUENCING THE USE OF
COMMUNITY-BASED TRAVELER INFORMATION
SYSTEMS BY ANALYSING COMMUTING CRITICAL
INCIDENTS
ABDALLAH NAMOUN
Faculty of Computer and Information Systems, Islamic University of Madinah, Madinah, Saudi Arabia E-mail: [email protected]
ABSTRACT
Community-based traveler information systems have become prevalent in our daily life to help people commute from one location to another. Despite the perceived benefits of these systems, such as sustainability and green transportation, the literature still lacks studies about how such systems are used and their impact on promoting sustainable travel decisions and behaviors. This research investigates the current use of two popular traveler information systems, namely Waze (a crowdsourcing navigation app) and BlaBlaCar (a car-pooling website and app). More precisely, this paper identifies commuters’ use of such systems, the real challenges that hinder the adoption of such systems, and the factors leading to the successful adoption of traveler information systems. To this end, we conducted an exploratory study that involved collecting and analyzing 257 real commuting critical incidents through several online channels. The inductive thematic analysis of these commuting stories resulted in four major influential categories, namely instrumental, social, technological, and environmental factors. These factors are further divided and considered critical to the design of effective community-based traveler information systems.
Keywords: Community based Traveler Information System, Critical Incident, Challenges, Enabling Factors, Design Recommendations
1. INTRODUCTION
The numbers of vehicles in use is on the rise [13]. Indeed, statistics have counted over 1.2 billion cars on the worlds’ roads and this number is anticipated to double by the year 2050 [12]. The ownership of cars is also anticipated to triple by the year 2050 [25]. The abundance of cars is one of the major reasons for increased traffic congestions, travel delays, and high levels of carbon dioxide emissions that adversely impact the environment and frustrate regular travelers.
In an attempt to minimize this problem, various traveler information systems such as traffic navigation apps and car-pooling services, have emerged. These systems employ social features to promote environmentally sustainable travel habits. We refer to them as community-based traveler information systems for they rely on the social aspects of commuters to promote sustainable behavior. Specific examples include Waze and BlaBlaCar. Waze is a mobile navigation application that exploits crowdsourcing data about traffic in
order to provide optimal routes and alerts to the subscribers [14], [28]. BlaBlaCar, however, provides a website and a mobile app that enable car owners to share rides with other commuters traveling the same direction [11]. Although there is consensus that such applications enable efficient resource sharing, and combat traffic jams [15], understanding how these apps promote sustainable travel habits is still far from clear.
Numerous studies in the literature emphasize the need for and benefits of technology acceptance models in contemporary fields, such as mobile commerce [36] and online banking [37]. In simple terms, technology acceptance models in general are theories that investigate the attributes or factors that lead to either the successful use and adoption of a particular technology or rejection of this technology by the users [38]. Ultimately, they have the power to predict future use [38].
8133 information). The need for this research is motivated by several reasons. First, there are no dedicated technology models that theorize about the enabling and inhibiting factors for accepting and using community-based navigation information systems. Indeed, research work in this area is still in its infancy and necessitates more attention. To achieve such endeavor, this study carries out a deep qualitative investigation of the factors affecting acceptance, intention to use and adoption of these information systems in order to inculcate effective use. Second, research has provided evidence that users resist the use of new technologies, e.g. in organizational contexts, and such inhibitors should be identified and rectified [39]. Third, such understanding will provide insights to policy makers and leaders of navigation systems companies.
In summary, the current research provides the following major contributions:
1) A deep understanding of the factors that stimulate and promote the use of community-based traveler information systems; this understanding is supported by evidence in the form of real user stories;
2) The challenges that inhibit the repeated use of community-based traveller information systems; both 1) and 2) will form the basis for a future acceptance model;
3) A set of requirements and design recommendations for the development of successful community-based traveller information systems.
This remainder of this paper is organized into four sections. Section two reviews the studies in the field of sustainable transportation and intelligent transportation systems. Section three describes the research method adopted in this study along with the systems explored. Section four details the factors deemed to influence and steer commuters’ habits when using community-based traveler information systems. Section five concludes the potential implications and requirements for the design of traveler information systems.
2. RELATED STUDIES
The transport sector is a major source of the world’s air pollution [1], [4], [21]. Moreover, it imposes other adverse side effects such as travel delays, vehicles’ noise, and traffic jams, amongst others [27]. Evidence from the literature has shown
that car dependence in the developed countries is not projected to decrease in the future [2]. The continuous increase in the number of passengers’ vehicles has indeed worsened the conditions of urban traffic [1]. For instance, transport in the UK has contributed approximately 26% of the total greenhouse gas emissions, with car travel representing the most contributing source to these emissions [10]. Similarly, the transport sector in the USA accounts for nearly 31% of the total greenhouse gas emissions [19]. These alarming figures motivate the need for more sustainable information systems interventions that would help control this overarching car travel reliance problem. Various countries worldwide, including Denmark and Japan and the UK, established and implemented transport policy measures to reduce car use and increase dependence on public transportation [17]. The measures ranged from altering road structures to manage traffic more efficiently to introducing incentive programs for those who choose to use sustainable modes of travel and scrap old cars. Despite these massive efforts, reducing car dependence remains a complex endeavor and the achievements are still below the expectations [1]. However, Grant-Muller and Usher [20] argued that employing technology-inspired solutions could be more tolerable politically and socially in changing commuting behavior and reducing carbon-dioxide emissions.
Technological advancements gave rise to two important notions, intelligent transport systems and traveler information systems. Intelligent transport systems employ information and communication technologies to help in controlling and managing transport networks more safely and efficiently [5]. Practical benefits of intelligent transport systems include but are not limited to the provision of travel advice about journey times, less-congested routes, and warning about incidents and accidents. Traveler information systems assist commuters to move from one place to another by acquiring, processing and displaying real time travel information [16]. Today, various businesses offer community-based traveler information systems such as Waze and BlaBlaCar as detailed in the next section.
8134 research about the successful adoption and factors contributing to the actual uptake of these technologies by commuters is still timid and inconclusive. The current study aims to bridge this very research gap.
3. RESEARCH METHOD
Exploratory research [3] was conducted to investigate commuter’s actual adoption of community-based traveler information systems, as well as the social aspects and challenges pertaining to using these systems. In essence, the critical incident technique was used to gather qualitative data, whilst the thematic analysis was used to induce evidence about the factors driving the use of community-based traveler information systems.
3.1 Critical Incident Technique
The critical incident technique refers to the collection of significant stories about human behavior about a particular phenomenon to gain insights and develop a theoretical model [7]. Normally, participants are requested to narrate stories about previous experiences they had with a particular system. Advantageously, this technique does not constrain the participants to think within a particular framework and allows identifying critical factors that may be overlooked by other methods such as the questionnaires. In this study, the critical incidents (i.e. commuting stories) gave us rich insights about the real experiences of commuters, be it positive or negative, using Waze and BlaBlaCar mobile applications. These commuting stories were collected from actual users of Waze and BlaBlaCar through various online sources, namely forums (e.g. Waze community, Overclockers, Google Playstore), social media sites (e.g. Facebook, Youtube), and blogs (e.g. BlaBlaCar, Which? conversation).
3.2 Data Analysis Technique
The collected commuting stories were analysed using the thematic analysis technique and this enabled the identification of cognitive and behavioural factors that govern the actual use of community-based traveller information systems. Thematic analysis is mainly used as an inductive data analysis technique for extracting common patterns or themes within the data [8]. This inductive technique enriches our understanding of commuters’ views and attitudes [18]. To this end, the stories were inserted into Microsoft Excel and read several times to get familiar with the commuting stories. Next, the researcher coded
interesting parts of the commuting stories systematically. The similar codes were then grouped into potential high-level themes, which were later reviewed to ensure the coded scripts really belong to these themes. Finally, the themes were given appropriate names and linked to the adoption of community-based traveller information systems. Moreover, each story was classified into a positive or negative critical incident to establish cause-and-effect relationships whenever possible.
3.3 Traveler Information Systems Examined
[image:3.612.326.508.294.696.2]As indicated previously, two differing community-based traveller information systems were chosen for exploration, i.e. Waze and BlaBlaCar, due to their increased popularity and success as follows.
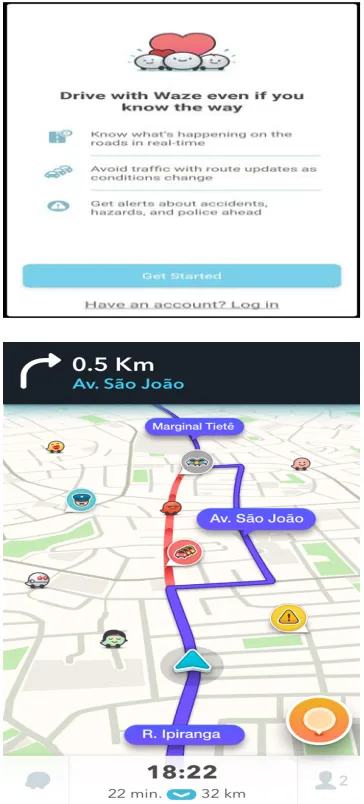
8135 Waze [9], founded in 2006, is a social navigation app that enables commuters to contribute and share live traffic updates in the form of traffic jams, incidents, accidents, police speed traps, …etc (Figure 1). Until today, Waze has gained tremendous popularity with more than 100 million registered commuters. It relies on the concept of crowdsourcing of personalised, real time traffic information so that commuters may adjust their driving habits and decisions accordingly [21], [22]. Furthermore, Waze capitalises on various social features such as the ability to see friends driving the same direction and their estimated arrival time, sharing of a live map of route and live alerts about hazards [24]… etc.
Figure 2. BlaBlaCar Website (Top) and Mobile Application (Below).
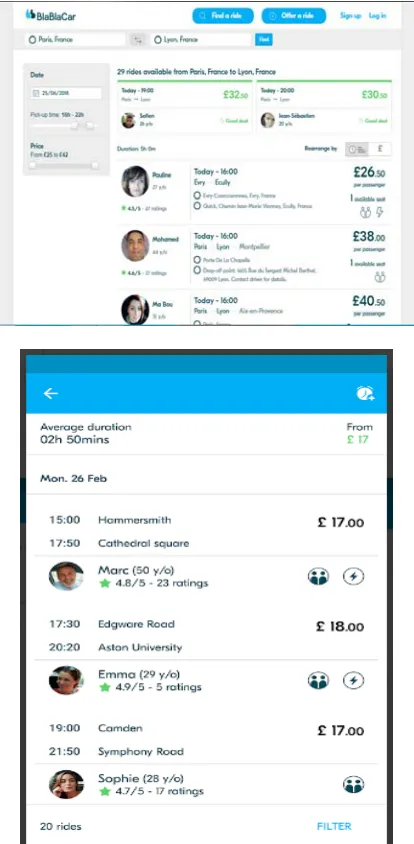
BlaBlaCar [11], founded in 2006, is an expanding carpooling company offering ride-sharing services in 21 countries, with approximately 35 million registered commuters (Figure 2). Their idea is quite simple; people can search for a ride with car owners who wish to share empty seats. In that way, BlaBlaCar services connect commuters with car owners travelling to the same destination so that they can share the travel cost and commuting experience. BlaBlaCar aims at creating a community by helping to establish relations between commuters that have never met before. This strengthens the social bond between travelers and makes travelling more sociable. Moreover, BlaBlaCar platforms encourage travelers to share experiences of their rides and commuting in order to make travel efficient and social for its users.
4. RESULTS AND DISCUSSION
[image:4.612.315.522.475.556.2]Overall, 257 critical commuting incidents were collected from multiple online channels (e.g. forums, social media sites, and blogs). These incidents which represented real commuting experiences from Waze and BlaBlaCar users were classified into either positive or negative incidents. In detail, there were a total of 141 Waze stories (i.e. 70 positive and 71 negative) and 116 BlaBlaCar stories (66 positive and 50 negative), as depicted in Table 1.
Table 1. Real Commuting Critical Incidents Collected from Waze and BlaBlaCar Users.
System Positive Travel Incidents
Negative Travel Incidents
Total
Waze 70 71 141
BlaBlaCar 66 50 116
Next, the classification of the key enablers, as well as any inhibiting factors, that influence the successful adoption of community-based traveller information systems by commuters are summarized and discussed for both applications Waze and BlaBlaCar.
4.1 The Navigation System Waze
4.1.1 Positive critical incidents
8136 Social factors; (2) Instrumental factors; and (3) Technological factors. The total number of occurrences for these positive themes was 137.
Social factors: the social factors refer to the experiences from the community that influence or motivate commuters’ decisions to use the navigation system. The key motivators that emerged under the social factors were community driveness (11.7%), fun (4.4%) and safety (1.2%). The most positive aspect of using Waze is its ability to encourage a community of users to actively participate in sharing traffic and travel information. This in turn makes crowdsourcing of traffic information a fun and interesting activity (see Table 2).
Table 2. Positive Social Factors Influencing the Use of Waze Along with Frequency and Evidence from
Commuters.
Sub-theme
(Frequency) Evidence
Community driveness
(11.7%)
Commuter 12: “Great things happen when a community comes together to work together. My trip to anywhere has been improved since I know about road hazards and get traffic jam reports so soon. We need more apps like this where the people can help each other. Waze is my favorite app right now.” (Source, Google Play Store) Commuter 11: “So many people are actively contributing! I'm impressed with the number of users I see on the map near me. Especially on interstates the updates about traffic and road hazards are very timely. If you're using this app, use the report feature and make it even better!” (Source, Google Play Store)
Fun (4.4%)
Commuter 14: “Gamify Your Drive Rack up points while not getting lost! Fun app that shows you crowd sourced traffic reports on your route and in your immediate area….” (Source, Google Play Store)
Commuter 13: “… I use it daily to avoid traffic jam. It's more fun to use this as it always helps me to find the best route.” (Source, Google Play Store)
Instrumental factors: the instrumental factors refer to the gains or advantages obtained from using the traveler system. The key benefits that emerged
[image:5.612.311.522.160.396.2]in the instrumental factors were saving time (8%) and saving money (2.2%) (see Table 3).
Table 3. Positive Instrumental Factors Influencing the Use of Waze Along with Frequency and Evidence from
Commuters.
Sub-theme (Frequency)
Evidence
Saving time (8%)
Commuter 2: “Waze saved me this morning. I left 30 minutes later than normal. Waze routed me a way I've never been and arrived with a few minutes to spare! Thanks!” (Source, Facebook) Commuter 3: “Love getting to work before everyone else and telling them that my Waze told me so!” (Source, Facebook)
Saving money (2.2%)
Commuter 15: “Definitely better than google navigation Google map had me drive to a lot of difficult places. After Google got me to drive for 8 hours for a usual 4 to 5-hour drive, it will be hard for me to trust google navigation application. Waze is surely helping me save a lot of gas monies.” (Source, Google Play Store)
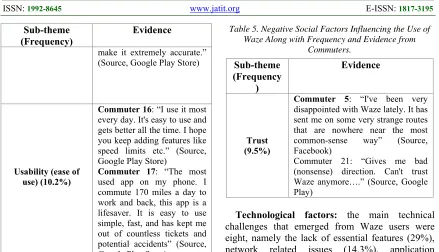
[image:5.612.311.523.544.735.2]Technological factors: the technological factors refer to the technical features of a system that facilitate and encourage actual use of a system. The key motivators that emerged in the technological factors were the provision of real-time travel information (35%), ease of use (10.2%), and the reliability of recommendations (2.2%) (see Table 4).
Table 4. Positive Technological Factors Influencing the Use of Waze Along with Frequency and Evidence from
Commuters.
Sub-theme
(Frequency) Evidence
Provision of real time travel information
(35%)
Commuter 4: “The real-time updates for everything, including road hazards, make this my new favorite GPS app. I like how it warns me that I should be slowing down for something in the road ahead.” (Source, Facebook)
8137
Sub-theme (Frequency)
Evidence
make it extremely accurate.” (Source, Google Play Store)
Usability (ease of use) (10.2%)
Commuter 16: “I use it most every day. It's easy to use and gets better all the time. I hope you keep adding features like speed limits etc.” (Source, Google Play Store)
Commuter 17: “The most used app on my phone. I commute 170 miles a day to work and back, this app is a lifesaver. It is easy to use simple, fast, and has kept me out of countless tickets and potential accidents” (Source, Google Play Store)
Other dispersed factors: the remaining commuting stories gave rise to a mixture of other motivators (22.6% of the overall themes) such as usefulness and competitiveness. For example, commuter 19 reported: “Best navigation & Real-time app, it’s more helpful than Google Navigation & has the added features of warning when a camera is near, or an accident or road block. Something every traveller needs!” (Source, Google Play Store). Commuter 20 reported: “Extremely helpful I really like this app. The fact that the users can notify other users about road conditions and problems in real time is amazing. The social aspects of the app make it extremely accurate.” (Source, Google Play Store).
4.1.2 Negative critical incidents
In total, 71 negative commuting stories were acquired from Waze users’ (40 males, 28 females and 3 anonymous). The thematic analysis revealed two main themes, mainly (1) Social factors; and (2) Technological factors. The total number of occurrences for these negative themes was 84.
[image:6.612.88.527.70.322.2]Social factors: the main hindrance to the adoption of Waze that emerged in the social factors was lack of trust (9.5%). Some users expressed worry about the reliability of the commuting guidance provided by Waze and this directly influenced their intention for future use (see Table 5).
Table 5. Negative Social Factors Influencing the Use of Waze Along with Frequency and Evidence from
Commuters.
Sub-theme (Frequency
)
Evidence
Trust (9.5%)
Commuter 5: “I've been very disappointed with Waze lately. It has sent me on some very strange routes that are nowhere near the most common-sense way” (Source, Facebook)
Commuter 21: “Gives me bad (nonsense) direction. Can't trust Waze anymore….” (Source, Google Play)
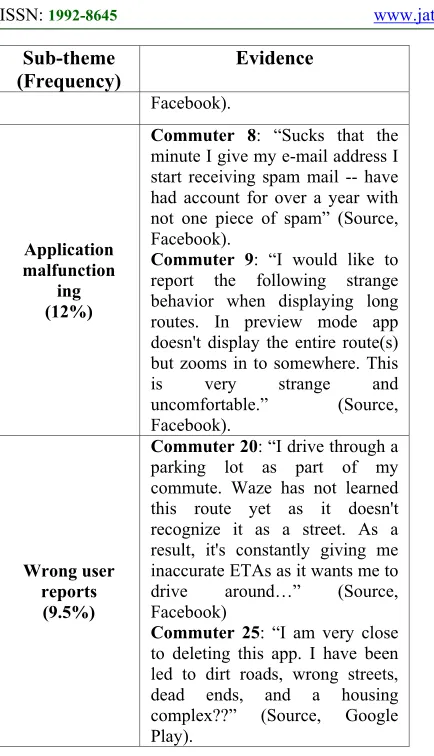
Technological factors: the main technical challenges that emerged from Waze users were eight, namely the lack of essential features (29%), network related issues (14.3%), application malfunctioning (12%), wrong user reports and estimations (9.5%), voice clarity issues (9.5%), application failure (6%), cluttered screen (4.8%) and login issues (2.4%) (see Table 6).
Table 6. Negative Technological Factors Influencing the Use of Waze Along with Frequency and Evidence from
Commuters.
Sub-theme
(Frequency) Evidence
Lack of features
(29%)
Commuter 23: “Waze needs a button to post current speed to help show when slowdowns are cleared.” (Source, Google Play). Commuter 24: “…Can you incorporate an option for flooded road? This could have come in handy just the other day when it down poured here and there was excessive water on the road. Rain is one hazard to post about but flooded road would really be helpful.” (Source, Google Play).
Network related
issues (14.3%)
Commuter 6: “I stop using this app after I kept getting no satellite signal. But yet my 3G internet was on and it kept getting me lost going to my in-law’s house. Or even using it in the city it would get me lost for stop working.” (Source, Facebook).
[image:6.612.313.518.409.734.2]8138
Sub-theme (Frequency)
Evidence
Facebook).
Application malfunction
ing (12%)
Commuter 8: “Sucks that the minute I give my e-mail address I start receiving spam mail -- have had account for over a year with not one piece of spam” (Source, Facebook).
Commuter 9: “I would like to report the following strange behavior when displaying long routes. In preview mode app doesn't display the entire route(s) but zooms in to somewhere. This is very strange and uncomfortable.” (Source, Facebook).
Wrong user reports (9.5%)
Commuter 20: “I drive through a parking lot as part of my commute. Waze has not learned this route yet as it doesn't recognize it as a street. As a result, it's constantly giving me inaccurate ETAs as it wants me to drive around…” (Source, Facebook)
Commuter 25: “I am very close to deleting this app. I have been led to dirt roads, wrong streets, dead ends, and a housing complex??” (Source, Google Play).
Other dispersed factors: the technical problems experienced incited some users to switch to other competitor traveler information systems. For instance, commuter 25 reported: “… now pop-up adds block my whole screen and eats my battery very fast. Back to Google Maps and use a radar detector.” (Source, Google Play).
4.2 The Carpooling System BlaBlaCar
4.2.1 Positive critical incidents
Altogether, 66 positive commuting stories were reported by BlaBlaCar users (38 males, 17 females and 11 anonymous). The thematic analysis resulted in four main themes, specifically (1) Social factors; (2) Instrumental factors; (3) Environmental factors; and (4) Technological factors. The total number of occurrences for these positive themes was 181.
Social Factors: the key social motivators that were discussed by BlaBlaCar users were the ability to meet friendly commuters (17.1%), make travel companions (15.5%) and make the journey fun (9.4%). However, safety (2.8%) and trust (1.1%)
[image:7.612.91.308.71.449.2]were not identified as positive aspects of using BlaBlaCar (see Table 7).
Table 7. Positive Social Factors Influencing the Use of BlaBlaCar Along with Frequency and Evidence from
Commuters.
Sub-theme (Frequency)
Evidence
Friendliness of commuters
(17.1%)
Commuter 1: “David's a friendly guy, chatty enough but a good listener (important with me as a passenger!). It was easy to plan the trip with him, he's a great driver, and my first Blablabar experience was a good one.” (Source, BlaBlaCar).
Commuter 2: “It was great to travel with Matt. He kept me well informed about his eta, was friendly, flexible and has good taste in music. All you can really ask from a journey really.” (Source, BlaBlaCar)
Travel companion
(15.5%)
Commuter 3: “I used BlaBlaCar for the first time to travel back home after a holiday in Paris with my husband and our friends. We met the most fantastic group of people in the car. We absolutely loved this experience.” (Source, BlaBlaCar).
Commuter 4: “Jagath is friendly and easy going, which made the trip enjoyable. He was willing to pick us up and drop us off exactly where we needed to be, alongside offering us advice about a city we did not know.” (Source, BlaBlaCar)
Fun (9.4%)
Commuter 1: “I regularly drive from London to Manchester to see my other half and before discovering BlaBlaCar the journey was long and dull, not to mention expensive! Now with BlaBlaCar I can make up some of my travel costs and meet some great people. I strongly recommend this cheap, safe and fun way of travelling to both drivers and passengers.” (Source, GooglePlay).
8139
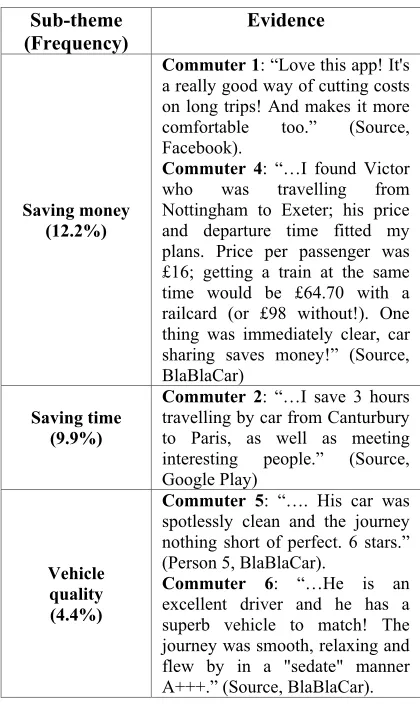
[image:8.612.307.524.75.295.2]Instrumental factors: the key benefits that emerged as instrumental factors include saving money (12.2%), saving time (9.9%) and vehicle quality of commuters (4.4%) (see Table 8).
Table 8. Positive Instrumental Factors Influencing the Use of BlaBlaCar Along with Frequency and Evidence
from Commuters.
Sub-theme
(Frequency) Evidence
Saving money (12.2%)
Commuter 1: “Love this app! It's a really good way of cutting costs on long trips! And makes it more comfortable too.” (Source, Facebook).
Commuter 4: “…I found Victor who was travelling from Nottingham to Exeter; his price and departure time fitted my plans. Price per passenger was £16; getting a train at the same time would be £64.70 with a railcard (or £98 without!). One thing was immediately clear, car sharing saves money!” (Source, BlaBlaCar)
Saving time (9.9%)
Commuter 2: “…I save 3 hours travelling by car from Canturbury to Paris, as well as meeting interesting people.” (Source, Google Play)
Vehicle quality (4.4%)
Commuter 5: “…. His car was spotlessly clean and the journey nothing short of perfect. 6 stars.” (Person 5, BlaBlaCar).
Commuter 6: “…He is an excellent driver and he has a superb vehicle to match! The journey was smooth, relaxing and flew by in a "sedate" manner A+++.” (Source, BlaBlaCar).
Environmental factors: the environmental factors refer to the environmental causes and aspects that impact commuters’ intention to use a system. Environment friendliness emerged as a theme in this category (2.8%) (see Table 9).
Table 9. Positive Environmental Factors Influencing the Use of BlaBlaCar Along with Frequency and Evidence
from Commuters.
Sub-theme
(Frequency) Evidence
Sub-theme (Frequency)
Evidence
Environment friendliness
(2.8%)
Commuter 7: “…it's just a cheaper, easier and more comfortable alternative to other transport! Meanwhile, fewer cars equals less congestion, pollution and oil dependency, and fewer car parks in our safer, more sociable communities.” (Source, BlaBlaCar).
Commuter 1: “…Everyone saves money, there's less pollution with multiple cars doing the same journey been avoid, and personally, I think it’s a nice community / social gesture as well.” (Source, Overclockers).
[image:8.612.89.299.183.535.2]Technological factors: the key technological motivators included the quality and reliability of app services (11.6%), convenience offered by the app (6.6%), and ease of use of the system (3.9%) (see Table 10).
Table 10. Positive Technological Factors Influencing the Use of BlaBlaCar Along with Frequency and Evidence
from Commuters.
Sub-theme
(Frequency) Evidence
Reliability of app services (11.6%)
Commuter 6: “Really great company, lovely car, safe driver and a reliable guy! Thanks Kevin, look forward to the trip back on Sunday!” (Source, Google Play). Commuter 3: “…I started traveling with BlaBlaCar around 10 months ago and I absolutely love everything about it! It's simple and efficient. The app is very fast and user friendly. I strongly recommend for people traveling a lot between cities.”(Source, Google Play).
Convenience (6.6%)
Commuter 1: “BlaBlaCar is winning the market in all Europe. It is a great way to travel fast, cheap and in a comfortable way…” (Source, All Things).
Ease of use (3.9%)
[image:8.612.87.525.364.731.2]8140
Other dispersed factors: other factors for using BlaBlaCar included convenience (6.6%) derived from using the app as well as legal rights (2.8%).
4.2.2 Negative critical incidents
Overall, 50 negative commuting stories were acquired from BlaBlaCar users (28 males, 20 females and 2 anonymous). Three main hinderances emerged, mainly (1) Social factors; (2) Technological factors; and (3) Legal factors. The total number of occurrence for all negative themes was 69.
Social factors: socially, commuters raised concerns about two major issues, trusting t Socially, commuters raised concerns about two major issues, trusting the system and/or other commuters (24.6%) and their personal safety (18.8%).he system and/or other commuters (24.6%) and their personal safety (18.8%) (see Table 11).
Table 11. Negative Social Factors Influencing the Use of BlaBlaCar Along with Frequency and Evidence from
Commuters.
Sub-theme
(Frequency) Evidence
Trust (24.6%)
Commuter 6: “Dreadful idea that will be used for all underground illegal activity and crime. As a Mother, would I let my son or daughter use this website for travel meeting some random person? hell no! I wouldn't.” (Source, Google Play).
Commuter 6: “Colleagues, friends or neighbors – maybe, if it suits. Complete strangers? No way – a long journey could be a nightmare. If you did do it I think you’d need some rules – payment in advance.” (Source, Google Play).
Safety (18.8%)
Commuter 2: “Good idea but the safety factor worries me, I'm a girl who travels alone to places and the thought of having a stranger in the car with me is a bit unnerving.” (Source, Overclockers).
Commuter 8: “… but not sure how safe it is as a single driver to invite in your car 1,2 or more complete strangers which u know nothing about...could be car jackers, thieves, serial killers, etc. Think about it...I did, it gets quite scary...would u risk it for a couple of pounds?” (Source, Google Play).
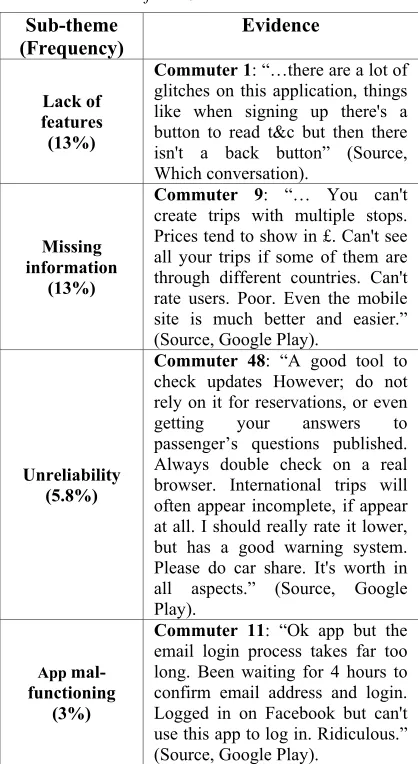
[image:9.612.313.522.192.574.2]Technological factors: the technical issues encountered using BlaBlaCar included the lack of features on the app (13%), missing information (13%), unreliability of service (5.8%) and malfunctioning of the app (3%) (see Table 12).
Table 12. Negative Technological Factors Influencing the Use of BlaBlaCar Along with Frequency and Evidence
from Commuters.
Sub-theme
(Frequency) Evidence
Lack of features (13%)
Commuter 1: “…there are a lot of glitches on this application, things like when signing up there's a button to read t&c but then there isn't a back button” (Source, Which conversation).
Missing information
(13%)
Commuter 9: “… You can't create trips with multiple stops. Prices tend to show in £. Can't see all your trips if some of them are through different countries. Can't rate users. Poor. Even the mobile site is much better and easier.” (Source, Google Play).
Unreliability (5.8%)
Commuter 48: “A good tool to check updates However; do not rely on it for reservations, or even getting your answers to passenger’s questions published. Always double check on a real browser. International trips will often appear incomplete, if appear at all. I should really rate it lower, but has a good warning system. Please do car share. It's worth in all aspects.” (Source, Google Play).
App mal-functioning
(3%)
Commuter 11: “Ok app but the email login process takes far too long. Been waiting for 4 hours to confirm email address and login. Logged in on Facebook but can't use this app to log in. Ridiculous.” (Source, Google Play).
Legal factors: the legal factors refer to the policies and rules surrounding the use of a system within a particular country. 13% of the themes focused on the legal barriers to operate BlaBlaCar within some countries (see Table 13).
Table 13. Negative Legal Factors Influencing the Use of BlaBlaCar Along with Frequency and Evidence from
Commuters
Sub-theme
8141
Sub-theme (Frequency)
Evidence
Legal (13%)
Commuter 4: “This is illegal. There is a difference between sharing the cost if a trip and posting a fare/charge/tariff/price for a journey - you are basically soliciting yourself as a taxi service. It's a free country, but good luck if you are involved in a accident - they will throw the book at you.” (Source, Google Play).
Commuter 41: “Am sure this is not legal due to the drivers not being licensed and insured for passengers are the drivers crb checked? Do you no whose car you’re getting in just don’t think it’s safe who is protecting the driver and passenger it’s a disaster waiting to happen.” (Source, Google Play).
5. DESIGN IMPLICATIONS FOR THE CREATION OF COMMUNITY-BASED TRAVELER INFORMATION SYSTEMS
The design recommendations for developers based on our findings are multi-fold as follows.
Design recommendation one: the traveler information system should include features that encourage the social aspects in human life such as sharing of the traffic updates and strengthening the social ties with other follow commuters. In particular, the system may exploit the existence of social media networks to gain leverage. Various technology adoption models have already confirmed that human intention to use a particular technology is somewhat influenced by families and friends [31].
Design recommendation two: the traveler information system should clearly display the tangible benefits of using the system. The two primary benefits that mattered to commuters are the financial gains (i.e. amount of money saved) and reduction in commuting time (i.e. amount of time saved). Overall, performance expectancy is confirmed to contribute to the repeated use of mobile technologies [32]. Moreover, Sripalawat [30] confirms that perceived financial cost influences the use of mobile banking applications.
Design recommendation three: the traveler information system should provide a fun experience to the commuters to create an engaging experience.
Indeed, hedonic features affect the actual use of mobile applications [33].
Design recommendation four: the traveler information system should provide reliable and live travel and traffic information to empower commuters to make informed and accurate travel decisions. This is in agreement with the recommendation of the literature [34].
Design recommendation five: the traveler information system should use information and design elements that build commuters’ trust and therefore promise their safety. For instance, the designer may improve the aesthetics design of the traveler information systems to boost the trust levels of clients [35].
6. CONCLUSION
Technology adoption and acceptance has been regarded for many years as an interesting research topic to explore by many researchers [29]. The original Technology Acceptance Model (TAM) dates back to 1986 [38] and there have been noticeable and successful extensions of the model thereafter [38]. However, these models can explain only around 40% of the actual use and thus require further improvements [40]. Moreover, none of these models address the actual use of modern navigation information systems such as Waze. Our work initiates a first step towards this journey in a bid to create a clear understanding of the influential factors of actual use by starting from scratch instead of relying on existing models.
Previous works clearly stipulate that technology acceptance models have practical implications as they provide a better understanding and more insights for decision and policy makers about the key success factors [41]. For example, our beliefs and attitudes were reported to affect our use of the Internet [42]. The extended model in this study found that the perceived usefulness and ease of use of the Internet have a stronger influence on use than other socio-demographic factors such as level of education and income.
8142 the advantages of capturing real interactions. The stories were thematically analyzed to identify the enabling factors as well as the inhibiting factors that impede the successful adoption of such systems by commuters. These factors altogether constitute food for thought and an initial step towards creating a dedicated acceptance model for crowd sourced navigation systems. It will enable policy makers in navigation and mapping systems companies to rethink about their designs and address the identified weaknesses and concerns.
Theoretically, the actual use of technologies is directly influenced by user intention which in turn is governed by a set of internal and external factors [29]. Our study revealed that three common factors were found to positively affect commuters’ decisions to use Waze and BlaBlaCar, including the instrumental gains, the usability of the system, and the hedonic features of the traveler information system. However, the users of Waze and BlaBlaCar were quite apprehensive about the level of safety of commuting using these systems. This has directly impacted their level of trust and intention to use the systems in the future.
This research explored two famous examples of social navigation systems. However, in reality there are other competing social navigation systems in the market that were excluded from this interpretive study merely for practical reasons such as the lack of critical incidents and documented commuting experiences. Therefore, there could be other factors which may influence the actual use of social traveler systems. The directions of this research are clear. In the future, we plan to conduct an extensive survey to test the associations between the aforementioned factors and the actual use of navigation and mapping systems.
REFRENCES:
[1] Graham-Rowe Ella, Stephen Skippon, Benjamin Gardner, and Charles Abraham, "Can we reduce car use and, if so, how? A review of available evidence", Transportation Research Part A: Policy and Practice, Vol. 45, No. 5, 2011, pp. 401-418.
[2] Berri Akli, "A cross-country comparison of household, car ownership: a cohort analysis", IATSS research, Vol. 33, No. 2, 2009, pp. 21-38.
[3] Coolican Hugh, Research methods and statistics in psychology, Psychology Press, 2017.
[4] Broll Gregor, Hu Cao, Peter Ebben, Paul Holleis, Koen Jacobs, Johan Koolwaaij, Marko
Luther, and Bertrand Souville, "Tripzoom: an app to improve your mobility behavior",
in Proceedings of the 11th international
conference on mobile and ubiquitous multimedia, (ACM), 2012, p. 57.
[5] Li Linjing, Xin Li, Zhenjiang Li, Daniel Dajun Zeng, and William T. Scherer, "A bibliographic analysis of the IEEE transactions on intelligent transportation systems literature", IEEE Transactions on Intelligent Transportation Systems, Vol. 11, No. 2 ,2010, pp. 251-255. [6] Dickinson Robert E, “The Makers of Modern
Geography (RLE Social & Cultural Geography)”, Routledge, 2014.
[7] Serenko Alexander, Andrea Stach, "The impact of expectation disconfirmation on customer loyalty and recommendation behavior: Investigating online travel and tourism services", Journal of Information Technology Management, Vol. 20, No. 3, 2009, pp. 26-41. [8] Braun Virginia, Victoria Clarke, "Using
thematic analysis in psychology", Qualitative research in psychology, Vol. 3, No. 2, 2006, pp. 77-101.
[9] Waze, “Waze,” 2006. [Online]. Available: https://www.waze.com/?locale=en-GB.
Accessed: 1- May- 2018.
[10]Departmant for transport, “Transport Statistics Great Britain,” 2016. [Online]. Available: https://assets.publishing.service.gov.uk/govern ment/uploads/system/uploads/attachment_data/f ile/576113/tsgb-2016-print-ready-version.pdf. Accessed: 1- May- 2018.
[11]BlaBlaCar, “BlaBlaCar,” 2018. [Online]. Available: https://www.blablacar.co.uk/. Accessed: 1- May- 2018.
[12]Green Car Reports, “1.2 Billion Vehicles on World's Roads Now, 2 Billion By 2035: Report,” 2014. [Online]. Available: https://www.greencarreports.com/news/109356 0_1-2-billion-vehicles-on-worlds-roads-now-2-billion-by-2035-report. Accessed: 1- May- 2018.
[13]Sivak Michael, “Has Motorization in the US Peaked? Part 10: Vehicle Ownership and Distance Driven, 1984 to 2016”, (No. SWT-2018-2), 2018.
[14]Silva Thiago H., Pedro OS Vaz de Melo, Aline Carneiro Viana, Jussara M. Almeida, Juliana Salles, and Antonio AF Loureiro, "Traffic condition is more than colored lines on a map: characterization of waze alerts",
8143 Informatics, Springer(Cham), 2013, pp. 309-318.
[15]Demailly Damien, Anne-Sophie Novel, "The
sharing economy: make it
sustainable", Studies, No. 3,2014, pp. 14. [16]Wu Yao-Jan, Yinhai Wang, and Dalin Qian, "A
google-map-based arterial traffic information system", In Intelligent Transportation Systems
Conference (ITSC 2007. IEEE), (IEEE), 2007,
pp. 968-973.
[17]Eißel Dieter, Chin Peng Chu. "The future of sustainable transport system for Europe", AI & society, Vol. 29, No. 3, 2014, pp. 387-402. [18]Fishman Elliot, Simon Washington, and Narelle
Haworth, "Barriers and facilitators to public bicycle scheme use: A qualitative approach", Transportation research part F: traffic
psychology and behavior, Vol. 15, No. 6, 2012,
pp. 686-698.
[19]Mitropoulos Lambros, Panos Prevedouros, "Assessment of sustainability for transportation vehicles", Transportation Research Record: Journal of the Transportation Research Board, Vol. 2344, 2013, pp. 88-97.
[20]Grant-Muller Susan, Mark Usher, "Intelligent Transport Systems: The propensity for
environmental and economic
benefits", Technological Forecasting and Social Change, Vol. 82, 2014, pp. 149-166.
[21]Sha Wenjie, Daehan Kwak, Badri Nath, and Liviu Iftode, "Social vehicle navigation: integrating shared driving experience into vehicle navigation", In Proceedings of the 14th Workshop on Mobile Computing Systems and Applications, (ACM), 2013,p. 16.
[22]Klugman Noah, Javier Rosa, Pat Pannuto, Matthew Podolsky, William Huang, and Prabal Dutta, "Grid watch: Mapping blackouts with smart phones", In Proceedings of the 15th Workshop on Mobile Computing Systems and Applications, (ACM), 2014,p. 1.
[23]Google, “Google maps,” 2005. [Online]. Available: https://www.google.com/maps. Accessed: 1- May- 2018.
[24]Sage, “Waze updated with pick-up request and social features,” 2012. [Online]. Available: https://www.androidcentral.com/waze-updated-pick-request-and-social-features. Accessed: 1- May- 2018.
[25]Watkins Kevin, "SAFE AND SUSTAINABLE ROADS The case for a Sustainable Development Goal", 2012, pp. 1-40.
[26]Hamilton Andrew, Ben Waterson, Tom Cherrett, Andrew Robinson, and Ian Snell, "The evolution of urban traffic control: changing policy and technology", Transportation planning and technology, Vol. 36, No. 1, 2013, pp. 24-43.
[27]Macioszek, Elzbieta, Grzegorz Sierpiński, “Contemporary Challenges of Transport Systems and Traffic Engineering”, Springer International Pu, 2016.
[28]Pack Michael, Nikola Ivanov, "Are You Gonna Go My WAZE?", Institute of Transportation Engineers, (ITE Journal), Vol. 87, No. 2, 2017, pp. 28-35.
[29]Tarhini Ali, Nalin Asanka Gamagedara Arachchilage, and Muhammad Sharif Abbasi, "A critical review of theories and models of technology adoption and acceptance in information system research", International Journal of Technology Diffusion (IJTD), Vol. 6, No. 4, 2015, pp. 58-77.
[30]Sripalawat Jiraporn, Mathupayas Thongmak, and Atcharawan Ngramyarn, "M-banking in metropolitan Bangkok and a comparison with other countries", Journal of computer information systems, Vol. 51, No. 3, 2011, pp. 67-76.
[31]Venkatesh Viswanath, "Technology acceptance model and the unified theory of acceptance and use of technology", Wiley Encyclopedia of
Management, 2014.
[32]Yu Chian-Son, "Consumer switching behavior from online banking to mobile banking", International Journal of Cyber Society and Education, Vol. 7, No. 1, 2014, pp. 1.
[33]Namoun Abdallah, Athanasia Daskalopoulou, Nikolay Mehandjiev, and Zhang Xun, "Exploring mobile end user development: existing use and design factors", IEEE Transactions on Software Engineering, Vol. 42, No. 10, 2016, pp. 960-976.
[34]Kattan Lina, Khandker M. Nurul Habib, Islam Tazul, and Nadeem Shahid, "Information provision and driver compliance to advanced traveller information system application: case study on the interaction between variable message sign and other sources of traffic updates in Calgary, Canada", Canadian Journal of Civil Engineering, Vol. 38, No. 12, 2011, pp. 1335-1346.
8144
aesthetics", Computers in Human
Behavior, Vol. 26, No. 4, 2010, pp. 673-684. [36]Wu Jen-Her, Shu-Ching Wang, "What drives
mobile commerce?: An empirical evaluation of the revised technology acceptance model", Information & management, Vol. 42, No. 5, 2005, pp. 719-729.
[37]Pikkarainen Tero, Kari Pikkarainen, Heikki Karjaluoto, and Seppo Pahnila, "Consumer acceptance of online banking: an extension of the technology acceptance model", Internet research, Vol. 14, No. 3, 2004, pp. 224-235. [38]Marangunić Nikola, Andrina Granić,
"Technology acceptance model: a literature review from 1986 to 2013", Universal Access in the Information Society, Vol. 14, No. 1, 2015, pp. 81-95.
[39]Durodolu Oluwole Olumide, "Technology acceptance model as a predictor of using information system'to acquire information literacy skills", Library Philosophy and Practice, 2016.
[40]Legris Paul, John Ingham, and Pierre Collerette, "Why do people use information technology? A critical review of the technology acceptance model", Information & management, Vol. 40, No. 3, 2003, pp. 191-204.
[41]Momani Alaa M., Mamoun Jamous, "The Evolution of Technology Acceptance Theories", International Journal of Contemporary
Computer Research (IJCCR), Vol. 1, No. 1,
2017, pp. 51–58.
[42]Porter Constance Elise, Naveen Donthu, "Using the technology acceptance model to explain how attitudes determine Internet usage: The role of perceived access barriers and demographics", Journal of business research, Vol. 59, No. 9, 2006, pp. 999-1007.