CLASSIFICATION AND EFFECTIVENESS OF ENERGY POLICY MECHANISMS FOR THE PROMOTION
OF RENEWABLE ENERGY
*Paulo Henrique de Mello Santana, Luiza Passaro Bertazzoli and Roberto Carvalho Junior
Engineering, Modeling and Applied Social Sciences Center, Federal University of ABC (UFABC), Avenida dos
Estados, 5001, Bangu, Santo Andre, 09210-580, SP, Brazil
ARTICLE INFO ABSTRACT
To handle the emissions problem and to address other issues as oil security and technology innovations, many countries have focused on renewable energy policies in combination with rapidly improving energy efficiency measures.Scholars mostly classify energy mechanism in terms of technology-push and demand pull. The literature also classifies energy policy mechanisms in terms of command-and-control and market incentive, although it doesn’t combine these mechanisms into organized categories. The objective of this paper is to review, organize and classify energy policy mechanisms in 140 countries. Furthermore, it compares the results with countries that had a variation higher than 10 percentage points in the renewable energy share of the total energy consumption between 2000 and 2015. The proposed classification aggregates the four concepts of technology-push, demand-pull, command-and-control and market incentives, according to the four quadrants policy (4QP) method developed by [1]. The results found in 140 countries show that 738 open market policies were implemented in the last decades; techno-economic, market-control and technology-control were responsible for 737, 669 and 3 policies in these countries, respectively. From 2000 to 2015, Denmark, Bosnia and Herzegovina, Iceland, Sweden, Lithuania, Finland, Italy, Germany, Uruguay, Zimbabwe had a variation higher than 10 percentage points in the renewable energy share of the total energy consumption. The share of open market policies in the world was greater than in the selected countries (34,0% against 28,6%). The reverse happens in techno-economic and market-control policies, in which the share of the world was lesser than in the selected countries, with 34% vs. 36,1% and 30,9% vs. 35,3%, respectively. Furthermore, a higher GDP per capita and government effectiveness leads to a higher policy effectiveness. The results suggest that enforced policies are more effective than market-oriented policies to promote renewable energy.
Copyright © 2019, Paulo Henrique de Mello Santana et al. This is an open access article distributed under the Creative Commons Attribution License, which permits unrestricted use, distribution, and reproduction in any medium, provided the original work is properly cited.
INTRODUCTION
To handle the emissions problem and to address other issues as oil security and technology innovations, many countries have focused on renewable energy policies in combination with rapidly improving energy efficiency (EE) measures. Stimulated by innovation, increased competition and policy support in a growing number of countries, renewable energy technologies (RETs) have achieved massive technological advances and sharp cost reductions in recent years (De Mello Santana, 2017). However, progress has not been homogenous across countries and sectors. Several barriers still hinder the development and the deployment of RETs worldwide. Different types of RETs face different challenges depending on the innovation phase of the technology cycle and the policy
framework. Long payback periods and illiquid assets combined with high regulatory dependencies and corresponding uncertainties often make RE unattractive or even unsuitable for investors (De Mello Santana, 2017). While this holds for more mature technologies (such as onshore wind and photovoltaic (PV)) and conventional power plants, renewable energy sources (RES) in the early stage of technological development (as wave and tidal stream energy and second generation biofuels) still face technological uncertainty (De Mello Santana, 2017; Polzin, 2015; MacGillivray, 2015). Literature has thus analyzed the key role of energy policy mechanisms in assisting the innovation process during several development stages through a mix of instruments, reducing barriers to promote RET deployment and supportinglarge-scale generation and commercialization
ISSN: 2230-9926
International Journal of Development Research
Vol. 09, Issue, 11, pp. 31414-31424, November, 2019
Article History: Received xxxxxx, 2019 Received in revised form xxxxxxxx, 2019
Accepted xxxxxxxxx, 2019 Published online xxxxx, 2019
Available online at http://www.journalijdr.com
Article History:
Received 03rd August, 2019
Received in revised form 17th September, 2019
Accepted 06th October, 2019
Published online 30th November, 2019
Key Words:
Energy policy; Energy planning; Renewable energy.
*Corresponding author: Paulo Henrique de Mello Santana
RESEARCH ARTICLE
OPEN ACCESS
Citation: Paulo Henrique de Mello Santana, Luiza Passaro Bertazzoli and Roberto Carvalho Junior, 2019. “Classification and effectiveness of energy policy
RETs,enabling higher efficiency and lower costs. Scholars mostly classify energy mechanism in terms of technology-push and demand pull. Technology-push approach indicates the importance of science and technology in the technological development of innovation and adaptation to the changing features of industrial structure. A demand-pull approach identifies a broader set of market features, including characteristics of the end market and the economy as a whole, that affects the performance of innovations (Albrecht, 2015). The literature also classifies energy policy mechanisms in terms of command-and-control and market incentive policies, although it doesn’t combine these mechanisms into organized categories.Command-and-control is a direct regulation in which governments set a mandatory regulation that the market must follow. It refers to energy policy that relies on regulation as permission, prohibition, standard setting and enforcement measures. Although those policies typically have a high impact effect, they are usually costly because of regulatory enforcement and market opposition (Di, 20129) Market incentives are policies designed to incentivize the market to develop or provide a good or service. Changes are not mandatory, which makes these policies more easily accepted by the market, but these policies are normally less effective than a command-and-control policy portfolio (Di, 2012). Command-and-control policies contain mandates, while market incentives are voluntary. Unfortunately, the literature doesn’t combine these mechanisms into organized categories. This paper intends to do it with the existing energy policy mechanisms in the world, considering also technology-push and demand-pull classification.
The objective of this paper is to review, organize and classify energy policy mechanisms in 140 countries. Section 2 presents the methodology. In section 3, this paper carries out a literature review on the main energy policy mechanisms to promote RETs, exposing the necessity of a new approach to classify energy policy mechanisms. Section 4 classifies the energy policy mechanisms in 140 countries aggregating the existing classification of technology-push or demand-pull policies with market incentives or command-and-control, based on the 4QP method. This section also selects 10 countries that had a variation higher than 10 percentage points (pp) in the renewable energy (RE) share of the total energy consumption to conduct another review. The method used and the results of this paper may help policymakers better design and deploy energy policy mechanisms.
METHODOLOGY
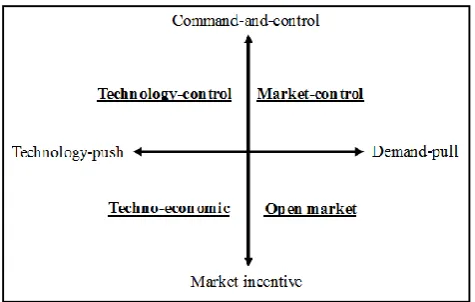
[image:2.595.315.553.52.203.2]This section presents the methodology used in this paper. Section 3 carries out a literature review on the main energy policy mechanisms to promote RETs. Section 4 classifies energy policy mechanisms aggregating the existing classification of technology-push or demand-pull policies with market incentives or command-and-control. This classification, based on the four quadrants (4QP) method developed by [6], aims to aggregate these four concepts to help policymakers better design and deploy energy policy mechanisms. Figure 1 illustrates the 4QP method. The first category is called technology-control, where policies are technology-push and command-and-control type because they have the potential to reduce private costs and are mandatory.
Figure 1. Energy policy classificationaccording to the4QP method
The second is called market-control policy, where policies are demand-pull and command-and-control type because they have the potential to increase private profits and are mandatory. The third is called open market policies, where policies are demand-pull and market-incentive type because they have the potential to increase private profits and are not mandatory. The last category is called techno-economic, and they are technology-push and market-incentive because they have the potential to reduce private costs and are not mandatory. Section 4 first organizes 2,168 policies in 140 countries found in the IEA/IRENA database. These policy and measures were classified according to the 4QP method, considering the region in which the policies were referred. The process of allocation of an instrument to a quadrant considers the following three steps: (1): Identifying the existing policy mechanisms; (2) Organizing“1” according to the existing classification: demand-pull or technology-push and command-and-control or market incentive. If an instrument is demand-pull it cannot also be technology-push, since they are mutually exclusive. The same is valid for command-and-control or market incentive classification, although it is possible for an instrument to be hybrid depending on the policy design (i.e., cap and trade system). (3) Classifying the instruments according to the 4QP method. For example, if a mechanism is demand-pull and command-and-control it is allocated (classified) into the market-control quadrant, and so on. Later in this work, the paper selected the 10 countries that had a variation higher than 10 pp in the RE share of the total energy consumption from 2000 to 2015, to discuss in depth.
Energy Policy Review
size (Cantner, 2016; IEA RETD TCP, 2017). With revenues generated in the market, firms can grow to appropriate economies of scale and learning effects that allow the development of more efficient production processes (Nemet, 2004). In a demand-pull perspective, investments in solar PV and onshore wind were largely driven by regulatory and pricing policies such as Renewable Portfolio Standards (RPS), FITs and auctions. It can be a strong signal to investors as it addresses the capital market restrictions as a price support by adjusting the risk/return structure (Nicolli, 2016 and Cantner, 2016). Literature analyses the policy effectiveness of FIT and agree with its positive effects in promoting RETs especially in the early phases of technological development (Nicolli, 2016; De Mello Santana, 2016 and Keay, 2016). FIT have been implemented in a range of countries mostly in Europe, starting with Germany and Austria (De Mello Santana, 2016; Böhringer, 2017), finds that the subsidies granted under the Electricity Feed-in Law (SEG) and Renewable Energy Source Act (EEG) triggered a massive growth in renewable electricity production in Germany. The share of RE (mainly wind and solar PV) consumption increased from 3.4% in 1990 to 6.2% in 2000 and to 31.7% in 2016 (Federal Ministry for Economic Affairs and Energy of Germany, 2018). Germany dominated the diffusion of both wind and PV technologies in the 1990s and 2000s and it was overtaken by China only recently. According to results of (Wiebe, 2016), the diffusion of these technologies in Germany was not primarily due to cost decreases in technologies, but to strong policy support that later lead to cost decrease (Wiebe, 2016), also shows the negative relation between capacity installed of solar PV/wind and the corresponding module/wind turbine prices. Although FIT has positive effects in promoting RETs, RPS and auctions are more effective than FIT in the short term if cost-effectiveness is defined as minimizing consumer costs (Wiebe, 2015). The rapid expansion of variable renewables requires more flexible energy systems in order to ensure reliable and cost-effective system integration. Therefore, as renewable technologies have matured and their costs have fallen, large-scale power projects have been increasingly supported by auctions, which can be designed to fulfil multiple policy objectives (IEA/IRENA, 2012). Auctions are being applied in countries with mature markets where policy makers are focusing on volume control and competitive price setting (Winkler, 2018). Brazil, Chile, Peru Denmark, Netherlands and Cyprus are example of countries that have implemented RE auctions and proved successful in promoting investment and mitigating risks and market power (De Mello Santana, 2016 and Baumber, 2017). For example, (IRENA, 2017) shows that recent auctions in Brazil, Canada, Germany, India, Mexico and Morocco have resulted in onshore wind power LCOEs as low as USD 0.03/kWh. While many countries have moved from FIT policies with administratively set support towards competitively set tariffs through auctions, some countries have chosen to implement both. For example, Germany, Italy, China and Malaysia are using auctions for large-scale projects and FIT for smaller projects (Marcantonini, 2017 and Atalay, 2017), suggests that in cases like the Jiangsu province (China), the inclusion of FITs to a sector that already had auctions proved to be successful.
Literature also includes quota systems (i.e. Renewable Purchase System (RPS)) as an efficient instrument to defend and support further market development of renewable (Umamaheswaran, 2015; Liu, 2018; Liu, 2018; Purkus, 2014; De Mello Santana, 2016). As technologies are exposed to
competition with established incumbent technologies, energy producers may underinvest in renewables if they are uncertain about their future costs, demand expectation and overall profitability. Thus obligations and quantity-based instruments appear to be more effective policy mechanisms (Nicolli, 2016). Renewable Energy Certificates (REC) is also a quantity-based instrument frequently adopted by stakeholders (Rodríguez, 2014). RECs represent the environmental benefits derived from RE projects and they are sold (in blocks of MWh) as a commodity separately from the electricity. Whereas RPS is a mandatory instrument that obligates utilities to purchase a specific amount of RE, REC is a market-based instrument that incentive companies to achieve their low carbon targets and to guarantee Renewable Purchase Obligation (RPO) compliance. The market-based incentives for meeting the RPO targets are a common practice in the UK and Australia. For example, Australia’s Renewable Energy Target mandates the generation of required amounts of renewable generation, but allows liable parties to meet their obligations by purchasing certificates from other parties rather than generating the electricity themselves (Amrutha, 2017). From the insights drawn from (Amrutha, 2017), even though RPO itself can promote the increase in renewable electricity share, REC proves to be effective in increasing the share of renewable electricity at lower costs. Although mandatory measures may have high effects, they are usually costly due regulatory enforcement and market opposition, while voluntary measures are better accepted by the market (Di, 2012 and Milt, 2017).
In this regard, literature also classifies energy policies in command-and-control and market- incentive. Command-and-control is direct regulation in which governments set a mandatory regulation that the market must follow. Market-based policies are voluntary and designed to incentivize the market to develop or provide a good or service (Di, 2012). Chinese government has been a widely implementer of command-and-control mechanisms to achieve carbon reduction targets especially in industry. Most studies agree that regulations have brought greater pressure to bear on industrial companies compared with those responding to market-based policy (Liu, 2016; Yu, 2015; Scordato, 2018; Zhang, 2018), emphasizes that after the Renewable Energy Law in 2005, from 2004–2014, China’s investment in renewables increased from 3 to 83.3 billion USD. Also, its share of global investment grew rapidly from 6.7% to more than 30%. Furthermore, renewables accounted for more than 20% of China's total generating capacity (Zhang, 2017). According to (Liu, 2017), during the 12th Five Year Plan (2011-2015), industrial sectors have made significant progress towards energy conservation and carbon mitigation. National energy consumption per unit GDP decreased by 19.7%, with 670 million tons of standard coal saved. Although several scholars defend the effectiveness of mandatory measures over market-based, the superiority of market-incentive measures to command-and-control instruments often raises the debate in literature (Yahoo, 2017; Hojnik, 2016; Wang, 2015). Some scholars indicate that the country is transitioning toward a more market-oriented approach (Dong, 2017; Nielsen, 2017). The results of an econometric model in China (Si, 2018) show that command-and-control policies, such as emission standard for air pollution, technology standard and renewable electricity mandate, lead to a shy decrease of 0.624%. Funding/subsidies for reducing fossil fuel consumption and taxes on fossil fuel consumption lead to a decrease of 7.003% and 3.792%, respectively, in total energy consumption per capita. It
suggests that these policies are effective in reducing energy consumption. As well as the measures to encourage the promotion of renewable energy, policymakers have also focused on instruments to improve EE in industry, transport and residential sectors to reduce energy consumption and CO2
emissions. Government policies can play a vital role in increasing the uptake of currently available technologies, in addition to accelerate the development of future technologies. Examples of EE policies are market-based instruments such as subsidies, taxes and cap-and-trade, regulatory instruments, such as codes, resource standards, utility restructuring, and information instruments/programs, such as labeling, certification and reporting. Literature has included several studies analyzing the cost-effectiveness of EE policies worldwide (Yu, 2015), estimates the total energy savings resulted from EE policies implemented in the 11th Five Year Planin the industrial sector in China, including command-and-control measures, economic incentives and disincentives, pricing instruments and informational measures. According to the results, during the 11th Five Year Plan, EE policies implemented in industry achieved a cumulative energy savings of 322 Mtce (9.4 EJ) against the baseline scenario. Annual energy savings varied greatly over the five-year period, from 11 Mtce in 2006 to 122 Mtce in 2010. (Yushchenko, 2017). Evaluated the cost-effectiveness of EE programs in Switzerland based on three electricity-saving programs in Geneva. Results show that EE programs can contribute to EE target achievement while having positive economic and social impacts, including GDP increase and employment. However, EE programs can potentially lead to increased energy tariffs and higher costs for utilities (Bye, 2018) looks at the 2030 policy goals for residential EE and how they interact with targets for restricting CO2 emissions. The economic costs of
the EE policies are found to be high: equivalent to a welfare loss of 1%. (Marin, 2017) indicates that technology competition and market penetration are major determinants of efficiency gains. In this regard, a further policy stimulus towards supply-push drivers such as innovation policies for EE-oriented R&D activities and interventions that aim to reduce trade barriers and increase the manufacturers' network capacity (through ICTs investments or collaboration projects) would be key complementary actions to policies targeted at consumers.
Costantini, (2017) provides an empirical investigation of the role played by selected characteristics of the policy mix in inducing innovation in EE technologies. An original dataset covering 23 OECD countries over the period 1990–2010 combines the full set of policies in the EE domain for the residential sector with data on patents applied over the same period in this specific technological sector. The econometric results suggest that demand-pull and technology-push instruments are able to stimulate innovative performance in EE technologies. The most effective policy instrument is the demand-pull option represented by the energy tax variable, with a higher estimated coefficient compared with that for the technology-push policy variable, namely the stock of R&D in EE. Energy policies in the transport sector are also an important issue addressed in literature. Measures to promote the adoption and improvement of electric vehicles (EV), biofuels and eco-friendly technologies have been applied in many countries, especially in USA, Europe, Japan, Brazil and China. Emission standards for newly registered cars, energy labels to support more sustainable car choices, and subsidies for electric car purchases were applied in Germany (Gössling,
2017 and Hesselink, 2019). Energy labels for cars were introduced in 2011, and in 2015, new car registrations suggest that there is considerable progress in the registration of the most efficient cars (A+), which have increased by 110% compared to 2014. The results suggest that despite technological progress in car engine technology, absolute emissions from the transport sector have remained stable over a quarter of a century. It was a result of insufficient national climate policies for the road transport sector that consider interrelationships of car fleet development, driver behavior, and corresponding fuel use distributions. EVs still have not reached sharp cost reduction to achieve a large-scale commercialization in most countries.
Factors influencing EV market share include high battery costs, financial incentives, charging infrastructure, and local production. Thus the advantages of EV over internal combustion engine vehicles in mitigating climate change and local air pollutants in congested cities will depend strongly on the policy support, electricity mix and charging strategies (Dhar, 2017), analyses the role of EV in India and conclude that the reference scenario results indicate that EV policies as outlined in India's INDC would require additional policies to support the domestic EV market both on the supply and demand side. The EV scenarios assessment shows that direct financial incentives to EV buyers and support to upfront investments in infrastructure and batteries can help increase the share of EVs in India in the short to medium term (2030). Regarding biofuel, literature has analyzed the energy-related measures that promote biofuel supply and the market development of biofuel vehicles. Brazil is an example of a consolidated successful program to stimulate ethanol production, with the National Alcohol Program (Proalcool). It is estimated that during the first phase of Proalcool (1975– 1989) the Brazilian government invested approximately US$ 4 billion while private investment accounted for another US$ 3.1 billion (Oliveira, 2017). At the end of the program, more than 90% of light-duty vehicles feet used ethanol. In 2003 Brazil launched the flex-fuel vehicles (FFVs), which can run on both ethanol and gasoline or combinations of both. FFVs quickly began to outpace gasoline vehicles, representing 69% of all vehicles in Brazil in 2015 up from just 21% in 2007. Furthermore, sugarcane expansion in Brazil has nearly doubled since 2005, from 5,815,151 ha to 10,870,647 ha in 2015. In 2017, Brazil produced 179 million barrels of ethanol and 26 million barrels of biodiesel (National Petroleum Agency, 2019), evaluates the capacity expansion strategies of biofuels supply and the potential for the market penetration of biofuel vehicles in Iceland based on a market economic system simulation. The results indicate that the dynamics of the bio-diesel market are not highly sensitive to the supply strategies employed, although they are less costly. However, changing the capacity planning strategy could significantly influence the medium-term development of biogas as well as the evolution of the bio-ethanol market throughout the planning horizon until 2050.
mechanisms in supporting the large-scale generation and commercialization of RETs, enabling higher efficiency and lower costs. Generally, literature classifies these policies in technology-push and demand-pull approach and market incentive and command-and-control approach. Unfortunately, the literature doesn’t combine them. These energy policies should be designed and implemented together to achieve better results, however, they are normally isolated and non-coordinated actions.
[image:5.595.314.550.115.335.2] [image:5.595.315.549.370.686.2]Classification of energy policy mechanisms in the world and review of these policies in selected countries: This section classifies the energy policy mechanisms in 140 countries aggregating the existing classification of technology-push or demand-pull policies with market incentives or command-and-control, based on the 4QP method. This section also selects 10 countries that had a variation higher than 10 pp in the RE share of the total energy consumption to conduct another review. A further investigationin theIEA/IRENA Global Renewable Energy Policies and Measures Database [56]was done in 140 countries, considering2,168 policies and measures that promote renewable energy. Table 1 dividedthe databaseinto the following7 regions: Europe & Central Asia, East Asia & Pacific, Latin America & Caribbean, Sub-Saharan Africa, North America, Middle East & North Africa, and South Asia. Most policies and measureswere found in Europe & Central Asia, with 43% of the total, followed by East Asia & Pacific, and Latin America & Caribbean, with 19% and 13%,respectively. Table 2 disaggregated this data into 20 countries that had more policies and measures in the world.
Table 1. IEA/IRENA Global Renewable Energy Policies and Measures by Region
Region Policies/Measures % Participation total
Europe & Central Asia 934 43% East Asia & Pacific 411 19% Latin America & Caribbean 275 13%
Sub-Saharan Africa 183 8%
North America 178 8%
Middle East & North Africa 111 5%
South Asia 76 4%
Total 2168 100%
Source: IEA/IRENA database
The 2,168 policies and measures are composed by the sum of all energy instruments adopted by the140 countries from 2000-2015. The instruments are distributed into 14 types, as shown in Table 3. All 2,168 policies and measures from the 140 countries were classified according to the 4QP method, which considers the four categories of technology-control, market-control, techno-economic and open market policy, as explained in section 2. Figure 2 illustrates the results. The upper-right quadrant of Figure 2 shows the demand-pull and command-and-control category, called market-control policy. It was responsible for 669 (30,9% of the total) policies and measures in the 140 countries. The upper-left quadrant shows the technology-push and command-and-control category, called technology-control, with only 3 polices (0,1%). The lower-right quadrant shows the demand-pull and market incentive category, called open market policy, with 738 policies, which represents 34,0% of the total. The lower-left quadrant shows the technology-push and market incentive category, called techno-economic policy, with 737 policies and measures (34,0% of the total). 21 policies and measures were
[image:5.595.39.285.445.543.2]not classified since there was a lack of information in the database, representing 1% of the total.
Table 1. IEA/IRENA Global Renewable Energy Policies and Measures by Country
Country Policies/Measures % Participation total
China 119 5,49%
United States 111 5,12%
Australia 85 3,92%
Canada 67 3,09%
Spain 58 2,68%
India 55 2,54%
France 52 2,40%
Italy 51 2,35%
United Kingdom 47 2,17%
Sweden 46 2,12%
Germany 46 2,12%
Belgium 44 2,03%
Mexico 39 1,80%
Indonesia 35 1,61%
Norway 34 1,57%
Ireland 34 1,57%
Portugal 33 1,52%
Denmark 33 1,52%
Slovak Republic 31 1,43%
Japan 31 1,43%
Others 1117 51,52%
Total 2168 100,00%
Source: IEA/IRENA database
Table 2. Types of Instrument
Types of Instruments Quantity of Policy and Measures Voluntary Standards 642
Mandatory Standards 376 Direct Investments 330 Credit Incentives 226
Feed-in tariff 206
Tax Credits 179
Information Campaign 72
Carbon Tax 37
Auctions 31
Renewable Energy Certificates 24
Unidentified1 23
Renewable Portfolio 13 Energy Labelling 5 Technology Transfer 3
CAP and Trade 1
Total 2,168
Source: IEA/IRENA database
Figure 2. Energypolicy classification in the 140 countries according to the 4QP method[6][56]
Figure 3 shows the data of Figure 2 desagregated, including the number of each policy mechanisms in the 140 countries.
1Unidentified group contain policies and measures not classified by IEA/IRENA database
(due to lack of information) and it represents 1% of total policies and measures.
Figure 3. Disagregation of energy policies in the 140 countries according to the 4QP method [6][56]
Renewable portfolio, carbon tax, auctions, mandatory standards, cap-and-trade, FITs and energy labeling are the most used policy mechanisms in the market-control category (De Mello Santana, 2017). These are demand-pull policy mechanisms because they increase private profits; moreover, they are also command-and-control mechanisms because they rely on regulation as permission, prohibition and standard setting. These policy mechanisms usually have a high potential to be effective in promoting clean energy technology. They usually create stable market conditions, decreasing risk perception. The renewable portfolio standard is a regulatory mandate to increase production of energy from renewable and/or clean sources at a given rate, percentage or amount. A carbon tax is a form of carbon pricing for emissions that are released into the atmosphere to promote clean energy sources, and it is a taxation established by the government. Auctions are used when a regulatory authority announces that it wishes to install a certain capacity of a given technology or suite of technologies, it is a quantity-based regulated instrument. Althought the price setting is market-based, auctions serve as a government mechanism to control the capacity expansion of renewables as well as the cost of support by setting either a budget, capacity or generation cap (Winkler, 2018)2.The bidder with the lowest offer is selected and can go ahead with the project. Usually the parties sign a long-term contract (power purchasing agreement). Auctions are similar to FIT, which also offer long-term contracts for energy producers and the costs are shared by customers. FITs are subsidies per MWh generated, paid in the form of guaranteed premium prices, and combined with a purchase obligation by the utilities. The main difference between the two is that in auctions the price paid is set by the market depending on the amount of energy traded, and for FITs the price is set by government, most commonly based on production costs. Mandatory standards can be effective mechanisms for limiting or promoting specified
2 Renewable energy auctions are also known as “demand auctions” or
“procurement auctions” are quantity-based mechanism where government sets the volume of product to be auctioned and the lower and upper limits on the project size. Furthermore the government establishes a price ceiling, the highest price a supplier is allowed to set per unit generated [73]. In New England, each type of resource has a resource-specific set of rules for qualification that enables it to participate in the forward capacity market. All existing resources are automatically entered into the capacity auction and assume a capacity supply obligation for the relevant commitment period [74].
energy technologies. Cap-and-trade sets a mandatory cap on emissions in any designated region, which may be a city or even the world. Lastly, energy labeling is the information about energy-efficient equipment, and it is used to inform the customers though mandatory labels.
Knowledge exchange, voluntary standards, information campaigns and renewable energy certificates (RECs) are the most widely-used energy policy mechanisms in the open market policy category (De Mello Santana2017). These are demand-pull policy mechanisms because they increase private profits; moreover, they are also market incentive because they are not mandatory. Knowledge exchange, according to the Economic and Social Research Council, is a two-way process where social scientists and individuals or organizations share learning, ideas and experiences. Voluntary standards are non-mandatory standards used to incentivize the market to adopt best energy technologies and practices. Information campaigns are used to inform the market about any existing energy policy mechanism. Direct government investments, credit incentives and tax credits are the most used policy mechanisms in the technology-control category. These are technology-push policy mechanisms because they reduce private costs, and they also are market incentive driven since they are not mandatory. Direct government investments provide grants to demonstrate or deploy clean energy technologies. Full grants are usually provided to demonstration plants, and cost sharing is used to promote commercial deployment facilities. In the commercial deployment case, the share amount is usually given so the investment is feasible to investors. The effectiveness of this policy mechanism is usually high because it can make a technology economically feasible, depending only on the amount of investment provided. Credit incentives are lower than market interest rate loans that are provided by state banks or other government agencies. Because initial investment is a large percentage of clean energy technology life cycle costs, credit incentives are very effective. Tax credits are also used to promote clean energy technologies around the world. They are less effective than credit incentives and direct investments, but they are also useful, especially if used together with other policy mechanisms (De Mello Santana, 2017).
Direct government investments, credit incentives and tax credits are the most used policy mechanisms in the techno-economic category. These are technology-push policy mechanisms because they reduce private costs, and they also are market incentive driven since they are not mandatory. Direct government investments provide grants to demonstrate or deploy clean energy technologies. Full grants are usually provided to demonstration plants, and cost sharing is used to promote commercial deployment facilities. In the commercial deployment case, the share amount is usually given so the investment is feasible to investors. The effectiveness of this policy mechanism is usually high because it can make a technology economically feasible, depending only on the amount of investment provided (De Mello Santana, 2017). Credit incentives are lower than market interest rate loans that are provided by state banks or other government agencies. Because initial investment is a large percentage of clean energy technology life cycle costs, credit incentives are very effective. Tax credits are also used to promote clean energy technologies around the world.
They are less effective than credit incentives and direct investments, but they are also useful, especially if used together with other policy mechanisms (De Mello Santana,
Market-control policy Technology-control policy
Techno-economic policy Open market policy
Tec
h
no
logy
-pu
sh
Command-and-control
Market-incentive
D
emand
-pu
ll
Feed-in tariff (206) Carbon tax (37)
Auctions (31) Renewable portfolio (13)
Energy labeling (5) CAP and trade (1)
Voluntary standards (642) Information campaign (72) Renew. energy certificates (24) Direct investment (331)
2017). To make a connection from the classification above and the effectiveness of the energy policy and measures implemented worldwide, the paper selected the countries that had a variation higher than 10 pp of RE share in total energy consumption from 2000 to 2015, using the World Bank database.Denmark, Bosnia and Herzegovina, Iceland, Sweden, Lithuania, Finland, Italy, Germany, Uruguay, Zimbabwe had a variation higher than 10 pp in the RE share of the total energy consumption. Table 3 illustrates these 10 countries that achieved this minimum criterion.The first column shows theRE consumption share variation from 2000 to 2015 in pp, the second column is the correspondent absolute value in kiloton of oil equivalent (ktoe).
Table 3. RE consumption share variation from 2000 to 2015inthe selected countries (IEA/IRENA, 2019 and IEA, 2019).
Country Name Δ RE, PP (2000-2015)
Δ RE, ktoe (2000-2015)
Denmark 22 2,908
Bosnia and Herzegovina 21 973
Uruguay 19 1,628
Iceland 16 1,127
Sweden 13 3,018
Zimbabwe 13 1,770
Lithuania 12 949
Finland 12 2,996
Italy 11 13,035
Germany 11 22,716
TOTAL 51,120
According to (De Mello Santana, 2016) it is recommended to combine mechanisms in order to improve policies and mechanisms results. Policy effectiveness is positively affected by the balance of mechanisms from different categories (Costantini, 2017 and Gössling, 2017). Denmark increased the share of RE in the total energy consumption in 22 ppfrom 2000 to 2015 (11% to 33%) (IEA, 2018), increasing aproximately 2,908 ktoe in the period (The World Bank, 2019). Considering electricity generation, ithas increased1,334 ktoe, which represents 281% from 2000 to 2015 (IEA, 2019).The participation of RE in the electricity matrix shifted from 17% in 2000 to 68% in 2015, mainly driven by wind and biofuel, that represented an increase of 233% and 431%, respectively. Furthermore, there was a reduction of non-RE sources. Coal, oil and gas reduced their share in 57%,93% and 79% in the same period, respectively. Denmark has the world's largest wind power consumption share. In 2015, it corresponded to 40% of total electricity demand. PV electricityis also gaining importance, in 2015 the country has an installed capacity of 783 MW, producing2% of the total electricity demand (Hvelplund, 2017). Wind energy producers were supported by a number of different economic schemes, mainly based on FIT.In this scheme, the distribution companies are obligated to buy all the electricity produced by wind turbines (Aslani, 2013). FIT is classified as market-control policy in the 4QP method. Subsidies and grants also play an important role in the diffusion of RETs since 2004 (The World Bank, 2019). From the 33 energy policy and measures in Sweaden, 14 were open market, 9 techno-economic and 10 market-control, according to the 4QP method. Bosnia and Herzegovina increased the share of RE in the total energy consumption in 21 ppfrom 2000 to 2015 (19% to 41%) (IEA, 2019), increasing aproximately973 ktoe in the period. The major driver for this increment were biofuels and waste, that increased 402 ktoe in the same period,representing 17% of the total total energy consumption. Bosnia and
Herzegovina have5 policies and measures topromote RE, including 2open market, 1 techno-economic and 2 market-control (The World Bank, 2019). Two FIT systems are effective since 2011 in Bosnia and Herzegovina (IEA, 2019). Theseguaranteed tariffs wereprovided for 12 years for solar, wind, hydro and biomass (United Nations Development Programme, 2019). FIT was introduced with relatively high tariffs since there were no previous RES investments, and the goal was to attract the first investors giving them some support and reducing their risks (Punda, 2017). Electricity is predominantly produced by hydro and thermal power plants in Bosnia and Herzegovina.
Uruguay increased the share of RE in the total energy consumption in 19 ppfrom 2000 to 2015 (39% to 58%) (IEA, 2018) increasing aproximately 1,628 ktoe in the period [57]. The increase of RE share was mainly due to biofuels and solid waste, that represented 1,340 ktoe. From the 21 energy policy and measures in Uruguay, 6 were techno-economic and 15 market-control (The World Bank, 2019). Uruguay carried out 10 energy auctions, most for wind power, and became one of the countries with the highest percentage of electricity produced from this source, with approximately 22% in 2015 (Washburn, 2019). Two other policy mechanisms conducted by Uruguay were net metering incentive and tax reduction for RETs. Iceland increased the share of RE in the total energy consumption in 16 ppfrom 2000 to 2015 (61% to 77%) (IEA, 2019), increasing aproximately 1,127 ktoe in the period[57].In 2015, 81% of Iceland's primary energy supply was from RE (mostly hydro-power and geothermal); the remainingwas mainly oil for the transportation sector (Shortall, 2017 and Atlason, 2018). Since 2004, Iceland has introduced environmental taxes, including a diesel tax, a carbon tax and a CO2based vehicle tax. Iceland also joined the European
Emission Trading System (EU ETS) in 2007.They included3% of the public R&D budget toenergy &environmentprojects from 2011 to 2013, the highest share in the OECD (OECD, 2014).Taxes and R&D are both classified as techno-economic policyin the 4QP method. Sweden increased the share of RE in the total energy consumption in 13 ppfrom 2000 to 2015 (61% to 77%) (IEA, 2019), increasing aproximately 3,018 ktoe in the period (The World Bank, 2019). According to the IEA/IRENA policy database, Sweden has 46 policies and measures that promote RE. The Swedish government was one of the first countries to propose a carbon tax, implemented in 1991.
Sweden has several environmental taxes such as energy, pollution, resource and transportation taxes (Shmelev, 2018). Energy taxes corresponds to 79.2% of the total revenue provided from environmental taxes in Sweden (Shmelev, 2018). Energy taxes, according to the 4QP method, is classified as market-control policy. From the 46 energy policy and measures in Sweden, 14 were open market, 22 techno-economic and 10 market-control (The World Bank, 2019). Zimbabwe increased the share of RE in the total energy consumption in 13 ppfrom 2000 to 2015 (69% to 82%) increasing aproximately 1,770 ktoe in the period (The World Bank, 2019). From the 7 energy policy and measures in Zimbabwe, 2 were open market, 2 techno-economic and 3 market-control. The two most important policies in Zimbabwe were an import tax reduction for PV systems and an ethanol blending regulation for gasoline vehicles, which ranged from 5% to 15% in the last decade (The World Bank, 2019). Lithuania increased the share of RE in the total energy
consumption in 12 ppfrom 2000 to 2015 (17% to 29%) (IEA, 2019), increasing aproximately 949 ktoe in the period (The World Bank, 2019). This increase was mainly due to the expansion of RE in the total electricity generation in the same period (wind, biofuels and hydropower), together with the end of nuclear power generation (IEA, 2018). Consequentely, the electricity generation share of REin Lithuania increased from 6% in 2000 to 52% in 2015. Lithuania has implemented 17 policies and measures that promote RE, including 6 open market, 2 techno-economic and 9market-control (The World Bank, 2019). Finland increased the share of RE in the total energy consumption in 12ppfrom 2000 to 2015 (31% to 43%) (IEA, 2019), increasing aproximately 2,996 ktoe in the period (The World Bank, 2019). The major driver for this increment was the reduction of 1,361 ktoe of coal, oil and natural gas and the increase of biofuels and solid waste consumption. From the 26 energy policy and measures in Finland, 10 were open market, 12 techno-economic and 5 market-control (The World Ban, 2019). One of the most important policy mechanisms in Finland is FIT for wind power and biogas, initiated in 2010. In Finland, the costs of FIT are granted by the country’s budget, and the subsidy is paid as the difference between the target and the market price.
Italy increased the share of RE in the total energy consumption in 11 ppfrom 2000 to 2015 (5% to 16%) (IEA, 2018), increasing aproximately 13,035 ktoe in the period (The World Bank, 2019). Theshare of RE in the electricity matrix changed from 21% in 2000 to 40% in 2015 (IEA, 2019), mainly driven by an increase in solar PV, wind and biofuel,togetherwith a reduction of oil consumption, which dropped 26%in the same period. The penetration of PV and wind generation in the Italian power grid has significantly increased mainly because a FIT scheme and green certificates (Lazzeroni, 2017 and Marra, 2018). From 2008 to 2011, the installedcapacity of wind power almost doubled, increasing from 3,538 MW to 6,936 MW. The growth of solar PV capacity was also significant, increasing by 2,856% (from 432 MW in 2008 to 12,773 MW in 2011) (Kessler, 2019). The green certificate (GC) system started in 2001 in Italy. The GC is a tradable asset granted by the government in proportion to the energy produced by RE power plant. GCs are a guarantee that a certain amount of electricity, usually 1 MWh, sold by retailers is produced by RES (Punda, 2017). Depending on the technology, 1 MWh can generate more than one certificate, and thus different RES technologies can get different support levels. Retailers then shift the cost of electricity produced by RES to the end consumers. The principle is the same as in the tariff system, with the exception that in the tariff system the regulatory body determines the cost to be transferred to the end consumers, not the retailers (Punda, 2017). GC is classified as open-market policy since it is demand-pull and it is voluntary. From the 51 energy policy and measures in Italy, 13 were open market, 19 techno-economic and 19 market-control (The World Bank, 2019).
Germany increased the share of RE in the total energy consumption in 11 ppfrom 2000 to 2015 (4% to 15%) (IEA, 2019), increasing aproximately 22,716 ktoe in the period (The World Bank, 2019). Oil consumption dropped 22.019 ktoe in the same period. Considering electricity generation, RE increased 23 PP, mainly because of solar PV, wind power and biofuel (IEA, 2019). FIT has been the main instrument to promote RE in the country. As stated previously, (Böhringer, 2017), finds that the subsidies granted under the Electricity Feed-in Law (SEG) and Renewable Energy Source Act (EEG)
[image:8.595.310.559.237.367.2]triggered a massive growth in renewable electricity production in Germany, mainly based in FIT since 1990. However, in 2014 Germany introduced auctions for solar energy, and in 2016 the government decided to switch policies from FIT to auctions (Dotterud, 2018). From the 46 energy policy and measures in Germany, 11 were open market, 19 techno-economic and 16 market-control. Figure 4 compares all the 2168 policy mechanisms distribution with those in the selected countries. The share of open market policies in the world was greater than in the selected countries (34,0% against 28,6%). The reverse happens in techno-economic and market-control policies, in which the share of the world was lesser than in the selected countries, with 34% vs. 36,1% and 30,9% vs. 35,3%, respectively. The results suggest that enforced policies are more effective than market-oriented policies to promote RE.
Figure 4. Policy mechanisms share comparison between the world and the selected countries
The 140 countries were also categorized into four quadrants considering the governance structure and the development status. The government effectiveness indicator was used to represent governance, and the GDP per capita was used to represent the development status. Figure 5 illustrates the results. The upper-right quadrant of Figure 5 shows the countries with both GDP per capita and government effectiveness above the world average in 2015 (US$ 10,218 and zero, respectively).
Source: the World Bank dataset
Figure 5. GDP per capita andgovernment effectiveness between the world and the selected countries
[image:8.595.308.562.526.723.2]and government effectiveness below the world average; globally, 48% of countries falls into this quadrant, while only 20% of the selected countries. It suggests that ahigher GDP per capita and government effectiveness leads to a higher policy effectiveness.
Conclusion
The promotion of energy for sustainable development is a challenge for governments and regulators. Different policy mechanisms were used by policymakers to promote energy technologies worldwide in the last decade. However, despite the massive technological advances and sharp cost reductions of RETs worldwide (IEA/IRENA, 2018), progress has not been homogenous across countries. With the submission of the Nationally Determined Contributions (NDCs) to the Paris Agreement, a long-term political signal was sent to decarbonize the energy sector. This paper reviewed, organized and classified energy policy mechanisms in 140 countries. The results found in 140 countries show that 738 open market policies were implemented in the last decades; techno-economic, market-control and technology-control were responsible for 737, 669 and 3 policies in these countries, respectively. The paper also selected the countries with a variation higher than 10 pp in the RE share of the total energy consumption. The share of open market policies in the world was greater than in the selected countries (34,0% against 28,6%). The reverse happens in techno-economic and market-control policies, in which the share of the world was lesser than in the selected countries, with 34% vs. 36,1% and 30,9% vs. 35,3%, respectively. The results suggest that enforced policies (that relies on regulation as permission, prohibition and standard setting) are more effective than market-oriented policies to promote RE.There is an importance of the enforcement phase in ensuring the quality and effectiveness of a especific policy, especially in the initial phase of the technology cycle and diffusion. Policymakers that are seeking for promoting renewable energy should take a deep look into these aspects of policy classification worlwide to better guide and balance their own country policy framework.The method used and the results of this paper may help policymakers better design and deploy energy policy mechanisms. It may be used as a diagnostic tool that helps policymakers to better analyze the country specific policy framework and identify the most suitable and effective energy mechanism to be implemented or designed. Policy organization is one of the steps for desging a policy mechanism.
REFERENCES
[dataset] IEA. Electricity generation from renewables by source. <https://webstore.iea.org/electricity-information-2018>;2019. [Accessed February 2019] n.d.
[dataset] IEA. IEA World Energy Balances 2018.
<https://webstore.iea.org/world-energy-balances-2018>; 2018. [Accessed February 2019] n.d.
[dataset] IEA/IRENA. Global Renewable Energy Policies and
Measures Database. <https://www.iea.org/
policiesandmeasures/renewableenergy>;2019. [Accessed January 2019] n.d.
[dataset] The World Bank. World Development Indicators. Renewable energy consumption [EG.FEC.RNEW.ZS].
<http://wdi.worldbank.org/table/3.13#>;2019 [Accessed
January 2019] n.d.
Åhman M, Birger J, Ove P. Demonstrating climate mitigation technologies : An early assessment of the NER 300 programme 2018;117:100–7.
Albrecht J, Laleman R, Vulsteke E. Balancing demand-pull and supply-push measures to support renewable electricity in Europe. Renew Sustain Energy Rev 2015;49:267–77. doi:10.1016/j.rser.2015.04.078.
Amrutha AA, Balachandra P, Mathirajan M. Role of targeted policies in mainstreaming renewable energy in a resource constrained electricity system: A case study of Karnataka electricity system in India. Energy Policy 2017;106:48– 58. doi:10.1016/j.enpol.2017.03.044.
Aslani A, Naaranoja M, Wong K V. Strategic analysis of diffusion of renewable energy in the Nordic countries.
Renew Sustain Energy Rev 2013;22:497–505.
doi:10.1016/j.rser.2013.01.060.
Atalay Y, Kalfagianni A, Pattberg P. Renewable energy support mechanisms in the Gulf Cooperation Council states : Analyzing the feasibility of feed-in tari ff s and auction mechanisms. Renew Sustain Energy Rev 2017;72:723–33. doi:10.1016/j.rser.2017.01.103.
Atlason RS. EROI and the Icelandic society. Energy Policy 2018;120:52–7. doi:10.1016/j.enpol.2018.04.069.
Baumber A. Enhancing ecosystem services through targeted bioenergy support policies. Ecosyst Serv 2017;26:98–110. doi:10.1016/j.ecoser.2017.06.012.
Böhringer C, Cuntz A, Harhoff D, Asane-otoo E. The impact of the German feed-in tariff scheme on innovation : Evidence based on patent fi lings in renewable energy technologies 2017;67:545–53.
Bye B, Fæhn T, Rosnes O. Residential energy efficiency policies: Costs, emissions and rebound effects. Energy 2018;143:191–201. doi:10.1016/j.energy.2017.10.103. Cantner U, Graf H, Herrmann J, Kalthaus M. Inventor
networks in renewable energies : The influence of the policy mix in Germany. Res Policy 2016;45:1165–84. doi:10.1016/j.respol.2016.03.005.
Costantini V, Crespi F, Palma A. Characterizing the policy mix and its impact on eco-innovation: A patent analysis of energy-efficient technologies. Res Policy 2017;46:799– 819. doi:10.1016/j.respol.2017.02.004.
De Mello Santana PH. Cost-effectiveness as energy policy mechanisms: The paradox of technology-neutral and technology-specific policies in the short and long term.
Renew Sustain Energy Rev 2016;58:1216–22.
doi:10.1016/j.rser.2015.12.300.
De Mello Santana, PH. Energy for Regional Development. Jackson R., Schaeffer P. Reg. Res. Front. - Vol. 1. Adv. Spat. Sci. (The Reg. Sci. Ser., Springer Cham; 2017, p.
151–60.
doi:https://doi.org/10.1007/978-3-319-50547-3_9.
del Río P, Resch G, Ortner A, Liebmann L, Busch S, Panzer C. A techno-economic analysis of EU renewable electricity policy pathways in 2030. Energy Policy 2017;104:484– 93. doi:10.1016/j.enpol.2017.01.028.
Dhar S, Pathak M, Shukla PR. Electric vehicles and India’s low carbon passenger transport: a long-term co-benefits
assessment. J Clean Prod 2017;146:139–48.
doi:10.1016/j.jclepro.2016.05.111.
Di G, Gambardella A, Verona G. Technology push and demand pull perspectives in innovation studies : Current findings and future research directions. Res Policy 2012;41:1283–95. doi:10.1016/j.respol.2012.03.021. Dong H, Dai H, Geng Y, Fujita T, Liu Z, Xie Y, et al.
Exploring impact of carbon tax on China’s CO2reductions
and provincial disparities. Renew Sustain Energy Rev 2017;77:596–603. doi:10.1016/j.rser.2017.04.044.
Dotterud M. Historical institutionalist perspective on the shift from feed-in tari ff s towards auctioning in German renewable energy policy. Energy Res Soc Sci 2018;43:33–40.
EIA. EIA Total Energy Data 2019:3–4. https://www.eia.gov/ totalenergy/data/browser/index.php?tbl=T10.04#/?f=A. Federal Ministry for Economic Affairs and Energy of
Germany. Development of Renewable Energy Sources in Germany 2017 - Charts and figures based on statistical data from the. 2018.
Gössling S, Metzler D. Germany’s climate policy: Facing an automobile dilemma. Energy Policy 2017;105:418–28. doi:10.1016/j.enpol.2017.03.019.
Hesselink LXW, Chappin EJL. Adoption of energy efficient technologies by households – Barriers, policies and agent-based modelling studies. Renew Sustain Energy Rev 2019;99:29–41. doi:10.1016/j.rser.2018.09.031.
Hojnik J, Ruzzier M. The driving forces of process eco-innovation and its impact on performance: Insights from
Slovenia. J Clean Prod 2016;133:812–25.
doi:10.1016/j.jclepro.2016.06.002.
Hvelplund F, Alberg P, Meyer NI. Incentives and barriers for wind power expansion and system integration in Denmark 2017;107:573–84.
IEA RETD TCP. Commercial Readiness Index Assessment - Using the method as a tool in renewable energy policy design (RE-CRI). 2017.
IEA/IRENA. Renewable Energy Policies in a Time of Transition. <https://www.irena.org/-/media/Files/IRENA/ Agency/Publication/2018/Apr/IRENA_IEA_REN21_Poli cies_2018.pdf>. [Accessed February 12, 2019] n.d. IRENA. Findings renewable energy auctions status and trends
beyond price. Abu Dhabi: 2019.
IRENA. Power Generation Costs in 2017.
2017.https://www.irena.org/-/media/Files/IRENA/Agency/Publication/2018/Jan/IREN A_2017_Power_Costs_2018_summary.pdf?la=en&hash= 6A74B8D3F7931DEF00AB88BD3B339CAE180D11C3. (accessed January 12, 2019).
Keay M. UK energy policy – Stuck in ideological limbo?
Energy Policy 2016;94:247–52. doi:10.1016/
j.enpol.2016.04.022.
Kessler J, Sperling D. Tracking U . S . biofuel innovation through patents. Energy Policy 2016;98:97–107.
Laleman R, Albrecht J. Comparing push and pull measures for PV and wind in Europe. RENE 2014;61:33–7. doi:10.1016/j.renene.2012.04.025.
Lazzeroni P, Olivero S, Repetto M. Economic perspective for PV under new Italian regulatory framework. Renew Sustain Energy Rev 2017;71:283–95.
Liu D, Liu M, Xu E, Pang B, Guo X, Xiao B, et al. Comprehensive effectiveness assessment of renewable energy generation policy: A partial equilibrium analysis in
China. Energy Policy 2018; 115:330–41.
doi:10.1016/j.enpol.2018.01.018.
Liu W, Wang Z. The effects of climate policy on corporate technological upgrading in energy intensive industries: Evidence from China. J Clean Prod 2017;142:3748–58. doi:10.1016/j.jclepro.2016.10.090.
Liu X, Fan Y, Wang C. An estimation of the effect of carbon pricing for CO2mitigation in China’s cement industry.
Appl Energy 2017;185:671–86. doi:10.1016/
j.apenergy.2016.10.115.
MacGillivray A, Jeffrey H, Wallace R. The importance of iteration and deployment in technology development: A study of the impact on wave and tidal stream energy research, development and innovation. Energy Policy 2015;87:542–52. doi:10.1016/j.enpol.2015.10.002. Marcantonini C, Valero V. Renewable energy and CO 2
abatement in Italy. Energy Policy 2017;106:600–13. doi:10.1016/j.enpol.2016.12.029.
Marin G, Palma A. Technology invention and adoption in residential energy consumption: A stochastic frontier approach. Energy Econ 2017;66:85–98. doi:10.1016/ j.eneco.2017.06.005.
Marra A, Antonelli P, Agostinone S, Raucci D. Opening Pandora’s box of twenty years of research on energy policies: On the rise of a ‘technology-driven’ debate.
Energy Policy 2018;122:542–50. doi:10.1016/
j.enpol.2018.08.003.
Maurer LTA, Barroso LA. Electricity Auctions: An Overview of Efficient Practices 2011:155. http://regulationbodyof knowledge.org/wp-content/uploads/2013/04/
Maurer_Electricity_Auctions_An.pdf.
Milt AW, Armsworth PR. Performance of a cap and trade system for managing environmental impacts of shale gas surface infrastructure. Ecol Econ 2017;131:399–406. doi:10.1016/j.ecolecon.2016.09.016.
National Petroleum Agency (ANP). Statistics database. http://www.anp.gov.br/dados-estatisticos; 2019 (accessed January 10, 2019).
Nemet GF, Zipperer V, Kraus M. The valley of death , the technology pork barrel , and public support for large demonstration projects. Energy Policy 2018;119:154–67. doi:10.1016/j.enpol.2018.04.008.
Nemet GF. Demand-pull, technology-push, and government-led incentives for non-incremental technical change. Res Policy 2009;38:700–9. doi:10.1016/j.respol.2009.01.004. Nicolli F, Vona F. Heterogeneous policies , heterogeneous
technologies : The case of renewable energy. Energy Econ 2016;56:190–204.
Nielsen H. Productive efficiency in the iron and steel sector under state planning: The case of China and former Czechoslovakia in a comparative perspective. Appl
Energy 2017;185:1732–43.
doi:10.1016/j.apenergy.2015.12.125.
OECD. Iceland Environmental Performance Review. OECD
2014.
https://www.oecd.org/environment/country-reviews/Iceland Highlights web6.pdf.
Oliveira G de LT, McKay B, Plank C. How biofuel policies backfire: Misguided goals, inefficient mechanisms, and
political-ecological blind spots. Energy Policy
2017;108:765–75. doi:10.1016/j.enpol.2017.03.036. Polzin F, Migendt M, Täube FA, von Flotow P. Public policy
influence on renewable energy investments-A panel data study across OECD countries. Energy Policy 2015;80:98– 111. doi:10.1016/j.enpol.2015.01.026.
Punda L, Capuder T, Pand H, Delimar M. Integration of renewable energy sources in southeast Europe : A review of incentive mechanisms and feasibility of investments 2017;71:77–88.
Purkus A, Röder M, Gawel E, Thrän D, Thornley P. Handling uncertainty in bioenergy policy design - A case study analysis of UK and German bioelectricity policy instruments. Biomass and Bioenergy 2014;79:64–79. doi:10.1016/j.biombioe.2015.03.029.
makes economic sense ? Renew Sustain Energy Rev 2017;74:824–34. doi:10.1016/j.rser.2017.01.122.
Rodríguez MC, Haščič I, Johnstone N, Silva J, Ferey A. Inducing Private Finance for Renewable Energy Projects 2014. doi:http://dx.doi.org/10.1787/5jxvg0k6thr1-en. Scordato L, Klitkou A, Tartiu VE, Coenen L. Policy mixes for
the sustainability transition of the pulp and paper industry
in Sweden. J Clean Prod 2018. doi:10.1016/
j.jclepro.2018.02.212.
Shafiei E, Davidsdottir B, Leaver J, Stefansson H, Asgeirsson EI, Keith DR. Analysis of supply-push strategies governing the transition to biofuel vehicles in a market-oriented renewable energy system. Energy 2016;94:409– 21. doi:10.1016/j.energy.2015.11.013.
Shmelev SE, Speck SU. Green fiscal reform in Sweden : Econometric assessment of the carbon and energy taxation scheme. Renew Sustain Energy Rev 2018;90:969–81. Shortall R, Kharrazi A. Cultural factors of sustainable energy
development : A case study of geothermal energy in Iceland and Japan 2017;79:101–9.
Si S, Lyu M, Lin Lawell CYC, Chen S. The effects of energy-related policies on energy consumption in China. Energy Econ 2018;76:202–27. doi:10.1016/j.eneco.2018.10.013. Sung B, Song W. How government policies affect the export
dynamics of renewable energy technologies : A
subsectoral analysis. Energy 2014;69:843–59.
doi:10.1016/j.energy.2014.03.082.
Umamaheswaran S, Rajiv S. Financing large scale wind and solar projects - A review of emerging experiences in the Indian context. Renew Sustain Energy Rev 2015;48:166– 77. doi:10.1016/j.rser.2015.02.054.
United Nations Development Programme. Renewable Energy
Snapshot: Bosnia & Herzegovina 2014.
http://www.eurasia.undp.org/content/dam/rbec/docs/Bosni a & Herzegovina.pdf (accessed March 7, 2019).
Wang Q, Chen X. Energy policies for managing China’s
carbon emission. Renew Sustain Energy Rev
2015;50:470–9. doi:10.1016/j.rser.2015.05.033.
Washburn C, Pablo-romero M. Measures to promote renewable energies for electricity generation in Latin American countries 2019;128:212–22.
Wiebe KS, Lutz C. Endogenous technological change and the policy mix in renewable power generation. Renew Sustain
Energy Rev 2016;60:739–51. doi:10.1016/
j.rser.2015.12.176.
Winkler J, Magosch M, Ragwitz M. Effectiveness and efficiency of auctions for supporting renewable electricity – What can we learn from recent experiences? Renew
Energy 2018;119:473–89.
doi:10.1016/j.renene.2017.09.071.
Yahoo M, Othman J. Employing a CGE model in analysing the environmental and economy-wide impacts of CO2 emission abatement policies in Malaysia. Sci Total
Environ 2017;584–585:234–43. doi:10.1016/
j.scitotenv.2017.01.164.
Yu Y, Wang X, Li H, Qi Y, Tamura K. Ex-post assessment of China’s industrial energy efficiency policies during the 11th Five-Year Plan. Energy Policy 2015;76:132–45. doi:10.1016/j.enpol.2014.11.010.
Yushchenko A, Patel MK. Cost-effectiveness of energy efficiency programs: How to better understand and improve from multiple stakeholder perspectives? Energy
Policy 2017;108:538–50.
doi:10.1016/j.enpol.2017.06.015.
Zhang L, Sovacool BK, Ren J, Ely A. The Dragon awakens: Innovation, competition, and transition in the energy strategy of the People’s Republic of China, 1949–2017.
Energy Policy 2017;108:634–44. doi:10.1016/
j.enpol.2017.06.027.
Zhang Y, Wei Y, Zhou G. Promoting firms’ energy-saving behavior: The role of institutional pressures, top management support and financial slack. Energy Policy 2018; 115:230–8. doi:10.1016/j.enpol.2018.01.003.

![Figure 3. Disagregation of energy policies in the 140 countries according to the 4QP method [6][56]](https://thumb-us.123doks.com/thumbv2/123dok_us/8885705.948189/6.595.36.289.53.257/figure-disagregation-energy-policies-countries-according-qp-method.webp)


