Preliminary Analysis
Original Citation
Galea, Edwin R., Hulse, Lynn, Day, Rachel, Siddiqui, Asim, Sharp, Gary, Shields, Jim, Boyce,
Karen, Summerfield, Louise, Canter, David V., Marselle, Melissa and Greenall, Paul V. (2008) The
UK WTC9/11 Evacuation Study: An Overview of the Methodologies Employed and some
Preliminary Analysis. In: Pedestrian and Evacuation Dynamics 2008. Springer, London, UK, pp. 3
24. ISBN 9783642045035
This version is available at http://eprints.hud.ac.uk/id/eprint/8671/
The University Repository is a digital collection of the research output of the
University, available on Open Access. Copyright and Moral Rights for the items
on this site are retained by the individual author and/or other copyright owners.
Users may access full items free of charge; copies of full text items generally
can be reproduced, displayed or performed and given to third parties in any
format or medium for personal research or study, educational or notforprofit
purposes without prior permission or charge, provided:
•
The authors, title and full bibliographic details is credited in any copy;
•
A hyperlink and/or URL is included for the original metadata page; and
•
The content is not changed in any way.
For more information, including our policy and submission procedure, please
contact the Repository Team at: [email protected].
The UK WTC9/11 Evacuation Study: An Overview
of the Methodologies Employed and some
Preliminary Analysis
Edwin R. Galea1*, Lynn Hulse1, Rachel Day1, Asim Siddiqui1, Gary Sharp1,
Jim Shields2*, Karen Boyce2, Louise Summerfield2, David Canter3*, Melisa
Marselle3, Paul V. Greenall3.
1Fire Safety Engineering Group, University of Greenwich, London, UK
Contact email: 1*[email protected]
2FireSERT, University of Ulster, Belfast, UK
Contact email: 2*
3Centre for Investigative Psychology, University of Liverpool, UK
Contact email: 3*
Summary. This paper briefly describes the methodologies employed in the
collection and storage of first-hand accounts of evacuation experiences derived from face-to-face interviews with evacuees from the World Trade Center (WTC) Twin Towers complex on 11 September 2001 and the development of the High-rise Evacuation Evaluation Database (HEED). The main focus of the paper is to present a preliminary analysis of data derived from the evacuation of the North Tower.
1
Introduction
The evacuation of the WTC complex in 2001 is one of the largest full-scale evacuation of people in modern times with over 14,000 people escaping from the buildings. The survivors’ evacuation experiences provide valuable insights into the factors that helped and hindered egress within the rapidly changing high-rise building environment. Thus understanding survivors’ evacuation experiences is a vital component in unravelling the complex inter-related processes that drive high-rise building egress. It is now widely acknowledged that there are three broad stages through which any egress proceeds; making sense of the situation, planning to leave, and then finding and using a route out of the building [1]. It has also long been recognised that there are important social processes that influence decision making and thereby modify egress patterns. Analysis of the accounts of those evacuating from the WTC towers not only enables us to develop a more detailed understanding of what processes underlie each of the main evacuation stages but, due to the large number of people involved, it enables us to explore the impact of aspects of social and organisational factors on the effectiveness of the whole evacuation.
from the WTC twin towers evacuation. Some 271 evacuees have been interviewed. Details of the project can be found on the HEED website www.wtc-evacuation.com. Several studies have already investigated the evacuation of the WTC [2-4] using published accounts from survivors, questionnaires and focus groups. However, the main features which distinguish HEED from other projects are:
• a more open approach to data collection through the development of an interview process that attempts to extract a richness of data not previously evident in other projects;
• an attempt to understand more fully the social and organisational factors that influence evacuation activity, e.g., the influence of groups, organisational structure and perception of risk;
• an attempt to quantify crowd densities and understand how these contributed to observed behaviour and human performance;
• accessibility of the data, and full interview transcripts, through the development of an online relational database which will be accessible in the future by bona fide users.
The main aim of the HEED project is to distil, organise and present 9/11 survivor interview accounts into the HEED relational database. The objectives of project HEED are to:
• collect and collate human experiences in the WTC disaster and structure this into a database to provide an interactive research tool;
• ensure that the data collected is transformed into information that is of immediate, medium and long term use to the managers, designers, enforcement agencies and owners of medium- and high-rise buildings, the research community involved in the development of computer based evacuation models and all those interested in understanding the social process that structure emergency and related situations;
• provide easy, free and immediate access to the database for bona fide users;
• use the information collected and collated to perform preliminary analyses of the data to identify some of the key factors that influence the design and management of medium- to high-rise buildings and to test some of the social psychological models of human actions in such circumstances;
• investigate the WTC evacuation using evacuation models and using the HEED data suggest how these models could be improved.
1.1 Research Themes
The HEED study identified an extensive range of human factors research issues of relevance to fire safety engineering. These included:
• Cue recognition and response: It is important to understand the
participants’ entire experience from the time they received a cue and examining such areas as, What cues did they receive? How were they interpreted? How did they respond? Currently, engineers use arbitrary
between response times and other factors, such as proximity of incident, risk perception, group membership, etc.
• Conditions during egress: We aim to explore whether the participant
experienced any difficulties during egress (e.g. congestion)? What did it cause them to do? Did they walk or run and at what speed and why?
• Fatigue: All engineering analysis of high-rise building evacuation
currently either ignores the impact of fatigue or treats it in a crude and arbitrary manner. Was fatigue an issue in the WTC evacuation, did it exert an influence on the overall evacuation and if so, in what way? We wished to determine the extent to which participants had to stop for a rest, and if so, where, for how long, and with whom?
• Travel speeds: A very basic piece of data essential in all engineering
evacuation analysis is the travel speed of people on stairs. Obviously, if this key parameter is incorrectly represented the entire evacuation analysis becomes invalid. There is some evidence to suggest that the travel speeds in the WTC evacuation were significantly lower than those typically used in engineering analysis [2,3]. What was the speed of people on the stairs and what contributed to it? How was the travel speed related to crowd densities, population demographics, etc?
• Perception of risk: – This is an area which has been little explored in
the fire literature. This research aimed to capture participants’ level of perceived risk during their evacuation from the Twin Towers. Subsequent analysis will enable a better understanding of, for example, the relationship between response times and perceived risk and types of cues and perceived risk.
• Group formation: All engineering evacuation analysis currently
assumes that occupants evacuate as individuals. This belief is implicit in all building design. This key assumption has an important influence on the unfolding evacuation dynamic and potentially on the overall efficiency of the evacuation. We wished to determine the participant’s experiences as a member of one or more groups as they evacuated the WTC, and understand the group’s lifecycle from the participant’s perspective. How did the group form? What were the factors driving formation and dissolution? What was the nature of the group membership? How did the group operate?
• Choosing and locating an exit route: The key to understanding
movement in an emergency is to discover why people choose a particular route. Was their exit route pre-planned? Was it the closest? Familiar? Used in fire drill? What were the reasons behind some participants choosing to evacuate by the elevator?
• Merging flows and deference behaviours: In high-rise building
• Experience and training: A number of people in the 9/11 evacuation
had previous experience of evacuating the building during the earlier terrorist bomb attack of 1993. Additionally, many people had second hand experience of the 1993 evacuation through friends, family and colleagues. How did their first and second hand experience impact upon their evacuation? What training had people undergone in case of emergency situations and had they learned behaviours from this and other evacuation experiences.
• Management and organisational structure: The different ways in
which the diverse organisations marshalled and instructed their employees to leave is also explored in order to determine its implications for various engineering provisions. For example, how bureaucratic was the company the participant worked for? Did this have any impact on the nature of the participant’s emergency response? Did managers instruct their staff members to evacuate? Why or why not? Did employees inform managers of their decision to evacuate? Did their manager/superior communicate with them?
Analysis of the collected data is not yet completed. In this paper we present some preliminary analysis of data relating to the North Tower (WTC1) addressing the first five research themes. The analysis should not be considered complete and is subject to change as more data is analysed.
2
Research Protocols
This investigation focused on those persons who evacuated from WTC1 or WTC2 on 9/11. The research protocols - which received Institutional Review Board (IRB) approval from John Jay College Of Criminal Justice in New York (JJ), the New York City Department of Health and Mental Hygiene (NYC DOHMH) and Pace University - are outlined in brief below. A more detailed account may be found in [5].
2.1 Recruitment
Participants for the interviews were recruited mainly from the World Trade Center Health Registry (WTCHR), compiled by the NYC DOHMH. The WTCHR is a voluntary list of individuals who were exposed to the environmental effects of 9/11. Individuals who wished to take part in the study were invited to register on the project’s website ( www.wtc-evacuation.com), and invited to complete a web based Pre-Interview Questionnaire. In total, 3,064 invitation letters were sent via the DOHMH. A 9.3% response rate was obtained from the DOHMH mailshot and 287 people registered to take part in our study. In total 271 interviews were conducted during five extended interview periods by the researchers in New York.
2.2 Interview Structure and Content
WTC evacuation that might not previously have been considered by the researchers. The free-flow narrative was followed by a semi-structured interview, during which the interviewer confirmed and expanded upon details previously provided in the free flow and sought to ascertain more specific information regarding the participant’s entire experience relevant to the specific areas of research interest.
Throughout the interview, interviewers attempted to extract from the participant as much contextual information relating to time and location of the described experiences. For example, it was considered important to determine an estimate for the actual time (absolute) that something occurred, and the time taken for certain events to occur, e.g., waiting in line, fire fighters to pass. Interviewers also attempted to establish where the participant was when this occurred (floor level, location on floor). Where absolute times could not be determined they tried to determine the times that things were occurring relative to global time markers, e.g., time WTC2 hit, time WTC2 collapsed. This information was crucial to address specific engineering research questions related to, e.g., response times, travel speeds, etc.
To quantify participants’ experiences of crowd densities during the stair descent, computer generated animations of people descending stairs based on the classic Fruin densities (also often referred to as Level of Service or LoS) [6] were periodically administered. These animated images were introduced whenever the participant entered or exited a stairwell, and whenever they mentioned crowding on the stairs. This information, together with information on time periods where important events occurred on stairs, assists in identifying travel speeds on stairs and associated crowd densities. During the interview, participants were also asked to complete risk perception and organisational structure questionnaires. The risk perception questionnaire comprised a general question on how at risk they felt at the time (rated on a seven point scale, from 1 ‘no risk’ to 7 ‘very high risk’) and why, followed by a series of statements related to different risk attributes, identified from risk perception studies, e.g., information available, control, dread, etc., to which they had to rate their level of agreement. Participants were asked to complete the risk perception questionnaire up to four different times during their evacuation, i.e. at WTC1 impact (or when the participant noticed something unusual happening), when the participant was deciding to evacuate, when the participant knew that WTC2 had been hit (if applicable) and when the participant knew WTC2 had collapsed (if applicable). In the organisational structure questionnaire, the participant was asked to rate their level of agreement on a 5-point scale with each of 10 statements related to the how the company functioned, e.g., ‘In my job, my authority was precisely defined’; ‘In my organization, clear lines of reporting and authority were made known’.
evacuation, e.g., after the public announcements in WTC2) and exiting the WTC complex. These phases constitute a new model of evacuation behaviours and as such informed the development of the database.
3
Development of HEED Database and Coding Process
The HEED database is developed in Microsoft (MS) Access and is specifically designed to store and retrieve coded HEED WTC evacuation data from interview transcripts. The information stored in the HEED database provides a means to address key research questions relating to human factors issues associated with evacuation from high-rise buildings.
The HEED database was developed from a content analysis of a small subset of participants’ interview accounts. The content analysis indicated that participants’ evacuations comprised of a variety of complex and detailed experiences ranging from observations and interpretations of events to subsequent feelings and actions. A method was required to systematically identify, categorise and store this experience information into a logical structure for later analysis. From the content analysis, a three level Experience structure was devised in order to systematically categorise participants’ rich evacuation experiences into mutually exclusive categories. As further transcripts were analysed, new categories were developed and the three level experience structure was expanded. As part of the Experience hierarchy a large number of codes and associated code definitions were developed to uniquely categorise each experience. The Experience hierarchy served as a coding framework enabling the identification of the participants’ experiences from interview transcripts and the unambiguous and systematic categorisation of those experiences. The development of the HEED database structure was undertaken in parallel with the development of the three-level Experience hierarchy and associated Experience codes. Data within HEED is stored using the logical arrangement of the three-level Experience hierarchy. In addition to coded Experience information, the HEED database also includes the full transcripts for each interviewed participant and the pre-interview questionnaire responses. The HEED database captures all of the participants’ evacuation experiences such as stimuli (e.g., observational cues), cognitions (e.g., incident interpretations) and individual and group behaviours (e.g., actions and reactions) within the three-level Experience hierarchy. Supporting information such as the time of an experience and participant’s location are captured by associated contextual information.
In addition to coding the Level 3 Experience, ‘contextual information’ is required to clarify the detail of the experience. For example, the contextual information could be the time at which the experience occurred or an estimation of the crowd density when the experience occurred. As noted earlier, crowd density estimations are provided by the participant during the semi-structured component of the interview using a specially devised Fruin based tool. The time at which an experience occurred is represented within HEED in several ways. It can be actual or estimated times provided explicitly by the participant during the interview or a time interval estimated by the research team based on the evidence provided within the transcript.
The process used in this paper involved defining a total of 17 time sub-intervals around four known event times, namely the impact into WTC1 at 8:47am (T1), the impact into WTC2 at 9:03am (T8), the collapse of WTC2 at
9:59am (T15) and the collapse of WTC1 at 10:28am (T21). As an example
of this process, consider the time span between T1 and T8. This was divided into six sub-intervals with T4 being the sub-interval “Between T1 and T8”
i.e. 08:47 < event time < 09:03, while sub-interval T3 is “Closer to T1 than
T8” i.e. 08:47 < event time < 08:55. The process of estimating the time when an event occurred involved the analyst reading the interview transcript and from the evidence provided determining which time sub-interval best captured the event time.
Before the experience can be coded into the database it must first be identified. This is achieved by editing the interview transcripts into Behavioural Patterns (BP). BPs are chunks of transcript text which contain experience and corresponding contextual data. Once a BP is identified the relevant experience codes and contextual information relating to the experience are determined and coded into the database, along with the actual BP and its location within the transcript. A BP can have several mutually exclusive experience categories attached.
As part of the data entry, the entire edited transcript of the interview is linked to the database, as is factual information obtained from the pre-interview questionnaire. Names of people and companies are removed from all entries, being replaced with coded IDs, ensuring that the identity of the participant remains confidential. Information within the database can be retrieved by constructing and running queries using MS Access Query. However, this is only for local use and therefore a web based query builder will be developed for accessing the data remotely. This will enable a wider audience to access the information contained within HEED.
4
Preliminary Data Analysis
interviewed, 29% and 23% of the WTC1 and WTC2 population respectively had worked in the WTC towers for less than 12 months while 22% and 21% of the WTC1 and WTC2 populations respectively had experienced the 1993 bombing and evacuation.
Fig. 1. Floor distribution of survey participants
The majority of people interviewed were located in the upper third of the WTC1 and WTC2 i.e. 42% of the WTC1 sample and 57% of the WTC2 sample were located on floors above the 60th floor (see Fig. 1).
Finally, the
Body Mass Index (BMI) of the sample was also determined. The BMI is defined as the individual's body weight divided by the square of their height and is used to assess how much an individual's body weight departs from what is normal or desirable for a person of given height. For Western European and North American adults a BMI of: less than 17.5 may indicate anorexia; between 17.5 and 18.5 suggests the person is underweight; between 18.5 and 25 indicates optimal weight; between 25 and 30 suggests the person is overweight; between 30 and 40 the person is obese and over 40, the person is morbidly obese. For the WTC1 sample, 63% of the population was in the overweight/obese categories with 22% of the population in the morbidly obese category. For WTC2 population, 74% of the population was overweight/obese while 28% of the population was in the morbidly obese category. A total of 68% of the sample population were in the overweight/obese categories.
4.1 Stoppage data for WTC1
The number of times evacuees stop during their descent is an important parameter as it will impact the average travel speed of the individual. The reason why evacuees stopped is also important as it addresses issues associated with environmental conditions on the stairs and the possible contribution that the population demographic may have on occupant performance on the stairs. Several recent WTC studies [2,3] have reported lower than expected average stair travel speeds. Unfortunately, due to a lack of data in both these studies, it was not been possible to determine why the travel speeds were so low. There has been considerable discussion in the literature that the growing obesity epidemic [8] may be adversely affecting the ability of building occupants to travel large distances on stairs during
Floors 1-30
Floors 31-60
Floors 61-110 0
10 20 30 40 50 60 70 80
Frequency count
Floor location
building evacuations and may be the cause of the lower than expected average travel speeds found in these studies.
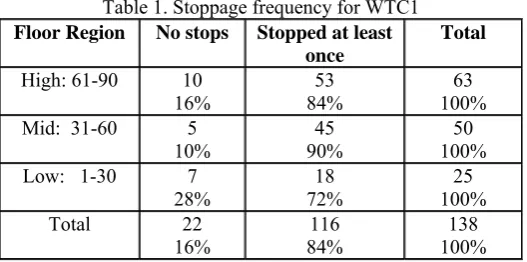
[image:10.595.167.431.383.514.2]For these reasons stoppage data was extracted from the transcripts of 124 WTC1 participants (those evacuating from above floor 2). The data suggested that 82% of the participants stopped at least once, 30% stopped once and 2.4% reported stopping more than 20 times during their descent. A total of 318 stop incidents were reported by the participants. Congestion was the most frequent cause of stoppages, being reported by 54% of the population and causing 44% of the stoppages. The next most frequent cause of stoppages were caused by ascending fire fighters (17.6% of stoppages) or descending groups of injured people (17.6% of stoppages). In these situations the participants would interrupt their descent to allow the fire fighters/injured to pass. These types of incidents were reported by 38% and 31% of the population respectively. The third most common cause of stopping was the need to take a rest, with 9.7% of the reported stoppages due to participants needing to rest. Rest stops were reported by 16% of the population. The fourth most common cause of stoppages was due to environmental conditions. A total of 3.5% of the reported stoppages were caused by environmental conditions such as debris, smoke, heat, water on the stairs, etc. This type of stoppage was reported by 9% of the population.
Table 1. Stoppage frequency for WTC1
Floor Region No stops Stopped at least
once
Total
High: 61-90 10
16% 84% 53 100% 63 Mid: 31-60 5
10% 90% 45 100% 50 Low: 1-30 7
28% 72% 18 100% 25 Total 22
16% 84% 116 100% 138
The stoppage frequency is summarised in Table 1 and includes data from 14 participants who stopped because their companion required a rest stop. We note that 70% of the sample from each of the three floor regions reported stopping at least once however, participants in the High and Mid levels are more likely to stop during descent than those in the Low levels. This information relates to stoppages of all kinds and so does not distinguish between people requiring rest stops and those that stopped due to congestion or other issues.
people located in the upper part of the building and in the Overweight/Obese BMI category. For example, consider the following statement from a participant who started their evacuation from the 73rd floor with a BMI of 27
(Overweight):
WTC1/073/0001, Page 22 L24-37
I: Did you ever get tired yourself and have to stop and rest?
P: Physically, no… I mean I encountered several people though that were experiencing difficulty getting out…..… so there were people depending on your physical age and condition and whatever that struggled… I don’t mean to make light of…
I: No, no, it’s okay.
P: That it was “a walk in the park”… but me personally, I never felt physically challenged…..
While this person started their evacuation from the upper third of the tower and was classed as “Overweight”, he did not feel the need to take a rest stop. However, this person reported stopping two times due to congestion. Clearly, when participants stop due to congestion, they were also resting. This is demonstrated by another participant who started on the 69th floor and
had a BMI of 37 (Obese):
WTC1/069/0001, Page 16 L21-27
I: Did you ever stop to have a break to have a rest?
P: Never no.
I: Nothing like that.
P: Only when I was forced, when it wasn’t moving.
I: When it wasn’t moving, yes.
P: Then I would sit on the step and I was watching and watching and someone would say okay we are moving now ….
By default, participants forced to stop due to congestion or other external reasons were also resting and recovering. This may mask the effect of BMI in causing the participants to take a rest stop. To put the need to rest into perspective it is worth noting the total travel distances associated with descending from various levels within the WTC buildings. Using Stair C as the egress route and assuming that the central route down the stairs is taken, the total travel distance from 110th floor to the 2nd floor is estimated to be
1,439m; from the 90th floor, 1,192m; from the 60th floor 755m and from the
30th floor, 345m.
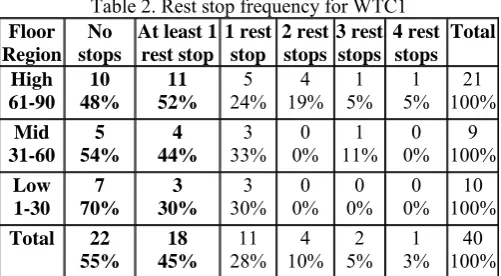
requiring a rest stop, two were classified as Obese (BMIs 38, 47) and two were Normal (BMIs 19, 22) according to their BMI. Of the 16 participants reporting companions needing to rest, 14 companions were women and 2 were men. Thus, of the 20 people requiring rest stops, 85% were female, 45% were in the Overweight/Obese categories, 45% had medical conditions and 10% were fatigued but not Overweight/Obese.
Table 2. Rest stop frequency for WTC1
Floor Region
No stops
At least 1 rest stop 1 rest stop 2 rest stops 3 rest stops 4 rest stops Total High 61-90 10 48% 11 52% 5
24% 19% 4 5% 1 5% 1 100% 21
Mid 31-60 5 54% 4 44% 3
33% 0% 0 11%1 0% 0 100% 9
Low 1-30 7 70% 3 30% 3
30% 0% 0 0% 0 0% 0 100% 10
Total 22 55% 18 45% 11 28% 4 10% 2 5% 1 3% 40 100%
A total of 16 people requiring a rest stop were not interviewed and so their BMI’s were not available. Of these 16, descriptions of six people were provided by their travelling companions (who were interviewed) from which a BMI was estimated. Overall the average BMI for the sample requiring a rest stop (30.4) is similar to average BMI of the sample who did not require a rest stop (29.5) – both bordering on Obese. In the High region (floors 61-90), those requiring rest stops had marginally larger BMI (30.0) than those not requiring rest stops (27.2) - both bordering on Obese. This information suggests that BMI does not appear to be an indicator of whether a person required a rest stop. It should be noted that 60% of the WTC1 population surveyed were in the Overweight/Obese categories and the sample size is small. However, being located high in the building is a reasonable indicator of whether or not a rest stop is required. It is suggested that rather than BMI, the overall level of fitness and the travel distance may be better predictors of whether a person requires a rest stop during a high rise evacuation.
4.2 Stair Travel Speeds
The information presented in this paper relating to stair travel speeds concerns preliminary data analysis derived from Stair C of the North Tower. This stair was 44 inches wide and so was one of the two narrow stairs in the WTC buildings. Several recent WTC studies [2,3] have reported lower than expected average stair travel speeds. The UK BDAG study [2] first reported lower than expected travel speeds derived from their sample of survivor accounts published in the public domain. Their relatively small sample of useable data suggested a mean speed of 0.24 m/s. The later NIST report [3], based on a larger sample of first hand survivor accounts suggested an even lower mean travel speed of 0.2 m/s.
flow stair travel speeds of 700 males and females of various ages, both descending and ascending stairs. For males aged 30-50 descending stairs, his data produces a mean speed of 0.88 m/s (4.2 floors/min) while for males aged over 50 his data suggest a mean speed of 0.69 m/s (3.3 floors/min) [6]. In recent correspondence between Galea, Pauls and Fruin, it was noted that the free flow stair data measured by Fruin was over only one or two flights of stairs and so does not include the potential impact of fatigue on stair travel speeds [9]. As a result, Galea suggests that this data should be used with care in high-rise building applications. Other data often quoted concerning stair travel speeds is that produced by Pauls derived from observations of high-rise building evacuation drills [10]. This data suggests a mean speed of 0.52 m/s (2.5 floors/min) in optimal flow conditions and 0.22 m/s (1.1 floors/min) in crush conditions [10]. As a reference, it is worth noting that for Stair C of the WTC a speed of 1.0 floors/min is equivalent to 0.21 m/s while 3 floors/min is equivalent to 0.62 m/s. These values were derived using 12.3 m as the average travel distance from floor to floor taking a stair and landing centre line travel path (average value derived for normal and machine floors).
Estimating the stair travel speed from participant transcripts is a difficult and time consuming process. Thus far we have restricted our analysis only to people who used Stair C and who completed their journey from start to finish on Stair C. Analysis is further restricted to individuals for which we have a reasonable estimate of when they entered the stairs and when they left the stair. This is based on the time analysis described in Section 3. An individual’s journey between the beginning and end points is reconstructed from information provided in the interview transcript, noting events such as:
• Environmental conditions encountered – where and when? • Encountering fire fighters – where, when, how long?
• Encountering injured being carried down – where, when, how long? • Encountering congestion – where, when, how long, Fruin Density?
In reconstructing segments of the journey it is often necessary to make some assumptions concerning aspects of that part of journey e.g.
• Duration of stoppage if not provided,
• Speed in floors/min based on provided Fruin density and description of movement e.g. If Fruin F estimated and participant describes very slow movement, assume approximate speed of 1 floor/min – unless other evidence provided.
Where it is not possible to make reasonable estimates of journey segments, a simple average speed is determined for the journey from beginning to end. The following extract from an account provides an example of where a travel speed is estimated for a journey segment:
WTC1/040/0001, P11 L7-12
I: And, again, you were travelling 40 seconds for each floor? A minute for each floor?
well. I remember one floor every 30 seconds because I even timed it during my descent for a couple floors so I thought ok we're doing about 2 a minute.
Another example demonstrates an estimation made by the participant of the crowd density (Fruin Density F = Orange) at floor 55, how he travelled very fast down the stairs from floor 60 to 55 and then come to a stop when encountering the Fruin F.
WTC1/060/0001 P11 L24-40
I: Okay, so that’s Orange. And so when it got congested, did you say this was because other people were coming into the stairs?
P: Yes, other people were coming in as well as already in the stairwell from whatever floor they had come from.
………
I: And how did that affect the travel speed?
P: It slowed down dramatically.
I: So, were you having to stop at any point?
P: We stopped at 55, right there, because there was obviously a lot more people. I mean we were running down for the first 5 stairs, “Boom, boom, boom, boom, boom”, two stairs at a time sometimes. When we got to 55, we couldn’t do that because we would plough into people ….
Using this type of information it is possible to construct a “Floor–Time” diagram for the participant. Such diagrams were first used by Pauls to assist in the description of the progress of evacuation drills in multi-floor buildings [11]. The diagram provides a very useful way of visualising the progressive evacuation of a high-rise building. When used forensically in reconstructing an evacuation based on first hand survivor accounts, it also provides a means of corroborating the accounts of the evacuees, checking the consistency of assumptions in reconstructing the path and filling in information gaps in the accounts of some evacuees.
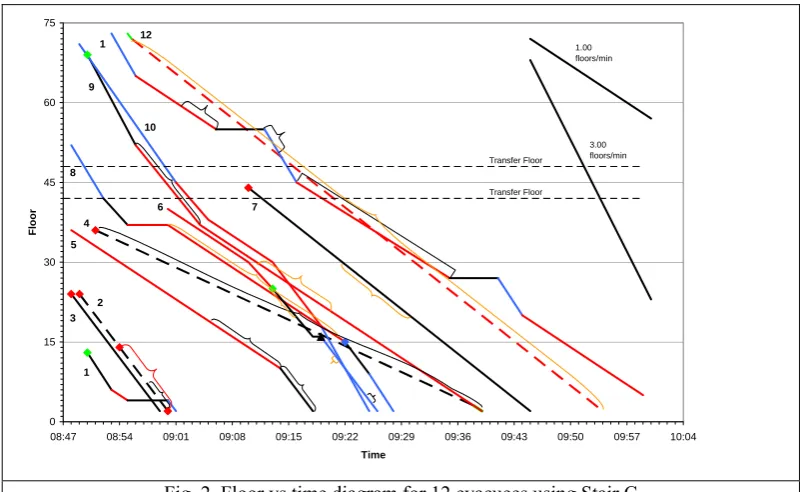
Depicted in Fig. 2 is a Floor-Time diagram for 12 evacuees who used Stair C that meet the criteria described above. The numbers on the curves indicate the participant ID, e.g. 2 refers to participant WTC1/021/0001 (BMI 18.6) who started their evacuation on the 21st floor, while 12 refers to participant
WTC1/073/0003 (BMI 33.0) who started their evacuation on the 73rd floor.
The slope of the line or line segment represents the speed of the participant in floors/min. For participant 2 we calculate an average travel speed of 2.0 floors/min while for participant 12 we calculate an average travel speed of 1.2 floors/min. These speeds can be converted to an approximate speed in m/s using the approximate 12.3 m travel distance estimate or a more accurate conversion can be derived using the actual travel distance for the floors covered, including transfer corridors, the later is used here were possible.
Fruin density was reported, Blue indicates Fruin densities of A (< 0.5 p/m2)
or B (0.5 – 0.7 p/m2), Green indicates Fruin densities of C (0.7 – 1.1 p/m2) or
D (1.1 – 1.4 p/m2) and Red indicates Fruin densities of E (1.4 – 2.5 p/m2) or F
(> 2.5 p/m2). Coloured squares indicate a spot Fruin density only at the
specified location. A dashed line indicates that there were complications along the egress route that makes the path unrepresentative of the travel speeds that one would normally expect, even for the level of congestion encountered. For example, participant 2 suffered from a serious pre-incident medical condition which made their travel speed unrepresentative while participant 4 reported stopping 10-20 times during the descent and participant 12 was reluctant to overtake the people in front of him who were carrying a disabled person down the stairs.
0 15 30 45 60 75
08:47 08:54 09:01 09:08 09:15 09:22 09:29 09:36 09:43 09:50 09:57 10:04
Time
Fl
oor
1.00 floors/min
3.00 floors/min
1 2 3
4
5
6 7
8 9
10
1 12
Transfer Floor
[image:15.595.97.500.275.521.2]Transfer Floor
Fig. 2. Floor vs time diagram for 12 evacuees using Stair C
Various types of brackets are also shown along some of the journey segments. These are used to represent the presence of factors which may impact the travel speed. A curved bracket indicates that the factor occurred somewhere in the region indicated but a precise location was not provided while a square bracket indicates that the factor persisted over the entire region indicated. The colour of the bracket also carries some significance. Gold indicates the presence of fire fighters ascending the stair which interfered with the participants downward progress, Red indicates a Fruin density of E or F and Black indicates the presence of environmental factors such as smoke, heat, dust, water or debris which impacted the progress of the participant.
travel speed for the journey from floor 13 to floor 2 is 1.0 floors/min (0.21 m/s) while for participant 11 the average travel speed from floor 73 is 1.03 floors/min (0.22m/s). Note that both these participants have periods during their journey where they have passed through high crowd density regions (Fruins E and F) and participant 11 has stopped his journey on two occasions. As can be seen from Fig. 2, when the participant passes through high crowd density regions their travel speed, measured by the slope of the line, is less than when they travel through lower crowd density regions. Using the Floor-Time diagram we thus note that at times participant travel speeds can be considerably higher than suggested by taking the simple average travel speed. Furthermore, we can also measure the impact that the stoppages reported in Section 4.1 and high crowd densities can have on the average travel speed. This may begin to explain why the early BDAG [2] and NIST [3] studies found lower than expected travel speeds.
8:47-8:53 8:53-8:59 8:59-9:05 9:05-9:11 9:11-9:17
Fig. 3. Fruin map of North Tower Stair C showing floors 25-73 in 6 minute time slices up to 9:17
bar also carries the actual Fruin density. The coloured entries that cover only a single floor represent the Fruin density estimates provided by the participants on entry into the staircase. As the time slices used in the Fruin map are of finite duration, the crowd density observation provided by the evacuee may not cover the entire duration of the imposed time slice. To reflect this, a fill pattern has been introduced that describes the portion of the time slice that the observation is valid for. A solid fill suggests that the observation is valid for the entire duration of the time slice. A hash fill indicates that the observation starts after, and ends before the time slice. Horizontal bars indicate that the observation ends before the specified time period while diagonal bars indicate that the observation starts after the beginning of the specified time period. Using this system many of the apparent conflicts in crowd density may be explained. In addition, vertical gold lines indicate the presence of fire fighters while vertical black lines indicate adverse environmental conditions were encountered.
Table 3. Travel speed information and percentage of journey subjected to various crowd densities for the 12 identified individuals who used Stair C
ID
WTC1 Graph ID BMI Unknown Fruins Low Fruins (A,B)
High Fruins
(E,F)
Original Average Speed
(m/s)
Average Adjusted Speed
(m/s) 13/0002 1 28 50% 25% 25% 0.21 0.38 21/0001 2 19 87% -- 13% 0.41 0.41 24/0001 3 26 96% -- 4% 0.41 0.41 36/0002 4 28 91% -- 3% 0.15 0.15 36/0003 5 48 23% -- 77% 0.23 0.23 40/0001 6 24 0% 38% 64% 0.30 0.31 44/0002 7 37 98% -- 2% 0.25 0.25 52/0004 8 25 10% 49% 45% 0.27 0.31 69/0001 9 37 0% 24% 75% 0.29 0.29 71/0004 10 32 0% 63% 40% 0.41 0.41 73/0001 11 28 0% 41% 68% 0.22 0.27 73/0003 12 33 96% -- 1% 0.26 0.26
was travelling behind a group carrying a disabled individual and did not wish to overtake (12), while the other person had pre-existing medical conditions which effectively meant that he had a movement related disability (4). Using this sample of 10 people produces (see Table 3) an average stair speed of 0.33 m/s which is some 65% higher than that reported by the NIST study [3]. While considerably larger than the average reported in the NIST study it is still relatively low.
Further analysis of the travel speed data presented in Table 3 reveals that those individuals with average travel speeds lower than the group mean speed experienced high crowd densities for more than 45% of their journey, with the lowest average travel speed corresponding to an individual that spent 77% of their journey in high crowd densities. While those with average travel speeds higher than the group mean travel speed spend only short parts of their journey in high crowd densities. This tends to suggest that the lower average stair speed observed for participants using Stair C may simply be due to the relatively high crowd densities encountered during their descent.
4.3 Response Times
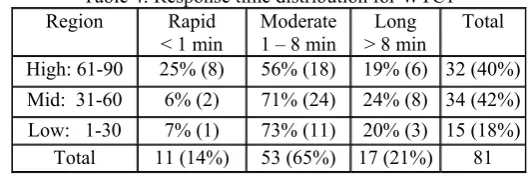
[image:18.595.163.428.484.573.2]Occupant response time data was determined from the transcripts as explained in Section 3. The response times for WTC1 evacuees were allocated into one of 10 time bands (measured in minutes from WTC1 impact) based around the four key times, namely: (0-1), (1-4), (1-8), (1-16), (8-16), (12-16), (16-21), (16-26), (16-72), (44-72). A total of 81 response times were derived from the transcripts. Due to small samples within the above time bands, data was collapsed into three broad response time groups i.e. Rapid (< 1 min), Moderate (> 1 and < 8 min) and Long (> 8 min) and the vertical spatial distribution of the building was split into three broad categories Low, Mid and High as shown in Table 4.
Table 4: Response time distribution for WTC1 Region Rapid
< 1 min
Moderate 1 – 8 min
Long > 8 min
Total
High: 61-90 25% (8) 56% (18) 19% (6) 32 (40%) Mid: 31-60 6% (2) 71% (24) 24% (8) 34 (42%) Low: 1-30 7% (1) 73% (11) 20% (3) 15 (18%)
Total 11 (14%) 53 (65%) 17 (21%) 81
commencing their evacuation. Examples include; Sought environmental information; sought information from colleagues, authority figures, etc; waited for further info; etc. Action tasks involve performing physical actions
prior to the commencing horizontal evacuation. Examples include; Collect items; searched office/floor; instructed others to evacuate; shut down computer; secured items (locked safe); changed footwear; etc.
A positive significant relationship was found between total number of tasks completed and response time τ=.38, p(two tailed) <0.01, i.e. the more tasks completed the longer the response time. In addition, almost a third (30%) of the population undertake two Action Tasks while almost half (41%) the
population undertake one Information Seeking Task. Just over a half (53%)
of the population undertake two or less tasks in total prior to starting their evacuation. The two most common Information Seeking Tasks were,
“Sought environmental information”, reported 52 times and, “Sought information from friends/colleagues”, reported 28 times out of a total of 100
Information Seeking Tasks reported by the 81 participants. The two most
common Action Tasks were, “Collect Items”, reported 36 times and
“Instructed Others to evacuate”, reported 24 times out of a total of 139
Action Tasks reported. Clearly, participants undertake a number of tasks
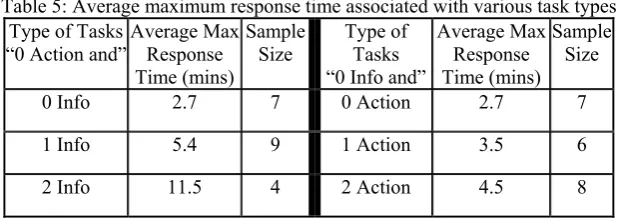
[image:19.595.143.452.441.552.2]prior to starting their evacuation. As it was not possible to determine a unique response time for each of the participants the upper end of the response time band associated with each participant was used to represent the maximum likely response time for an individual undertaking a particular set of tasks. Using this information it is possible to estimate the response times associated with undertaking those tasks (see Table 5).
Table 5: Average maximum response time associated with various task types Type of Tasks
“0 Action and”
Average Max Response Time (mins)
Sample Size
Type of Tasks “0 Info and”
Average Max Response Time (mins)
Sample Size
0 Info 2.7 7 0 Action 2.7 7
1 Info 5.4 9 1 Action 3.5 6
2 Info 11.5 4 2 Action 4.5 8
From Table 5 we note that starting the evacuation without undertaking any tasks results in the shortest average maximum response time, requiring only 2.7 mins. This is an indication of the minimum time required by an individual to start their evacuation in this type of incident. Of great interest is the result that Information Seeking Tasks appear to take between 1.5x and
2.6x longer than Action Tasks. This highlights the importance of providing
a hardened emergency communications system within high-rise buildings. It is suggested that the frequency and number of Information Seeking Tasks
could be reduced or removed completely if appropriate information could be provided to evacuees via hardened buildings communication systems. Furthermore, it is suggested that the frequency and number of Action Tasks
Finally, the perceived risk (see Section 2.2) when the participant decided to evacuate (R2) was compared with their maximum response time. This could be done for 48 participants for which we have a (R2) risk and a maximum response time. Participants with Low Perceived Risk (rating 1,2) have the highest average maximum response time of 12.4 mins (9 individuals) while those with High Perceived Risk (rating 6,7) have the shortest average maximum response time of 4.8 mins (13 individuals). Thus those who perceive a high risk respond 2.6 X faster than those who perceive a low risk.
5
Concluding Comments
The evacuation of the WTC complex represents one of the largest full-scale building evacuations in modern times. As part of the UK study into the WTC evacuation, 271 WTC survivors have been interviewed in great detail and data from these interviews have been entered into the HEED database. Preliminary analysis of data from WTC1 is shedding light on how people evacuate, the main findings of this preliminary analysis suggests:
Stoppages:
• 82% of sample stopped at least once during descent.
– 44% stopped due to congestion while 9.7% stopped to rest.
– 84% of stoppages of all kinds were incurred by those from High and Mid levels.
– 83% of rest stops were incurred by those from High and Mid levels of which: 85% female, 45% overweight+, 45% disabled, 10% fatigued.
• BMI is not a predictor of whether a person required a rest stop
Stair Travel Speeds:
• Analysis of data for Stair C suggests an average adjusting stair speed of 0.33 m/s (excluding those with disabilities or other reported reasons for travelling slow), some 65% larger than reported in earlier studies. • This average stair travel speed was negatively affected by the high levels
of congestion experienced by sampled participants. If this is taken into consideration, the stair travel speeds appear to be as expected.
• BMI is not a predictor of stair travel speed.
Response Times:
• Over half sample (65%) have moderate response times (1-8 min). • In the High Region (> 60th floor) there are sizeable numbers with Rapid
(<1 min) and Long (>8 min) response times.
• In Low and Mid regions there are sizeable numbers with Long response times.
• Just over half the sample undertake up to two tasks prior to evacuating. • Information Seeking Tasks take between 1.5x and 2.6x as long as Action
Tasks.
• Undertaking two Information Seeking Tasks can delay evacuation by as much as 11.5 min.
• Improving training could reduce evacuation delays by removing the number of Action tasks prior to evacuation.
• Those with a High Perceived Risk responded 2.6x faster than those with Low Perceived Risk.
An important observation to emerge from this preliminary study is that BMI does not appear to be a predictor of the need to rest or of stair travel speed. Indeed, stair travel speeds derived thus far appear to be consistent with older data. Further analysis is underway and will include fitness as a variable.
6
Acknowledgements
The authors are deeply indebted to the 9/11 evacuees who gave, and continue to give, so generously of their time. The authors are also indebted to the EPSRC for funding this work (grants GR/S74201/01 and EP/D507790) and to the many supporters of the HEED project without whose assistance the project would have been impossible.
References
1. “Fires and Human Behaviour” Second Edition, Editor: Canter, D. 1990, London, publisher: David Fulton.
2. E.R. Galea and S.J. Blake S.J, Collection and Analysis of Data relating to the evacuation of the Word Trade Centre Buildings on 11 September 2001, Report produced for the UK ODPM, Fire Research Technical Report 6/2005, ODPM Publications, ISBN 1851127658, Dec 2004. 3. J.D. Averill, D.S. Mileti, R.D. Peacock, E.D. Kuligowski, N. Groner, G.
Proulx, A.P. Reneke, and H.E. Nelson, "Final Report on the Collapse of the World Trade Center Towers", NIST NCSTAR 1-7, Federal Building and Fire Safety Investigation of the World Trade Center Disaster, Occupant Behaviour, Egress and Emergency Communications, Sep 2005. 4. R.R.M. Gershon, P.H.G. Hogan, K.A. Qureshi, and L. Doll, L.,
Preliminary Results from the World Trade Center Evacuation Study, MMWR, Sept 10, 2004, 53 (35), pp 815-817.
5. E.R. Galea, J. Shields, D. Canter, K. Boyce, R. Day, L. Hulse, A. Siddiqui, L. Summerfield, M. Marselle, P. Greenall, Methodologies employed in the collection, retrieval and storage of human factors information derived from first hand accounts of survivors of the WTC disaster of 11 September 2001, To Appear in Journal of Applied Fire Science, 2008.
6. J.J. Fruin, Pedestrian Planning Design, Metropolitan Association of Urban Designers and Environmental Planners Inc., 1971, New York. 7. P. Slovic, ''Perception of risk'', Science, Vol. 236, 1987, pp. 280-285. 8. J. Pauls, “Performance of Means of Egress Conducting the Research
Needed to Establish Realistic Expectations”, To appear in proceedings of SFPE 7th Int Conf on Performance Based Codes and Fire Safety Design
Methods, April 16-18, 2008, Auckland, New Zealand.
9. J. Pauls, private communication with E.R. Galea, 17 Feb 2008.
10.J. Pauls, Movement of People, in DiNenno (ed.) SFPE Handbook of Fire Protection Engineering, 2nd edition, pp3-263 to pp3-285, 1995.