STUDY OF ION MOVEMENTS IN ISOLATED CHICKEN RETINAS DURING SPREADING DEPRESSION
Thesis by
Lee-Ming Kow
In Partial Fulfillment of the Requirements
For the Degree of Doctor of Philosophy
California Institute of Technology Pasadena, California
Abstract
Spreading depression (SD) is a phenomenon observed in several sections of vertebrate central nervous system. It can occur spontane-ously or be evoked by a variety of stimuli, and consists of a wave of depression of the normal electrical activity of the nervous tissue which spreads slowly in all directions in the tissue. This wave of
depression is accompanied by several concomitants including ion
movements. All the concomitants of SD can be explained by an increase in the sodium permeability of the plasma membranes of cellular
elements involved in this phenomenon.
In the chicken retina, SD is accompanied by a transparency change which can be detected with the naked eye. The isolated retina is a thin (O.l mm) membrane in which the extracellular fluid quickly and completely equilibrates with the incubation solutions. This prepara-tion was therefore used to study the ion movements during SD by measuring and comparing the ion contents and the extracellular space
(ECS) of retinas incubated in various solutions of which some inhibited SD, whereas others allowed this phenomenon to occur.
These results are in agreement with previous postulates about SD, although the in vitro experimental condition makes the ion movements appear larger and the loss of ECS smaller than observed in the intact cortical tissue. The movements of Na and K, in opposite directions, are reversible. The development and magnitudes of SD is very little affected by deprivat~on of the oxygen supply.
Introduction
During an investigation of experimental epileptiform
after-discharges, Leao (1944a) found that a spreading wave of depression of cortical activities could be triggered either by weak electrical or slight mechanical stimulation on any region of the exposed cerebral cortex of the rabbit, except the retrosplenial area. He called this phenomenon "spreading depression" (hereinafter designated as SD). Since then SD has been extensively investigated, and has become an established phenomenon of cortical physiology. The earlier investiga-tions have been excellently reviewed by Marshall (1959) and Ochs (1962).
During SD the front of the depression wave spreads slowly (2 - 5 mm/min) from the triggered locus in all directions with little regard
for the anatomical and functional features of the cortex. The time course of SD was the same, no matter how and where it was triggered. Later, Leao and Morison (1945) found that SD could also be elicited chemically with KCl. They found furthermore that this phenomenon was independent of subcortical connections, and was not affected by a brief
the cortical surface becomes positive for 3 - 4 min. The magnitude of the negative (5 10 mV) phase is larger than that of the cortical positivity (1 - 2 mV). The characteristics of SD mentioned so far were confirmed by other investigators (Marshall, Essig and Dubroff, 1951; Van Harreveld and Stamm, 1951; and many others).
Since its first discovery by Leao, SD has been observed in the neocortex of all animals studied. Because of its ubiquitousness and the ease with which it can be evoked especially under unfavorable
experimental conditions such as dehydration (Marshall, 1950) or lowered temperature (Marshall et al., 1951), SD must have confused or masked many observations on the electrophysiology of the cortex. For example, prior to the discovery of SD, Marshall, Woolsey and Bard (1937)
observed the disappearance of cortical responses to peripheral tactile stimulation for short periods of time (1 to 5 minutes) for which no obvious explanation could be found. Many authors believed at that time that depression of the activity of certain cortical areas could be
Sloan and Jasper (1950) argued that most of the observations described as suppre~sion were actually SD, and Marshall (1950), taking SD into consideration, was unable to find any "suppressor area" in the cat's cortex. Apparently, SD has confused many electrophysiological studies on the cerebral cortex, and has to be taken into consideration and avoided whenever cortical activity is to be observed. This caution not only applies to the cerebral cortex but to several other brain structures, for SD can also be evoked in the hippocampus (Leao and Martins-Ferreira, 1958; Monakhov, Fifkova and Bures, 1962), the nucleus
caudatus (Martins-Ferreira and Leao, 1958), the corpus striatum
(Martins-Ferreira and Leao, 1958; Ookawa and Bures, 1969), the retina (Gouras, 1958; Martins-Ferreira and de Oliveira Castro, 1966), the optic lobes of chickens (Ookawa and Bures, 1969) and probably other structures. This is a troublesome side of SD for brain physiological research. On the positive side, its characteristic depressing effect has ·been used as "functional decortication" in the study of brain functions concerned with behavior (Bures and Buresova, 1960a, b; Albert, 1966; Buresov~ and Bures, 1969; etc.), and drug effects
(Bohdanecky and Necina, 1963). Spreading depression has furthermore been associated with migraine (Milner, 1958; Basser, 1969) and
Jacksonian convulsions (Sloan and Jasper, 1950) because of the similarities in the manner and velocity of propagation.
After earlier descriptive stages, SD has drawn considerable
and chemical concomitants. An increase in cortical resistivity during SD was first discovered by Leao and Martins-Ferreira (1953) and
confirmed later by many other investigators (Freygang and Landau,1955; Van Harreveld and Ochs, 1957; Ranck, 1964). These invest~gators found that SD was accompanied by a 15 to 20% increase in cortical resistivity. Even larger increases in tissue impedance were recorded during asphyxiation of the brain (Leao and Martins-Ferreira, 1953; Freygang and Landau, 1955; Van Harreveld and Ochs, 1956). After a latency of 1 - 3 min the resistance of the asphyxiated tissue may double in the ensuing 2 to 4 min. As in SD, this impedance increase was accompanied by a SPC. As will be described below, these two
~
phenomenon, SD and the asphyxial changes, have so many concomitants in common that it can be concluded that they are caused by very similar mechanisms.
(1)
Cole showed that the volume percentage of the sea urchin eggs could be computed with Maxwell's equation (equation 1) assuming that the eggs had an infinite resistance. The equation can then be simplified as:
p
2 (2)
making it possible to compute the volume percentage of cells from the specific resistance of the suspension and the suspending medium.
The assumption that marine eggs can be considered to have an infinite resistance needs some explanations. Cole (1928) modified
another equation of Maxwell's for the specific resistance of a spherical body with a core resistance (r3) and a radius A surrounded by a shell of a resistance (r4) (expressed in ohm/cm2). The specific resistance of the entire spherical body (R) can be computed with the following equation.
(3)
This equation shows that the resistance of such a particle is dependent not only on the resistance of the core and of the shell but also is inversely proportional to the radius of the particle. Since marine eggs are small (a radius of 36 µ, Shapiro, 1935) their resistance is high (27,900 ohm/cm, Van Harreveld, 1966) even though the resistance of the cell membrane (shell) is not particularly high (about 100 ohm/cm2,
20 ohm/cm, the assumption of an infinite resistance of the eggs does not seem unreasonable.
Like cell suspensions, tissues including those of the central nervous system consist of extracellular fluid as suspension medium, and cells surrounded by cell membranes which impede ion movements and thus have a high resistance. The size of the cellular elements in the central nervous tissue are in general very small, giving them a high specific resistance, whereas the extracellular fluid probably does not have a specific resistance much higher than that of plasma or cerebrospinal fluid (CSF). The measuring current in a tissue is therefore mainly carried by extracellular electrolytes. Large losses in tissue resistance, as occur during SD and asphyxiation, can therefore be explained by a loss of extracellular electrolytes.
Central nervous tissue is abundantly vascularized, containing numerous vessels filled with blood which can be regarded as part of
for a brief period (Van Harreveld and Stamm, 1952) and a decrease in blood flow (Sonnenschein and Walker, 1956) have occasionally been observed. The vasoconstriction and the drop in blood flow will decrease the volume of the well conducting blood in the vessels and
can therefore be expected to result in an increase in the tissue impedance. However, the drop in blood flow does not always occur during SD, and therefore cannot account for the very consistent
impedance increase during this phenomenon. Furthermore, the duration of the initial vasoconstriction during SD is of too short to account for the impedance increase (Van Harreveld and Ochs, 1957). Finally, the blood in the cortical vessels contributes only about 5% to the
conductivity of the cortex (Van Harreveld and Ochs, 1956), and its volume change is therefore too small to cause the 15 - 20% loss in conductivity observed during SD. The vasodilation, which was more often observed during SD, on the other hand would cause a decrease in
tissue resistance, and is apparently masked by the impedance increase caused by another mechanism.
Since a change in the vascular system cannot account for large
impedance increases, a loss of extracellular electrolytes seemed to be the most likely mechanism underlying the impedance changes observed during SD and asphyxiation. The predominant extracellular electrolyte
is NaCl. In order to account for the pronounced and rather rapid impedance increase, a large part of the extracellular NaCl would have
the intracellular space
(res)
where the electrolytes are surrounded by cell membranes, or by removal by the circulatory system. Betweenthe extracellular fluid and the blood in the cerebral circulatory system there is a blood-brain barrier, which impedes the movement of the electrolytes, as well as many other compounds, into and out of the brain. Because of the presence of this barrier it is unlikely that a large part of the extracellular NaCl can be removed by the circulatory system in a short period of time. Besides, such a removal of extracellular NaCl would have to be accompanied by a water movement to maintain osmotic equilibrium, and therefore by a loss of tissue
volume. No evidence for such a volume decrease during SD or asphyxiation has been found. The possibility that the loss of tissue conductivity is not due to the loss of extracellular electrolytes but to the
immobilization of ions has been considered. However, it is difficult to conceive of a mechanism which could account for a sudden immobili-zation of a large amount of extracellular NaCl (Van Harreveld and Ochs, 1956). As the most likely mechanism for the observed impedance
increases during SD and asphyxiation there rests a movement of extra-cellular NaCl into the
res.
A movement of extracellular Cl into the
res
during SD orCl was concentrated in apical dendrites. The retrosplenial area, which, as mentioned earlier, is not invaded by SD, did not show the
Cl accumulation in apical dendrites. The uneven Cl distribution was more pronounced in the asphyxiated cortex than in that invaded by SD.
Apparently, the movements of extracellular Cl into the ICS of the neuronal elements is a concomitant of SD, as well as of asphyxiation. Such a loss of extracellular electrolytes to the ICS is in agreement with the observed increase in tissue impedance during asphyxiation
and SD, and must be accompanied by a movement of water into the tissue
elements involved to maintain osmotic equilibrium.
Freeze substitution, which can preserve the water distribution of central nervous tissue better than chemical fixation methods, was used by Van Harreveld (1957, 1958) to detect changes in the size of apical dendrites in the cerebral cortex during asphyxiation and SD. The diameters of these dendrites were compared in cortices frozen
while SD was in progress and in control cortices not invaded by SD. In the same way asphyxiated and normal, oxygenated cortices were compared. It was found (Van Harreveld, 1957) that the impedance
increase caused by circulatory arrest was accompanied by an appreciable
increase in the diameter of the apical dendrites. A similar increase was demonstrated during SD (Van Harreveld, 1958), although the increase
is less than that caused by asphyxiation. The increase in diameter of apical dendrites was well correlated with the time course of SD.
increase, as the index of SD, was recorded, and became smaller as
the cortex was recovering from SD.
The diameter, and hence the volume increase of neuronal elements strongly supports the postulate that during SD and asphyxiation a shift
of extracellular material into the ICS occurs. This was further supported by an electron micrographic investigation by Van Harreveld and Khattab (1967). Again using freeze substitution to preserve the electrolytes and water distribution in central nervous tissue they
found in electron micrographs of cortices frozen during SD (as indicated by the presence of a SPC) less ECS than in those of normal control
tissue. A swelling of cellular elements, mostly dendritic structures, in the cortex invaded by SD was also found. Furthermore, restoration of the original water distribution was demonstrated as the cortex recovered from SD. These observations provided further evidence that
SD is accompanied by a transport of extracellular material into cellular elements resulting in an increase in the ICS at the expense of the ECS, and that the transport and the reciprocal volume changes are reversible. A similar loss of ECS and swelling of tissue elements was found to occur during asphyxiation (Van Harreveld, Crowell and
Malhotra, 1965; Van Harreveld and Malhotra, 1967).
The demonstated uneven distribution of Cl and the reciprocal
volume changes in the ICS and the ECS during SD and asphyxiation suggest that during these phenomena there is a shift of extracellular NaCl
properties of nervous tissue elements. In the resting state the
-
+
cell membrane of nervous tissue is permeable to Cl and K • The
latter ion is abundantly present in the ICS and hence is the dominant
intracellular cation. Experiments with labelled sodium have shown
+
that the resting membrane is also permeable for Na . The permeability
is low, however, so that in the resting state only a small amount of
+
+
extracellular Na can diffuse into the ICS. These Na are rapidly
transported back into the ECS by an active ion transport system or
ion pump. In this way the intracellular Na+ concentration is kept low,
even though the extracellular concentration is high and the membrane
+
is actually permeable for Na • Therefore, functionally, the resting
cell membrane is impermeable for Na+. The cell membrane, both in the
resting and the excited states, is considered impermeable for large
intracellular organic anions, such as proteins.
The resting central nervous tissue can therefore be considered
as consisting of two compartments, the ICS and the ECS, separated by
+
a membrane permeable for K and Cl but impermeable for the
intra-+
cellular organic anions and Na , most of which is present in ECS.
Under these conditions, the impermeable intracellular anions cannot
exchange with the permeable extracellular anion, Cl-, and the
+
impermeable. extracellular Na cannot exchange with the permeable cation, K+, in the ICS. Due to the concentration gradients, the K+
tend to diffuse into the ECS, and Cl into the ICS. Since ions are
,
·-potential difference across the membrane which counteracts the tendency
of the ions to move along the concentration gradients. Finally the
two counteracting factors, the membrane potential and the diffusional
forces, will reach an equilibrium at which there is no net ion movement.
Because there are two species of impermeable ions, this situation has
been called a "double Donnan" equilibrium. The potential difference
across the membrane at this equilibrium, E, can be expressed as
E RT ln
F (4)
where R represents the universal gas constant; T the absolute
tempera-+ +
ture; F the Farady constant; [K ]
1 and [K ]E the intracellular and
extracellular K+ concentrations, respectively, and [Cl-]
1 and [Cl-]E
the intracellular and extracellular Cl- concentrations. This membrane
potential, as mentioned before, counteracts the diffusion due to the
concentration gradients of intracellular K+ into the ECS and of
extracellular Cl into the ICS and favors the movements of cations from
the ECS into the ICS. However, in the central nervous tissue there
is no true equilibrium, because the ion distribution depends on the
+
ion pump to transport Na that diffused into the ICS back to the ECS.
Since the Na+ concentration is higher in the ECS than in the ICS,
and the resting membrane potential favors the inward movement of
+
cations, the ion pump has to transport Na against both the electrical
and the chemical gradients, and hence needs energy.
movements will occur when during SD or asphyxiation the membrane permeability for Na+ is increased beyond the ability of the ion pwnp
to return this cation back to the ECS or the sodium pump is arrested, for instance, by depriving it of the necessary energy. The increase in Na permeability creates a situation studied by Donnan in which two compartments containing different electrolytes are separated by a membrane which is impermeable for one of the ion species contained in one of the compartments. In the present case the membrane becomes permeable for K+, Cl and Na+ but would remain impermeable for the intracellular anions. Donnan showed that under such conditions an equilibrium is reached when the products of the concentrations of the anions and cations which can pass through the membrane are equal in the two compartments. Since one of the compartments contained originally only one permeating ion species this can be achieved only by the diffusion of an equivalent amount of cations and anions into
this compartment. This results in an increase in osmotic pressure in this compartment which in Donnan's case was balanced by a hydro-static pressure difference between the compartments. Since the development of a significant pressure gradient between the ECS and the ICS in a tissue is impossible, the expected inflow of NaCl into the intracellular compartment will have to be accompanied by a movement of water in the same direction.
demonstrated with a histochemical method for this ion. The loss of extracellular NaCl explains the impedance increase, and the shift of water into the ICS accounts for the swelling of certain cellular
elements during SD. The increase in membrane permeability for Na+ and the inward shift of this ion will depolarize the resting membrane potential. Depolarization of cellular elements has indeed been demonstrated in intracellular records made during SD (Morlock, Mori and Ward, 1964; Brozek, 1966; Collewijn and Van Harreveld, 1966; Karahasi and Goldring, 1966) . The depolarization was always marked, sometimes almost complete. It developed quickly at the beginning of SD and the membrane potential returned to the resting level slowly during the recovery of the tissue. This depolarization may explain SPC observed during SD and asphyxiation.
The normal membrane potential prevents K ions from moving from the ICS into the ECS. Potassium will therefore tend to move outward
+
as the depolarization develops and to exchange for extracellular Na . A release of intracellular K+ during SD can therefore be expected.By postulating an increase of the Na+ permeability of plasma membranes, all the concomitants of the SD described above can be explained. As mentioned above the increase in Na+ permeability may
+
be a consequence of an arrest of the Na pump. However, the resting membrane Na+ permeability, which is counteracted by the pump, is low
+
SD is caused by a substantial increase in Na+ permeability of the cell membrane leading to an inward Na shift.
d .+ d f db
The expecte K release uring SD was irst postulate y Grafstein (1956). She found that the invasion of the cortex by SD was preceded by a burst of neuronal activity. Such an intensive neuronal activity would cause a release of intracellular K+ from the cellular elements involved in SD into the ECS. An accumulation of K+ in the ECS would then cause the depolarization of adjacent cells and fibers resulting again in intensive neuronal activity and release
+
of more K , which in turn would depolarize more distant elements, and so on. This chain-reaction of intensive neuronal activity and K+ release was hypothesized by Grafstein (1956) as the mechanism underlying the propagation of SD.
According to Grafstein's hypothesis an amount of intracellular K+ sufficient to depolarize tissue elements has to be released into the ECS during SD. Evidence for such a release has been found independently by two groups of investigators using very similar methods. Brinley, Kandel and Marshall (1960b) washed the surface of the cerebral cortex, which had previously been charged with radio-active 42K, with Ringer's solution, and assayed the amount of 42K
in the washings before, during and after SD. The other group (Krivanek and Bures, 1960) did not use labelled potassium for this purpose. They washed the cortical surface with a potassium-free solution and measured
found that intracellular K+ was released from the depressed cortex in
an amount that seemed sufficient to trigger SD. This evidence, which
supported Grafstein's hypothesis, is also compatible with the Na+
shift postulated above.
Grafstein's hypothesis about the propagation of SD was adequate
before the shift of extracellular material into the ICS during SD
was observed. As discussed above this shift can be explained by an
increase in Na+ permeability of the cell membrane. Grafstein's
hypothesis does not account for such a permeability change.
There is, however, in the central nervous system a compound which
has been shown to cause a marked increase in membrane permeability.
This compound is the dicarboxylic amino acid, glutamate. Glutamate
is present in considerable quantities in brain tissue (10 mM/kg w.t.,
Schwerin, Bessman and Waelsch, 1950; Berl and Waelsch, 1958) and has
been shown to cause firing of nerve cells by depolarizing cell membranes
(Curtis, Phillis and Watkins, 1960). This depolarization is due to
an increase in ion permeability of the membrane. The release of this
amino acid into the ECS could explain not only the firing of tissue
elements which, as proposed by Grafstein, would be involved in the
propagation of SD but also all the concomitants of SD mentioned above.
The postulate that propagation of SD is due to a release of
glutamate from the ICS is supported by a number of observations. It
has been found that glutamate, like potassium, can elicit cortical
SD when applied topically to the rabbit's cerebral cortex (Van
than potassium; the threshold concentration of the former is much lower (15 mM) than that of potassium (110 mM).
Glutamate added to the solution superfusing the isolated chicken retina elicits SD (Van Harreveld and Fifkova, 1970). The threshold concentration is quite low, 0.2 mM. In the isolated chicken retina charged with 14C-glutamate, the label is released from the tissue during SD, elicited either electrically or chemically with KCl or with unlabelled glutamate (Van Harreveld and Fifkova, 1970). Since
the threshold concentration of glutamate for SD is low, and it is present in considerable amounts in central nervous tissue, the amount of glutamate released from the SD invaded tissue could well be sufficient to affect adjacent tissue causing further depression and glutamate
release, and so the propagation of SD.
+
Glutamate causes furthermore, an uptake of Na by the isolated mammalian retina (Ames, 1956; Ames, Tsukada and Nesbett, 1967) and by brain slices (Bourke and Tower, 1966a, b; Harvey and Mcllwain, 1968; Okamoto and Quastel, 1970a, b; Pull, Mcllwain and Ramsay, 1970).
All these findings not only suggest that glutamate release is the mechanism underlying the propagation of SD, as proposed by Van
Harreveld (1959), but also that glutamate does so by causing an increase in ion permeability of the cell membrane resulting in an inward shift of extracellular NaCl.
a shift has yet been provided, although an unsuccessful attempt to
demonstrate a Na+ shift during SD has been made by Krivanek and
Bure~
(1960). Since shifts of ions between intracortical compartments donot change the overall ion concentrations of the tissue, the Na+
shift in the cortex can only be detected by determining the Na+
distribution between the res and the EeS. For an easily diffusable
+
ion, such as Na , such a distribution is difficult to demonstrate. To overcome this difficulty, one has to use a sample of central nervous tissue in which SD can be elicited and in which a change in Na+
distribution between the EeS and the res can be more easily determined. Fortunately, such a nervous tissue, the retina, is available.
Spreading depression in the retina was, according to Marshall
(1959), first noticed in the frog by Hartline. The first more extensive study of the retinal SD was made by Gouras (1958). He
demonstrated in the excised toad retina a phenomenon resembling cortical SD in almost every respect. Retinal SD often occurred spontaneously,
but could be triggered by the same stimuli that evoked cortical SD.
The electroretinogram and the activity of the ganglion cells were both depressed, the wave of depression spread in all directions, and a typical SPe was present, although of smaller amplitude than in the cortex. In addition to all these events observed both in cortex and retina, there is a change in tissue appearance accompanying retinal SD.
This change is due to an increase in transparency of the tissue, which
useful for the study of SD. Similar phenomena, inlcuding the change in transparency were also observed in the isolated retina of chickens, pigeons and lizards (Martins-Ferreira and de Oliveira Castro, 1966).
The retina can be regarded as a sample of central nervous tissue, and the observations and analytical results obtained from it can be considered to represent those of gray matter. The retina has some special advantages for the electrolyte analysis of the tissue. First, it can be isolated quickly without mechanical damage, which might cause a profound alteration in ion distribution. The retina can be kept in almost normal physiological condition for at least one hour in suitable solutions (Ames and Nesbett, 1966). Secondly, it is very thin (about 0.1 mm) and is not separated from the bathing fluid by diffusion barriers; therefore its extracellular contents can readily exchange with the solutes in the bathing solution. Because of this easy exchange its ECS can be labelled with extracellular markers, or its extracellular fluid (ECF) can be replaced by ion-free
solution. Furthermore since the ECS exchanges readily with the bathing solution, shift of electrolytes between the ECS and ICS can 'be expected to result ~n overall changes of the electrolyte content
of the retinal tissue. Finally the retina is, unlike cortical slices, tough enough to be handled as an integrated tissue.
MATERIALS AND METHODS
Materials
Domestic chickens were narcotized with ether, the eyeballs were quickly excised and immersed in artificial chicken cerebrospinal fluid containing magnesium (Mg-CSF; see Solutions). The eyeballs were cut along the equator, and the anterior hemisphere together with most of the vitreous body were removed. The posterior part of the eyeball, which contains most of the retina was bathed in Mg-CSF. The remaining bits of vitreous body were carefully removed. In order to isolate the retina quickly at the end of the experiment the retina was completely and carefully separated from the underlying pigment epithelium by jets of the bathing fluid. The retina so prepared was still attached to the sclera through the pecten and the optic nerve, and lay upon the pigment epithelium, which served as a dark background making the detection of transparency changes possible. Gouras (1958) reported that in the toad once the retina was separated from the pigment epithelium no color change could be observed during SD. In the chicken retina, at least, this is not true (Martins-Ferreira and de Oliveira Castro, 1966; Van Harreveld and Fifkova, 1970; and the present study),
Solutions
Several solutions based on the composition of adult chicken CSF reported by Anderson and Hazelwood (1969) were used. They were designated as Mg-CSF, MA-CSF, Mg-Li-CSF, and MA-Li-CSF, and their compositions are listed in Table I. In the Mg-CSF 15 mM of NaCl were replaced by 10 mM of MgC1 2. The MgC1 2 was added to prevent SD since Mg salts are, according to Bures (1960), the most effective in this respect. The concentration used (10 mM) was sufficient to suppress both spontaneous and evoked SD. In the MA-CSF the 10 mM MgC1 2 of the Mg-CSF was replaced by methylamine hydrochloride
(CH3NH2.HCl) or sucrose. The concentration of these compounds was adjusted to keep the molarity and Na concentration of all solutions the same. Since MA-CSF hardly contains any magnesium, this solution will allow the development of SD. Both methylamine hydrochloride and sucrose are known to remain extracellularily, and hence not to
compete with Na+ in the ion movement during SD. No difference was observed by using sucrose or methylamine hydrochloride solutions. The lithium solutions, Mg-Li-CSF and MA-Li-CSF were made by substituting all the sodium in Mg-CSF and MA-CSF, respectively, with lithium.
Table I
Composition of the incubation and washing solutions. The concentration of the constituents is given as mM/l.
Solutions Mg-CSF MA-CSF Mg-Li-CSF MA-Li-CSF Ringer's Sucrose
Sucrose 318
KCl 4 4 3 3 4
CaCl2 1 1 1 1 E) .-5
1
.
MgS0 4 0.5 0.5 0.5 0.5 -10 0 t;
Glucose 10 10 10 10
NaCl 123 123
NaHCO 3 20 20
NaH 2P0 4 1 1
MgC12 10 10
CH3NH 2-Hcl 10
(or sucrose)
Choline-Cl 10
Li Cl lll.5 lll.5
Li 2C03 (+HCl) 15.0 15.0
Li OH 2.5 2.5
The aeration stirred the solution gently and continuously, and hence
also served as a means to facilitate the diffusion between the solution
and the ECS of the incubated retina. The pH of the solutions was
adjusted to 7.55 ± 0.1 with small amounts of isotonic NaH2P04or NaHC03
just before each experiment.
In most of the experiments labelled inulin (inulin-carboxyl- 14
c,
New England Nuclear) was used as an extracellular marker. A stock
solution of inulin was prepared by dissolving 25 µC of inulin in 5 ml
MA-CSF. A small amount of this stock solution (0.1 ml) was mixed with
the bathing solution (20 ml) just prior to the experiment, imparting
a radioactivity of about 2,000 cpm/5 µl to this solution.
An isotonic Ringer's sucrose solution and an isotonic Tris base
solution were used to wash the retinas after incubation. The Ringer's
sucrose solution contained the same concentration of KCl, CaCl2, MgS04,
and glucose as the other solutions. The lacking constituents were
made up with sucrose (see Table I). This solution was used to remove
NaCl from the ECS of the retinas in some experiments. It was used
instead of a plain isotonic sucrose solution because it seems to
preserve the ion distributions of nervous tissues better (Nicholls and
Kuffler, 1965, and the present observation). The isotonic Tris base
solution, which contains solely Tris base (340 mm) was used to
remove the bathing solution adhering to the surface of the retina.
Both isotonic solutions were cooled to 2 - 3°C with ice during the
Methods
After having been prepared as described above, the retinas were washed with fresh Mg-CSF to remove the vitreous fluid and the blood that might still adhere to the preparation. Then they were transferred to another tray of Mg-CSF containing radioactive inulin and bathed in this solution for at least 25 minutes. This period of time is
sufficient to allow the retina to recover from the traumatic effect of its preparation and from SD which might have been evoked in the process. This period also is long enough to reach an equilibrium between the inulin concentrations in the ECS and in the bathing fluid.
This initial incubation period kept the retinas in a uniform resting
state, and hence served as a common starting point in all the experiments.
At the end of the initial incubation period the retinas serving as controls were kept in the Mg-CSF. The experimental retinas were transferred to other solutions designed for the specific experimental purpose. In the experiments in which inulin was used the concentrations of this marker was made the same in all the solutions used for the
control and experimental retinas. Routinely, the experimental and control experiments were paired, i.e., one retina of the chicken was used for the experiment while the other was used as control. The
retinas were carefully observed throughout the incubation and experimen-tal periods to detect changes in transparency, which served as an
incubation solution and washed.
In the earlier experiments two different processes of washing
were employed. In one the retina was first washed with three changes of cold Ringer's sucrose solution for a total of 3 min. to remove the extracellular Na, and then rinsed briefly (about 3 sec.) in cold Tris base solution. The retina so washed was assumed to contain only intracellular sodium. This process will be referred to as the W-type washing. In the other type of washing the retina was not bathed in
the sucrose solution but rinsed only with the Tris base solution (N-type washing). Such a retina would contain both the intracellular and extracellular sodium. The difference in Na+ concentration of these retinas would be a measure of the extracellular sodium from which the extracellular Na space could be computed. Labelled inulin was used as an extracellular marker for an alternate determination of
the ECS. These retinas were subjected to the N-type washing.
After the brief washing in the Tris base solution each retina was quickly blotted on a clean sheet of aluminum foil to remove the excess fluid, and at the same time the attached optic nerve or pecten was removed. The wet retina was then placed on a small piece of aluminum foil of known weight and immediately weighed. The dry weight of the retina was obtained by weighing the retina dried overnight in a 110°C oven. From these data the water content of the retina could be
to 15 minutes.
Measurements of the radioactivity and of the ion contents
The volume of each digested retina was made up with distilled water to 1 ml. To measure the radioactivity of the retinas treated with labelled inulin, two 100-µl samples from the digest of such retinas were taken and deposited on two circles of glass fiber filter paper
(Whatman, GF/A, 2.4 cm). To detect background activity, two samples were also taken from the digests of retinas not treated with labelled inulin. The radioactivities of the solutions bathing the control and the experimental retinas were also measured. Two 5-µl samples of each bathing solution were taken at the end of each experiment and deposited on two circles of the filter paper. Two blank samples of the inulin-free solution were similarly prepared. Each of the filter papers carrying the samples was dried completely (for more than six hours) in a 60°C oven and then inunersed in 10 ml of sciltillation liquid
(toluene plus PPO plus POPOP) contained in a glass scintillation counting vial. The radioactivity was counted with a Beckman LS-230 liquid scintillation counter for 10 minutes. The background activities
for both blank retina and bathing solution samples were about the same (between 45 and 50 cpm/sample). The radioactivity of the bathing solutions containing labelled inulin, as mentioned before, was about 2,000 cpm/5 µl. That of the retinas treated with labelled inulin
To measure the ion contents, the retina digests were further
diluted with distilled water. When lithium was not used, the digests
were diluted 20 times. The concentrations of sodium and potassium in
these diluted digests were measured with a flame spectrophotometer
(Beckman Model DU) by comparison with a set of standard solutions.
Since the retina digests contain both sodium and potassium which may
interfere with each other in the measurement, the standard solutions
were made up with both sodium and potassium salts at a ratio close to
that in the retina digest.
When lithium was used, the concentration of lithium, in addition
to sodium and potassium, was measured. The method described above
was used with the following modifications. The retina digests were
less diluted. Since the digests now contained lithium in addition to
sodium and potassium, the standard solutions were made up with the
chloride salts of all the three elements in the proper ratio. The
ion contents of the bathing solutions were also measured. The concen
-tration of potassium was measured at a wave length of 770 mµ, that
of sodium at 589 mµ, and of lithium at 670.8 mµ.
Calculations and presentation of results
The results presented in the following section were calculated
from the raw data obtained from the various measurements. In making
these calculations it was assumed that the retina is a tissue made up
of two compartments, the ECS and the ICS, and that the electrolytes
The water content of the retina was expressed as mg water per mg
dry tissue (d.t.). Since the difference between the wet weight and
the dry weight of a retina represents the amount of water contained
in the tissue, the water content can be calculated as,
Water Content (mg H20/Mg d.t.)
Wet weight of retina(mg)-Dry weight of retina(mg)
Dry weight of retina(mg) (5)
The contents of Na, K and Li were calculated by dividing the amount
of each cation contained in the retina by the wet weight of the tissue,
and were expressed as mM of each ion per kg of the wet tissue (w.t.).
The raw data give the concentrations expressed as mM of the ion per
liter of the retina digest. The ion contents can thus be computed with
the following equation,
Ion Content (rnM/kg w.t.)
Ion mM/l x Total volume of the retina di~est (ml) x 10-3
Wet weight of retina (mg) x
10-(6)
As mentioned earlier in this section, the Na contents determined
in the retina after N-type washing, (Na)N, and that after W-type
washing, (Na)W, may represent the total and the intracellular Na
contents of the tissue, respectively. The extracellular Na content
is therefore given by the difference between the (Na)N and the (Na)W.
Assuming that the Na concentrations in the ECF and the bathing solutions
are the same, the extracellular Na space, which is expressed as the
as follows,
Extracellular Na space
(%)
(Na)N - (Na)W[NaJB.S. x 100
(7)
where INaJB.S. represent the Na concentration in the bathing solution.
The inulin space is also used as a measure of the extracellular
space. It was assumed that the radioactivities per unit volume (or the
concentration of the labelled inulin) in the extracellular fluid and
in the bathing solution are the same. With this assumption, the volume
of the space in the retina occupied by inulin can be obtained by
dividing the radioactivity of the retina (RR) by the radioactivity per
unit volume of the bathing solution (RBS). The inulin space can
therefore be expressed as,
Inulin space (%) RBS RR x 100 (8)
The RR is in the unit of cpm/kg w.t., and the RBS in cpm/l. Since the
background activity (BA) has to be substracted, and each of the two
retina samples used for the radioactivity measurement is one tenth
the total retina digest, the RR can be expressed as,
RR ( cpm/kg w. t. )
(Mean radioactivity per retina sample - BA) x 10
Wet weight of retina (mg) x 10-6 (9)
Similarly, the RBS, which is measured in 5 µl samples, can be expressed
as,
RBS (cpm/l) Mean radioactivity per sample - BA
Since it was assumed that the concentrations of each ion in the ECF and the bathing solution are the same, the extracellular ion contents of the retina treated with labelled inulin can be computed
from the known ion concentrations in the bathing solution, [Ion]BS'
and the calculated inulin space (%) in the following way,
Extracellular ion content (rnM/kg w.t.) [ Ion]BS x Inulin space 100
(11) and therefore, in such retinas, the,
Intracellular ion content (rnM/kg w.t.) (Ion)N - Extracellular ion content
where (Ion)N is the total content of the ion in the retina.
(12)
In the following section, the results (except that in Table III and IV) are presented as means with their standard deviations. The number of data used to calculate the mean is presented within
Results
Measurements of the extracellular space and of the ion contents in
the resting retina
As described above, the retina, after its preparation, was immersed
for a period of more than 25 minutes in Mg-CSF which prevents the
development of SD. Since the immersion period was considered to be
long enough to allow the tissue to recover from the adverse effect
of the dissection and from SD that might have been elicited, retinas
at the end of this period can be expected to be in the resting state.
Data obtained from such retinas served as a basis for the changes
that might occur during or after the SD. One of the two retinas of
a chicken was, after the immersion period, treated with N- and the
other with the W-type washing procedure. In this way the data
obtained from 13 pairs of retinas were used to estimate both the extra
-cellular sodium -and the inulin spaces. Other retinas were analyzed
following the N-type washing. The results of the measurements were
listed in Table II.
Table II shows that the mean total K content measured in the
retinas after N-type washing was significantly larger than that after
W-type washing. This was true for every one of the thirteen pairs of
retinas, in which each retina of the pair was washed differently. The
difference between each pair of retinas was larger than 10 mM/kg w.t.,
in eleven of the thirteen pairs, and were 1.5 and 5.2 mM/kg w.t., in
Table II
Results of the measurements from resting retinas
Water Total K Total Calculated Extracellular Inulin
Content Content Na Content Intracellular Na Space
Na Content SE ace
* *
N
w
Nw
Mg H20/mg d.t. mM/kg w. t. % %
4.563 64.1 51. 2 37.0 12.3 17. 5 15.2 13.4
±.140 ±4.4 ±3.4 ±3.4 ±2.5 ±3.4 ±2.2 ±1. 6
(18) (20) (13) (20) (13) (15) (13) (15)
Tun 12. 9 5.2 1. 8
p <0.01 <0.01 <0.05
*In this and the latter tables, N and W denote the data obtained from the retinas after N- or W-type washing, respectively.
the retina (about 0.6 mM/kg w.t.) is smaller than any of these differences, the latter must be a result of the loss of the intra-cellular K from the tissue. Because the retinas of each pair were treated in exactly the same way, except that the one with lower K content was washed with the Ringer's sucrose solution (W-type washing), it is apparent that the loss of intracellular K takes place during the application of this solution. Thus, in spite of the addition of the Ringer's salts (except for Na) and glucose the washing with the Ringer's sucrose solution still causes the retina to lose intracellular K.
There is also a difference between the values of the inulin and the extracellular Na spaces. The latter was always larger than the former in each pair of retinas. As described above, the extracellular
Na space was calculated from the difference between the Na contents measured in the retinas after N- and W-type washings. The Na content
after the W-type washing would represent the intracellular sodium. The washing with Ringer's sucrose solution may cause a loss of intra-cellular Na as was observed for K. Such a loss may cause an erroneously high estimate of the amount of the extracellular Na, and hence of the
extracellular Na space. The larger ECS estimated as the extracellular
Na space as compared with the inulin space is therefore probably due to the loss of intracel lular Na during the Ringer's sucrose washing. This was also found in the experiments involving SD that will be described below. In view of these findings, it seems that the inulin space is a better estimate for the ECS than the Na space.
intracellular Na content of the retina can be calculated with equation (12). The intracellular Na content calculated in this way is
significantly larger than that measured directly in the retina after
W-type washing (see Table II). If the inulin space gives a correct estimate of the ECS, then the washing with Ringer's sucrose solution
would cause a loss of about 5 mM/kg w.t., of intracellular Na from the retina.
Experiment on rabbit retinas
The ECS of the rabbit retina has been estimated by Ames and his
coworkers (Ames and Hastings, 1956; Ames and Nesbett, 1966). They used methods very similar to those described in the present study for the chicken, but found that the ECS of the rabbit retina was about
30% of the total tissue space (see Table III). This figure is much larger than that of the chicken retina (about 13 - 15%) found in the present study. The large discrepancy may be due to a species difference
or to differences in the experimental procedure, or both. In order to decide between these possibilities, experiments were carried out on two pairs of rabbit retinas using the methods described in the present study, except that artificial rabbit CSF, instead of chicken CSF was used, and the experiments were performed at the body temperature of
rabbits (38°C) instead of room temperature (24°C). The results of these experiments on rabbit retinas, as shown in Table III, agree with those reported by Ames and his coworkers. Obviously the
Table III
Results of the experiments on rabbits retinas
Calculated
Total K Total Na Intracellular Extracellular Inulin Source of Content Content Na Content Na Space Space Data
N
w
Nw
mM/kg w. t. % %
74.9 79.0 63.2 16.3 21. 2 32.1 29 Present Study
80.3 79. 8 59.0 11. 3 18.4 32.6 28
"
"
,
72.4 62.3 21. 3 29 Ames and Hastings
(19 56)
,.,,
14.1 15.7 33 Ames and Nesbett
(1966)
Table IV
·:!~ c'
Results of Experiments Under Various Conditions
Conditions of Experiment Total K Content Na Content Na Inulin
\
Temperature Osmolarity Substance N
w
N W ) Space -SpaceAdded Extra-l ,
cellular )
oc
mOsm mM/kg w. t. % %24 340 64.1 51. 2 37.0 12.3 15.2 13. 4
" 1(-~ :~-~
·'
-
...(From Tab le II)
··-±4.4 ±3.4 ±3.4 ±2.5 ±2.2 ±1.6
41 340 72. 8 77. 2 39. 7 13.2 17.8 14.2
. /
, (_ 41 340 72. 7 71.1 45.9 19.5 17.8 17.2
( , : .. [•: (.
..
41 360 NaCl 76.5 70.4 46.2 16.0 18.9
24 380 NaCl 68. 0 68.2 54.2 19.4 20.5
41 380 NaCl 70.3 65.1 57.8 15.8 24.7
24 385 Sucrose 65.4 69.0 52. 5 14.6 25.3
41 400 NaCl 60.6 53.1 73.6 38.7 19.4
for the large discrepancy in the magnitudes of the ECS between the two
species. To check the possible effect of the difference in temperature
at which the retinas were kept, the experiment on chicken retina were
repeated at its body temperature (41°C). The results of two such
experiments were listed on the upper part of Table IV. For the
convenience of comparison, the results from Table II were also listed
at the top of Table IV. The comparison of these two sets of results
shows that chicken retinas kept at body temperature have a higher K
content than those at room temperature. Although the number of
experi-ments is small, this comparison may indicate that under a physiologically more favorable condition (at body temperature) the chicken retina can
* better maintain its ion composition. Also, the ECS determined in
these experiments was slightly larger than that in the experiment
performed at 24°C. But, even under these conditions the magnitude
of the ECS in the chicken retina, either estimated as inulin or
extracellular Na space, is still far smaller than that in the rabbit retina.
From the results of the above experiments it is obvious that the large discrepancy between the ECSs in the retinas of the chicken and
in the osmolarity of the bathing solution causes an enhancement of
the extracellular Na space of the retina up to about 25%, which is
still smaller than that of rabbit retina. It can therefore be concluded
that the ECS of the chicken retina is actually smaller than that of the
rabbit retina.
The species difference between rabbits and chickens is not
unexpected, for there are some physiological, morphological, and may
be metabolic differences known to exist between the retinas of the
two·species. For instance, in the avian retina there is a structure
called pecten, which is not present in the mammalian retina, on the
other hand, in the mammalian retina there are retinal blood vessels
which are absent in the avian retina. This morphological difference
suggests differences in the supply of oxygen and nutrients. In
mammals the retina may receive its supply through the retinal blood
vessels, while in the birds the pecten is believed to be involved in
the supply to the retina.
The extracellular space and the ion contents of the retina after
invasion by spreading depression
At the end of the initial incubation period the retinas were
transferred from Mg-CSF to MA-CSF. After being transferred, SD
developed spontaneously in about 30 seconds and was completed in about
2 minutes. The retina was then separated from the other tissues,
the MA-CSF for a total of 4 minutes and 2 minutes after the completion
of SD, before they were subjected to washing. Both types of washing
were employed. The results of the experiments are given in Table V.
A comparison of these results with the data of the resting retina
(Table II) shows that after SD the total K content is decreased and
that the intracellular Na content is increased.
The marked difference in the total K contents of the resting
retinas due to the two procedures of washing is not observed in the
retinas invaded by SD. Therefore, the decrease in K content caused by
SD computed as the difference between the resting and the SD invaded
retinas is larger after N-type washing (23.5 mM/kg w.t.) than after
• W-type washing (11.5 mM/kg w.t.). Both figures for the decrease in K
due to SD are far larger than the extracellular K content (less than
1 mM/kg w.t.). Besides, in computing the decrease, the extracellular
K contents are about cancelled. Therefore, it is obvious that the
decrease is due to a loss of intracellular K. Hence, it can be
concluded that during SD intracellular K is released.
The magnitude of the increase in the intracellular Na content
due to SD is, again, different when computed from the data obtained
from retinas after different procedures of washing. With data from
the retinas after N-type washing the increase is 16.5 mM/kg w.t.,
while after W-type washing i t is only 9.0 mM/kg w.t. This discrepancy,
as will be discussed below, is due to a loss of intracellular Na
Table V
Results from the retinas two minutes after spreading depression
Total K Total Na Computed Extracellular Inulin
Content Content Intracellular Na Space Space
Na Content
N
w
Nw
mM/kg w. t.
% I
40.6 39. 8 53.1 21. 3 34.1 21. 2 12.6
..J
±1. 9 ±4.1 ±3.4 ±1. 3 ±2.2 ±3.0 ±1.1
I
(4) (4) (4) (4) (4) (4) (4)
f)
Drn 12. 8 8.6p <0.01 I <0.01
both sets of data show that there is an increase in intracellular
Na content after SD, indicating that during SD a significant amount
of extracellular Na enters the intracellular compartment of the retina.
As shown· in Table V, there is a large discrepancy between the
magnitude of the extracellular Na and the inulin spaces in the SD
invaded retinas. The former is almost twice as large as the latter.
A comparison of these data with those in Table II shows that there is a
contradiction between the effect of SD on the magnitude of these spaces.
From the change in the extracellular Na space it would appear that
SD causes an increase in the ECS from 15 to 21%, while the data of
the inulin space indicates that SD causes a slight decrease. Obviously,
• at least one of these estimates is incorrect.
Inulin is a large molecule (M. wt. 5,000 - 5,500) as compared
to water or the Ringer's electrolytes, and hence it will diffuse into
and out of the narrow ECS in the isolated retina slower than these
compounds because of steric hindrance. Therefore, when the magnitude
of the ECS changes, that of the inulin space will lag behind, especially
when there is a decrease in magnitude of the ECS. Only if enough time
is allowed for diffusion, the magnitude of the inulin space may become
equal to that of the ECS. Ames and Hastings (1956) found that when
the retina was transferred from an inulin-free to an inulin-containing
artificial CSF, the marker reached its final, maximal concentration
in the tissue in about 3 minutes. In the present experiment the
Mg-CSF to MA-CSF, both of which had the same concentration of inulin.
Although the period of time that the retina was immersed in MA-CSF
(4 minutes) is of the same order as that needed for the equilibration
of the inulin between the ECS and the bathing solution, the ECS can
be expected to change during this period. The change of the inulin
space may therefore indicate the direction of a change in the ECS but
cannot be expected to represent the magnitude of the ECS. Furthermore,
SD observed in the present and all the subsequent experiments did not
occur over the entire retina at once, but developed spontaneously at
the margin of the retina and took about 1.5 to 2 min. to completion.
Van Harreveld (1958) showed that the swelling of the cortical cellular
elements is mos.t conspicuous at the site where the maximal impedance
change accompanying SD is recorded, and that the extent of the swelling
decreases in the tissue that is recovering from this phenomenon. Thus,
at 2 min. after the completion of SD (3.5 min. after SD first developed)
some parts of the retina may be recovering, and the magnitude of the
ECS in these parts may be on their way back to the resting level.
Therefore, the inulin space determined does not represent the magnitude
of the ECS of the entire retina at the maximum of SD. The de-crease
of the inulin space shown in TableV, although1 smal~_;:)~~~-~ests_,ther~£o_:e.
/ ,
r.,
l " .. -I . I ' ' ; . \ I ~ ,. ·.' ... )that the ECS in the retina invaded by SD is smaller than -that in ... the ; ), ·1 !-1. \'\\b.~ ~\ ,.~ i ~·.~ \: (~ •. ·' 1
· · ( :-i. i :/\ i\ •
·}
i'~ ' l ' '. •• i
resting state-,
Since the ECS seems to decrease after SD, the large increase in
must be due to other causes than a change in the ECS. This Na space
was calculated from the Na contents measured in the retinas after
the two different types of washing and the known Na concentration of
the bathing solution. The Na concentration of the bathing solution is constant, and the Na content measured in the retina after N-type
washing can be expected to supply a reliable value for the total Na
content of the retina. Therefore the large Na space determined in the
present experiment must be due to the loss of the intracellular Na from the retina during W-type washing. This is supported by the fact that the intracellular Na content measured in retinas after W-type
washing is only about two thirds of that calculated from retinas after
N-type washing (Table V). Apparently a significant amount of intra-cellular Na was lost from the SD invaded retinas during the Ringer's sucrose solution washing. Such a loss can be explained. Since the
cell membrane of the retina is permeable to Na+ even at the resting
state, the washing of the retina, which contains a high concentration
+
of intracellular Na after SD, in the Na-free Ringer's sucrose solution will undoubtedly cause a loss of intracellular sodium. Besides, it was postulated that the Na+ permeability of cell membranes is increased
(:
assuming that the inulin space represents the actual ECS, the loss
of intracellular sodium in the present experiment involving SD is
about 13 mM/kg w.t., which is much larger than that in the previous
experiment (5.mM/kg w.t.) in which no SD was elicited.
From the above discussion it is apparent that the application of
the Ringer's sucrose solution in the W-type washing procedure causes
a serious loss of intracellular Na, and hence an increase in the
extracellular Na space. Therefore, this washing procedure was not
employed in the later experiments (except the lithium experiment).
Changes in the extracellular space and the ion contents of the retina
during the course of spreading depression
From the relatively quick restoration of the electrical activity
in the nervous tissue invaded by SD one would expect that the
restoration of the resting ion distribution and the ECS occurs soon
after the completion of SD. Accordingly, the actual changes in the ECS
and the ion contents caused by SD must have been greater than those
listed in Table V, for they were determined two minutes after the
completion of SD and during these two minutes some restoration might
have taken place. To investigate the maximal changes produced by SD
and their restorations the following experiments were carried out. The
retinas were prepared in such a way that they could be isolated
completely almost instantly. The tissue was then taken out of the
_,
from Mg-CSF to MA-CSF which initiates SD and subjected to the N-type washing and the measurements described above. The retinas of the
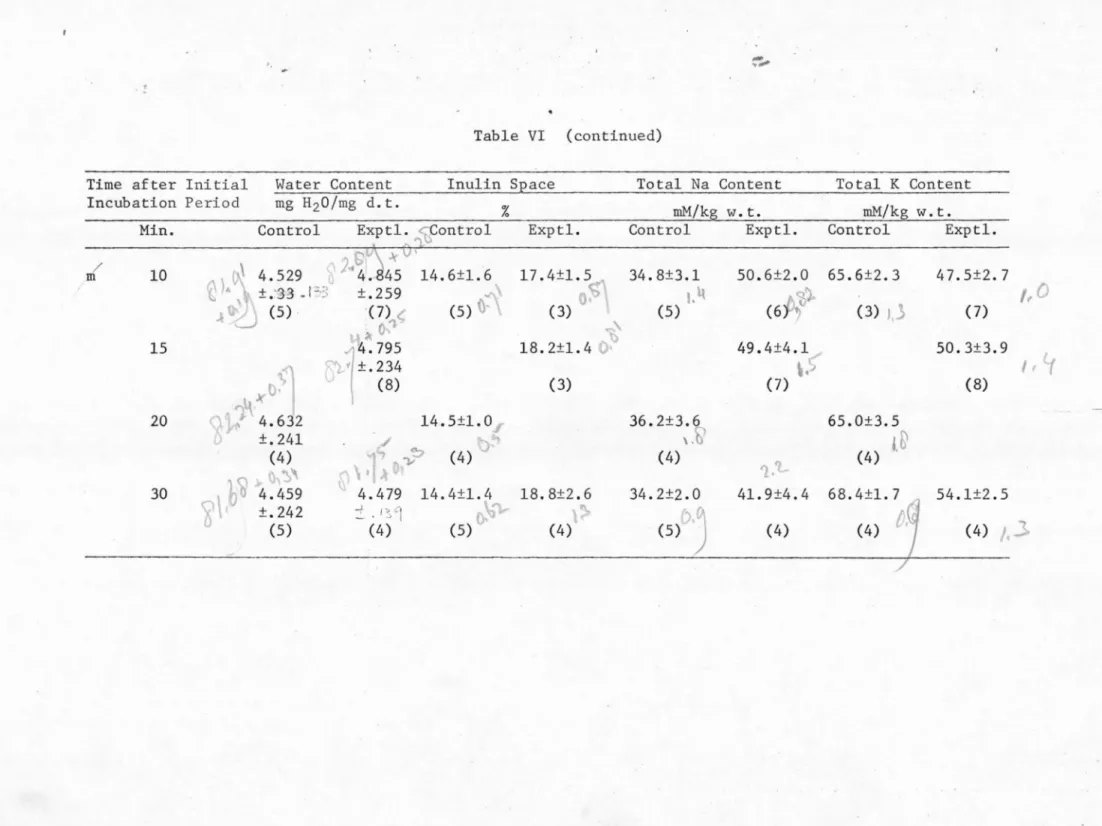
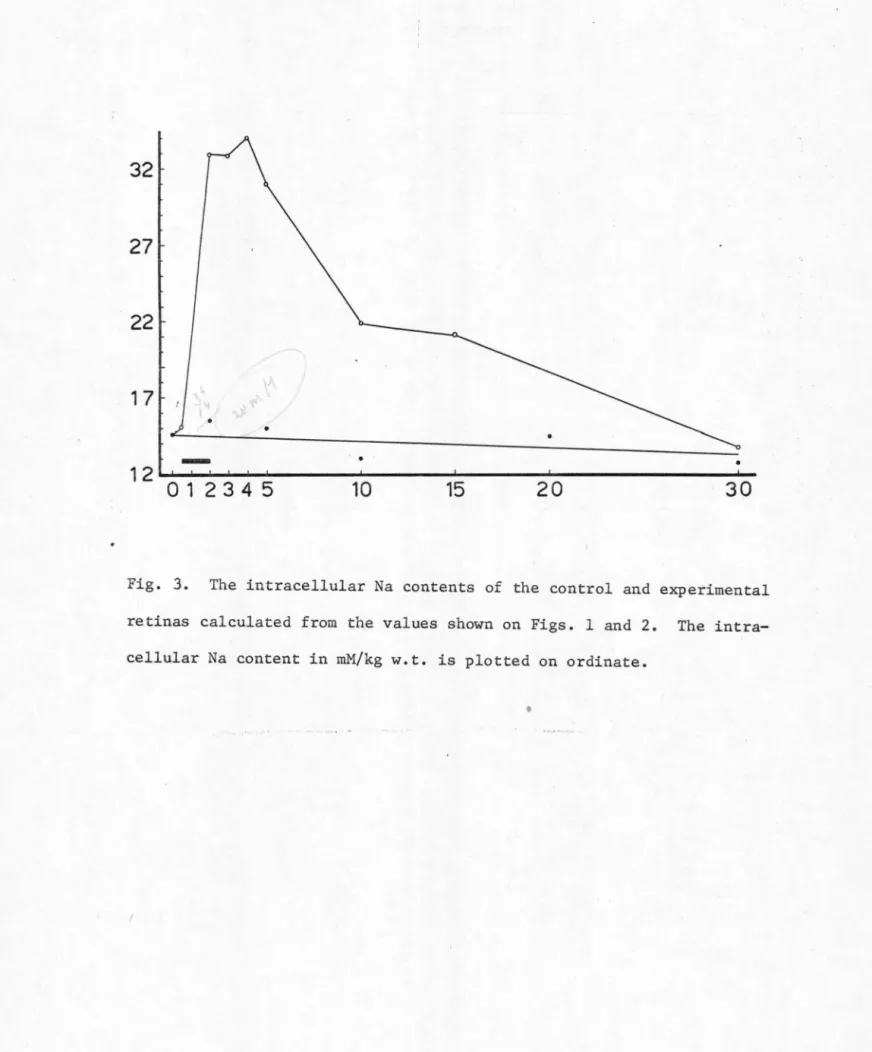
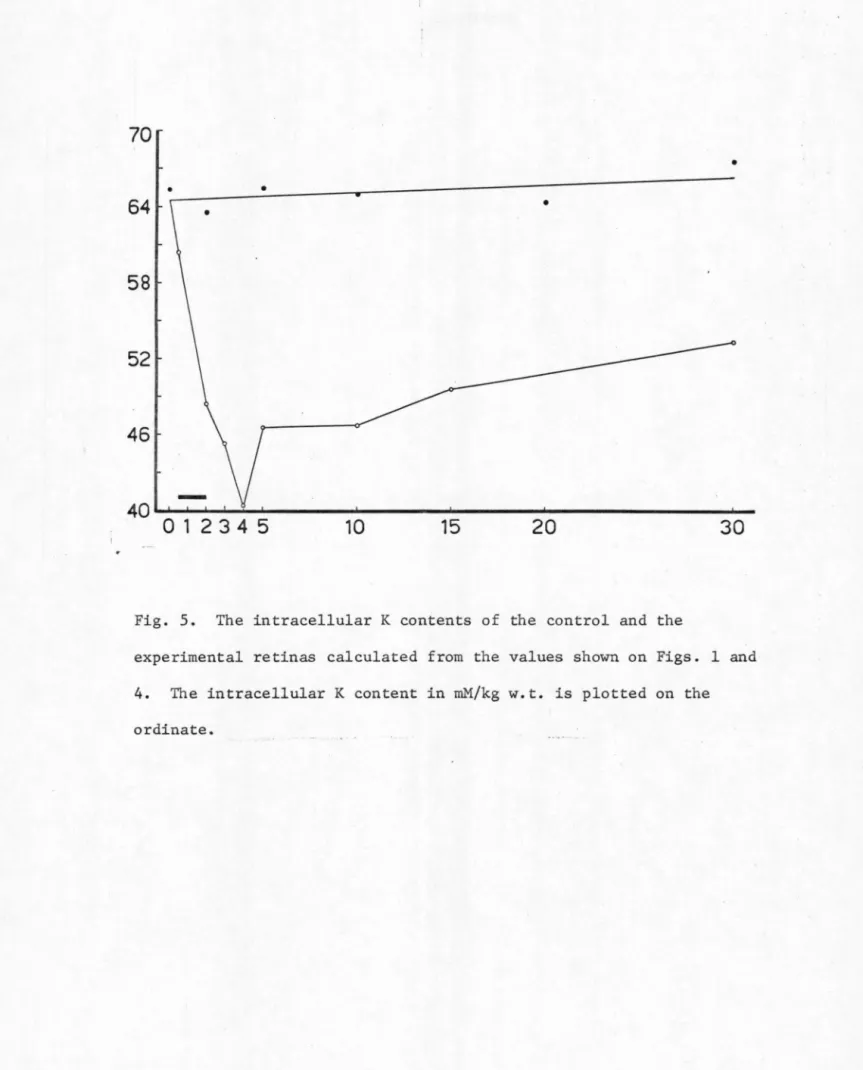
control group were kept in the Mg-CSF solution all the time. The results from both groups of retinas are listed in Table VI and plotted
in Figs. 1 through 5.
In the control retinas SD was never observed. The levels of the water content, the inulin space, and the Na and K contents of these
control retinas remained fairly constant throughout an experimental period of 30 minutes (see Table VI and Figs. 1 through 5). This indicates that during the entire experimental period the isolated
retinas are in a steady physiological state and hence that no serious
deterioration occurs.
In the retinas invaded by SD there are various changes. The change in water content caused by SD is not statistically significaµt.
b
t\I
~~
~\u,.v~~
\~~
l
~~y
"' ....
!:"' '-'
-.:::-~
<-::,""'
\, \Jo~
l{
.
&\
~
\
\0~
)'
Table VI
~ & r
I
'}•
\\
1
Results from the Control and the Experimental Retinas at Various ,,,_ o1I %I
'11 \
t c'- ' .)
Times After Initial Incubation Period
Time after Initial
Incubation Period
Water Content mg H20/mg d.t.
Min.
0
0.5
2
Control
f)'?.~I 4. 604
±.196
o,1r
(15)-1
Exptl.
4.603
±.119
) (81
t
,s
j_ -,1~i ~. 450
=
l&-2. 4. 650. , (5)v . (14)
~
Inulin Space
%
Control Exptl.
14.9±1. 7 J
.
-.f t
"
(12)
1. 6±1. 6
(5)
14. 7±1. 8 13. 3±1. 2
(5)()~'\ (10)
Total Na Content
mM/kg w. t.
Control
37. 0±1. 9
I
(14)
'V
37.5±1. 7
b
(5)
().'&
Exptl.
40.0±2.3
(6)
l.60
52.9±3.5
(12)1,W
').
u
>
~ ~l_'.'
Total K Content
mM/kg w. t.
Control
66.1±1. 9
~. (11)
/.)
.,
[ I
/,t I J
64.2±1.2
(4) Exptl. 6.1±3.0 (8) I 48.9±3.2
(14)
1.0
3 4.784
±.157
12. 3±1.1 51. 2±2. 7
3.\
45.8±2.4D'""
l 8"
'
~
Ir-.
'<
...,,", 'c
\\.I
'4.4925
(13)
b
--\' c \
4. 892 ±1.18 (4)
1\
4.680 ±.232 (11)12. 6±1. 2
(4)
14.3±1.5 15.5±1.5 .
(11)
53.1±3. 4
(4) ' }
v
0
(12)
j,,)