Effect of Vertical Microphone Layer Spacing for a
3D Microphone Array
HYUNKOOK LEE,AES Member
,AND CHRISTOPHER GRIBBEN,AES Student Member
University of Huddersfield, Applied Psychoacoustics Lab, Huddersfield, HD1 3DH, UK
Subjective listening tests were conducted to investigate how the spacing between main (lower) and height (upper) microphone layers in a 3D main microphone array affects perceived spatial impression and overall preference. Four different layer spacings of 0m, 0.5m, 1m, and 1.5m were compared for the sound sources of trumpet, acoustic guitar, percussion quartet, and string quartet using a nine-channel loudspeaker setup. It was generally found that there was no significant difference between any of the spaced layer configurations, whereas the 0m layer had slightly higher ratings than the more spaced layers in both spatial impression and preference. Acoustical properties of the original microphone channel signals as well as those of the reproduced signals, which were binaurally recorded, were analyzed in order to find possible physical causes for the perceived results. It is suggested that the perceived results were mainly associated with vertical interchannel crosstalk in the signals of each height layer and the magnitude and pattern of spectral change at the listener’s ear caused by each layer.
0 INTRODUCTION
The recently proposed multichannel audio formats such as 22.2 [1] and Auro-3D [2] employ height channels to pro-vide the auditory sensation of a “three-dimensional (3D)” space. For cinema sound or pop music production, the height channels could be used for creative panning of source image in the vertical domain as well as for providing extra ambience. On the other hand, for acoustic recordings made in a concert hall, the use of height channels is likely to be focused on extra ambience since source images would not need to be elevated in most cases (an exception of which could be choir singers on high stands).
In recent years a few main microphone techniques em-ploying height channels have been introduced [3–5]. For example, Theile and Wittek [3] proposed a technique called “OCT-9” that employs four upward-facing cardioid micro-phones that are placed above the front left, front right, rear left, and rear right microphones of the main microphone ar-ray “OCT-5.” The recommended spacing between the main and height microphones for this technique is 1m or wider. Williams [4] also designed a 3D microphone array with four height microphones that are vertically spaced from the main microphones. The proposed spacing between the lower and upper layers is 1m and the polar pattern of the height mi-crophones is figure-of-eight. On the other hand, Geluso [5] proposed using a “coincident” microphone technique as a method to capture height information; a vertically ori-ented figure-of-eight “side” microphone is configured with a front-facing “mid” microphone without any spacing be-tween the two.
To date, however, no formal experimental data has been provided on the effect of spacing between main and height channel microphones on perceived spatial impression. In the context of horizontal stereophony, it is widely known that a more spaced microphone pair would produce a greater spatial impression in reproduction [6–8]. This is due to the fact that a larger spacing between the microphones would lead to a lower degree of interchannel correlation between the signals [7]. However, research suggests that the princi-ples of horizontal stereo might not be directly applicable to vertical stereo. In terms of localization, it is well known that vertical localization relies on spectral cues rather than interaural cues [9, 10]. The amplitude panning of phantom image in vertical stereophonic reproduction has been re-ported to be unstable [11]. It has also been found that the precedence effect does not fully operate between vertically arranged loudspeakers regardless of the time difference ap-plied to them [12, 13], and that time panning in the vertical plane is ineffective [14]. With respect to spatial impression, the present authors investigated the effectiveness of inter-channel decorrelation for controlling the perceived image spread of band-passed pink noise, using two loudspeakers arranged vertically in the median plane as well as those hor-izontally arranged [15]. It was found that the effectiveness of vertical decorrelation was not as strong as that of hor-izontal decorrelation, depending on frequency. However, the perceptual mechanism of vertical spatial impression has not been fully explored yet and therefore needs further investigation.
spacing between main and height channel microphone lay-ers has on the magnitude of perceived spatial impression and the subjective preference. Objective measurements of recorded and reproduced signals have also been carried out in order to examine possible physical causes for subjec-tive results. The scope of the study was focused on acoustic recordings made in a concert hall, using a main microphone array. It is expected that the findings of this study will not only provide a useful basis on which to develop a 3D main microphone technique but also extend the knowledge of auditory perception in vertical stereophony.
This paper is organized as follows. Section 1 describes the process of experimental stimuli creation and the method of listening experiment. The results of the statistical analy-sis of the test data are presented in Section 2. Section 3 de-scribes the objective measurements conducted and presents the results. Section 4 discusses the subjective results in relation to the objective measurements. Finally, Section 5 summarizes and concludes the paper.
1 EXPERIMENTS
1.1 Recording Setup
Two different types of recordings were made in a shoe-box shaped concert hall called St. Paul’s in Huddersfield, UK (V=approx. 5700m3; RT=avg. 2.1s): one for
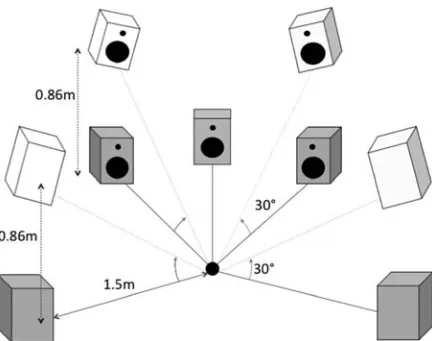
obtain-ing multichannel room impulse responses (MRIRs), and the other for the recording of virtual ensembles. Fig. 1 shows the physical setup of the loudspeakers and microphones used in the recording. The impulse responses were obtained using the exponential sine sweep method [16] with a single Genelec 8040A loudspeaker placed in the stage center. The MRIRs were later convolved with anechoic trumpet and acoustic guitar signals to create single source stimuli. They were then used for the analyses of various acoustical char-acteristics in different time segments, which are described in Section 3. There were two types of virtual ensemble per-formances generated through the other four loudspeakers of the same type: percussion (conga/bongo) quartet and string quartet. These four sources were chosen to give a varied assessment between solo and ensemble instruments. They also allow for the investigation of the influences of the tem-poral and spectral characteristics of sound. The recordings were made in the PCM wave format at 44.1 kHz/16 bits. The loudspeakers used have reasonably flat on-axis frequency responses, from 48 Hz to 20 kHz within the range of±3 dB deviation. The off-axis response of a loudspeaker radiation typically has reduced high frequencies. Nevertheless, this was considered to be acceptable since most musical instru-ments also tend to be directional at high frequencies with reduced energy above about 4 kHz.
All of the microphones used were the same type (AKG C-414 B-XLS in cardioid polar pattern), and they were recorded with an identical amplification level. The micro-phones of the main (lower) layer were configured based on a multichannel microphone array called PCMA [17], as shown in the upper panel of Fig. 1. The distance and angle between microphones in the front triplet have been
selected to provide a continuous and linear localization curve across the front three channels in reproduction, as well as to produce sufficient interchannel decorrelation for frontal spatial impression [17]. The stereophonic recording (coverage) angle calculated for this configuration at the 3m source-array distance was 110◦. The 3m distance between the front triplet and the rear microphone pair, as well as between the two rear microphones, was determined based on [7, 8] to ensure sufficient interchannel decorrelation. The microphones were placed at 2m from the stage floor level. The frontal microphones were tilted 60◦downwards while the loudspeakers were tilted 30◦upwards. This was to ensure the original frequency spectra of both the expo-nential sine sweep and anechoic source signals, radiated by the loudspeakers, was captured as accurately as possible.
The positions and directions of height channel micro-phones were selected based on the approaches of the previously proposed techniques described in Section 0 [3–5]. Four height channel cardioids were positioned di-rectly above the front left, front right, rear left, and rear right microphones of the main array as suggested by Theile and Wittek [3]. These were placed at four different heights of 0, 0.5, 1, and 1.5m from the main array in order to in-vestigate the effect of different layer spacings. A spacing of 1m or higher is suggested in [3, 4] whereas a vertically coincident configuration (0m spacing) is proposed in [5]. Since the scope of the current study was a main micro-phone array design, which does not tend to have extreme microphone spacings, the 1.5m spacing was considered to be large enough for channel separation and yet close enough for microphone rigging in a practical recording sit-uation. As with the approaches proposed in [3, 4], all of the height channel microphones were positioned directly upwards to capture reflections from the same direction. Theile and Wittek [3] suggest the use of the cardioid polar pattern for ceiling-facing height channel microphones. On the other hand, Williams’s [4] technique employs vertically positioned figure-of-eight microphones. This polar pattern might be beneficial in terms of suppressing the direct sound if the microphone was angled so that its null point was to-ward the sound source. However, if the microphone was configured vertically as suggested in [4], the rear lobe of the microphone could potentially pick up strong direct sound and floor reflections, which might lead to inaccurate verti-cal loverti-calization and undesired tonal coloration. Therefore, for the current experiment using upward-facing height mi-crophones, the cardioid was considered to be more suitable than the figure-of-eight.
1.2 Reproduction Setup
Fig. 1. Recording setup in St. Paul’s concert hall
Fig. 2. Loudspeaker setup based on the 9-channel Auro-3D
surround left, and surround right loudspeakers at a vertical angle of 30◦ from the listening position. The main and height loudspeakers reproduced the five-channel main and
four-channel height layer microphone signals, respectively. In order to match the arrival times and sound pressure levels (SPLs) of the main and height loudspeaker signals, neces-sary delay and level alignments were applied to the main channels with reference to the height channels; each of the main channel output signals was delayed by 0.68 ms and attenuated by 1.2 dB.
1.3 Test Stimuli
[image:3.581.51.267.496.667.2]of the source using a Casella CEL-450 real time analyzer. Height layer signals were reproduced at the same gain as the main layer ones, so that the original level relationships between the main and height microphones’ signals were maintained. It should be noted that height microphones with different vertical spacings had different level relation-ships with the corresponding main microphone due to their cardioid polar pattern and fixed direction toward the ceiling. This resulted in a slight variation of SPL when the signals of each height microphone layer was reproduced together with the main layer signals; when both main and height channels were reproduced, the LAeq decreased from 75 to 73.7 dB SPL as the vertical microphone spacing changed from 0 to 1.5m. These differences were not compensated since they were produced inherently from the direction and polar pattern of the height microphones, which were experi-mental constants. This is also an ecologically valid scenario in practical recording situations where vertical microphone spacings are experimented using the same polar pattern and direction. The influence of this level difference rela-tionship on perceived results will be discussed in detail in Section 4.
1.4 Test Method
There were two sets of tests conducted: “spatial im-pression” and “preference” tests. In the context of con-cert hall acoustics research, spatial impression is usually understood as an attribute that has two sub-dimensions of apparent source width (ASW) and listener envelopment (LEV) [19]. However, these sub-attributes only describe the two-dimensions of width and depth. Since the purpose of a microphone array with height channels is to add the height dimension in reproduced sound, the term spatial im-pression in the current experiment was defined as a global attribute that describes all possible spatial percepts from the three-dimensions (3D) of width, depth, and height for both source and environment-related sound components. It was not within the scope of this study to test possible sub-attributes of 3D spatial impression individually—future re-search is necessary to fully elicit and define different types of 3D spatial attributes.
A total of 12 subjects from the University of Hudders-field’s music technology courses participated in the listen-ing tests. They comprised staff members, researchers, and final year undergraduate students, all of whom had previ-ous experiences in critical listening of variprevi-ous spatial audio attributes in listening test environments.
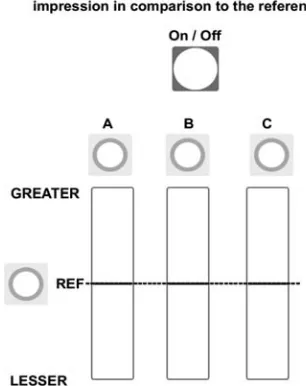
[image:4.581.340.493.50.243.2]Multiple stimuli comparison tests were conducted using a graphical user interface (GUI) produced by the authors using Max-MSP software, shown in Fig. 3. The same GUI was used for both the spatial impression and preference tests. For each test, the subject was to complete a total of four trials, each of which contained the stimuli of the four microphone spacings for each sound source. All stim-uli were played synchronously so that the subjects could switch between them continuously. The subject was asked to grade three stimuli against a reference stimulus on a bipo-lar continuous rating scale, where the reference was to be
Fig. 3. Graphical user interface used for the listening tests
taken as 0, giving the subject a reference point in the scale when all stimuli were judged to be similar. One of the four stimuli was chosen to be the reference in each trial, and this was randomized in order to avoid potential psychological biases. There was an equal chance for each stimulus to be the reference for each source. The presentation orders of the stimuli, trials, and tests were also randomized.
For both spatial impression and preference tests the scale values ranged from –50 to +50 with a step size of 1, but these were internal quantities and not shown to the subjects. The labels “greater” and “lesser” were used to indicate di-rections for grading. The subjects were instructed that the end points of the bi-polar scale represented extreme differ-ences against the reference (e.g., extremely greater or lesser magnitude of perceived spatial impression in comparison to the reference). When using this kind of continuous scale without semantic labels, there is a risk that subjects might use the scale inconsistently in each trial. To mitigate this, the subjects were given a familiarization trial including all stimuli before starting the actual tests.
2 LISTENING TEST RESULTS
Table 1. Results of RM ANOVA
Spatial impression Preference
Partial Eta Partial Eta
F p Squared F p Squared
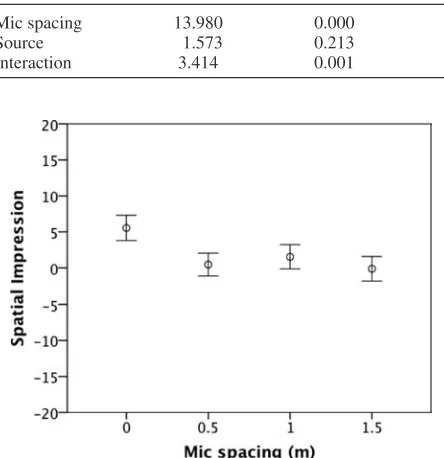
[image:5.581.49.271.106.335.2]Mic spacing 13.980 0.000 0.738 5.877 0.002 0.329 Source 1.573 0.213 0.381 1.040 0.387 0.080 Interaction 3.414 0.001 0.973 1.974 0.049 0.141
Fig. 4. Microphone spacing vs. spatial impression for all sources: Mean values and associated 95% confidence intervals
be caused in multiple comparison tests. The Bonferroni-corrected results are summarized in Table 2.
2.1 Spatial Impression
The RM ANOVA results in Table 1 indicate that the microphone spacing had a significant main effect on the magnitude of perceived spatial impression at the 1% sig-nificance level. Fig. 4 plots the mean values and associated 95% confidence intervals of the differences of 0.5, 1, and 1.5m to 0m for all sources. It can be seen that the 0.5m, 1m, and 1.5m spacings were all graded lower than the 0m one. The paired samples t-test results in Table 2 confirm that these differences are statistically significant (p<0.05), al-though they appear to be only slight. Fig. 4 and Table 2 also
suggest that the differences among the 0.5m, 1m, and 1.5m spacings in perceived spatial impression are insignificant.
Table 1 also indicates that interaction between micro-phone spacing and sound source had a significant effect (p < 0.01). This can be observed from Fig. 6. For the acoustic guitar and percussion quartet, which were the most transient stimuli among all, the magnitude of perceived spa-tial impression for the 0m microphone layer is slightly, but significantly, greater than those for the spaced layers as the t-test results confirm (p < 0.05). Among the spaced layers there is no significant difference observed with the exception of 1.5m graded significantly lower than the other spacings for the trumpet.
2.2 Preference
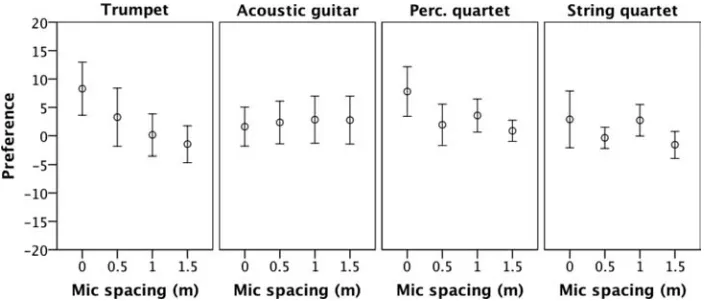
[image:5.581.44.525.594.742.2]RM ANOVA (Table 1) suggests that the main effect of microphone spacing was significant (p<0.01). Fig. 5 plots the mean values and associated 95% confidence intervals of the preference test data for all sources. It can be seen that the 0m spacing was graded slightly higher than all the other spacings overall. The t-test results in Table 2 suggest that the 0.5m and 1.5m results were significantly different from the 0m, whereas the 1m was not. The source-dependency of the microphone spacing effect can be observed in Fig. 7, which plots the data for each source separately. For the guitar and string quartet there is no significant difference between the 0m and any other spacings. For the trumpet and percussion quartet, on the other hand, there is a general trend that the 0m spacing is slightly preferred to the larger spacings. The differences among the spaced microphone layers are found to be insignificant, regardless of the source type.
Table 2. Results of paired samples t-tests for each sound source: Bonferroni correctedpvalues
Mic pacing pair (m) Trumpet Acoustic guitar Perc. quartet String quartet All sources Spatial impression 0 – 0.5 1.000 0.030 0.018 1.000 0.000
Fig. 5. Microphone spacing vs. preference for all sources: Mean values and associated 95% confidence intervals
3 POST-HOC SIGNAL ANALYSIS
In order to obtain insights into possible causes for the subjective results shown above, a series of post-hoc mea-surements has been carried out. Two types of signals were analyzed: original multichannel room impulse responses from the recording session (MRIRs) and binaural impulse responses of reproduced sounds (BIRRSs) captured in the listening room by a dummy head microphone. For the
MRIRs, signal energies for different time segments, in-terchannel level differences (ICLDs), direct to reverberant (D/R) energy ratios, and interchannel cross-correlation co-efficients (ICCCs) were computed. For the BIRRSs, sig-nal energies for different time segments, spectral influence of height channels, and interaural cross-correlation coef-ficients (IACCs) were investigated. The methods used are described in the following sections, alongside the results, which will be discussed together with the listening test re-sults in Section 4.
3.1 Channel Signal Analysis 3.1.1 Signal Energy
[image:6.581.121.474.398.548.2]The signal energies were measured in decibel for two different time windows: 0 ms to 5 ms (direct sound) and 5 ms to 750 ms (ambient sound), with 0 ms being the ar-rival of the direct sound. This was to examine “interchannel level differences (ICLDs)” between different channels, as well as the “direct to reverberant (D/R) energy ratio” for each channel. Here, the ICLD is defined as the energy ratio between two impulse responses within 5 ms, and the D/R ratio is the energy ratio between sound arriving within 5 ms and that between 5 ms and 750 ms. The time windows were determined based on the research by Bronkhorst and Houtgast [21] and Hidaka et al. [19] and will be used to di-vide direct and ambient sound throughout this paper. ICLDs between front main and front height signals would be use-ful for understanding whether the direct sound included in
Fig. 6. Microphone spacing vs. spatial impression for each source: Mean values and associated 95% confidence intervals
[image:6.581.121.475.576.727.2]Fig. 8. Results of energy measurements for the direct and ambient sounds of multichannel impulse responses
Table 3. Interchannel Level Difference (ICLD) of each front left height microphone (FLh) to the front left main microphone
(FL) and that of each rear left height microphone (RLh) to the rear left main microphone (RL)
[image:7.581.44.274.375.455.2]Spacing FLh to FL RLh to RL 0m −7.6 dB −12.8 dB 0.5m −9.3 dB −13.9 dB 1m −10.3 dB −14.6 dB 1.5m −13.8 dB −16.3 dB
Table 4. Direct to Reverberant (D/R) Energy Ratio for front and rear left channel signals
Channel Front left Rear left Main 12.2 dB −7.8 dB Height 0m 4.6 dB −1.0 dB Height 0.5m 2.8 dB −2.4 dB Height 1m 1.9 dB −2.7 dB Height 1.5m −1.8 dB −4.5 dB
the height channels has an effect on the perceived spatial impression (i.e., vertical interchannel crosstalk). The D/R ratios give an indication of the relative influence that direct and ambient sound energies have on the perceived spatial impression for the different microphone heights.
Fig. 8 plots energies measured for the impulse responses of the main and height microphones for the front left and rear left channels. The energy of the front main left signal was set to 0 dB, to which all other values were normal-ized as reference. As can be seen, the energies of ambient sounds are almost constant around –12 dB for both front and rear channels. On the other hand, the direct sound en-ergy of the height channel signal decreases gradually as the microphone height increases. The direct energy of the rear main channel is substantially lower than those of the rear height channel, while the front channels show an op-posite pattern—this is because the rear main microphone was facing backwards, thus having a greater rejection of direct sound. From the individual energy values, the ICLD between the main and each height signal and the D/R en-ergy ratio for each signal were calculated; results of which are presented in Tables 3 and 4.
3.1.2 Interchannel Cross-Correlation Coefficient (ICCC)
The ICCC is an indicator of the degree of similarity between two channel signals. It is defined as the maxi-mum absolute value of normalized cross-correlation func-tion (NCF), which is defined below.
N C Ft1,t2(τ)= t2
t1 x1(t)·x2(t+τ)dt t2
t1 x 2 1(t)·
t2
t1 x 2 2(t)dt
, (1)
where x1and x2are channel signals, t1and t2are the lower
and upper boundaries of time segments, andτis the time lag.
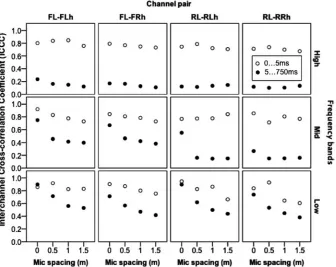
ICCCs for the MRIRs of main and height microphones with different spacings were measured in octave bands for four different pairs of vertical and diagonal channels: FL (front left) - FLh (front left height), FL and FRh (front right height), RL (rear left) and RLh (rear left height), and RL and RRh (rear right height). The measurements were taken for two time segments separately: t1 =0ms to t2=
5ms (direct sound) and t1 =5ms to t2=750ms (ambient
sound). The lag (τ) limit for the direct sound segment was
±2.2 ms, which was the largest ICTD occurring between the direct sounds of the main and height channels, i.e., between FL and FLh with the 1.5m spacing. The lag limit for the ambient segment was taken to be±10 ms since it was the maximum ICTD that could occur for a reflected sound, i.e., between RL and RRh at 1.5m.
Fig. 9. Interchannel cross-correlation coefficients for vertical and diagonal pairs of microphone signals, measured for direct and ambient sounds separately; FL=front left, FLh (FRh)=front left (right) height, RL=rear left, RLh (RRh)=rear left (right) height
sources all have spectral peaks across the low and middle bands.
3.2 Binaural Signal Analysis
The original nine-channel MRIRs, as well as the con-volved listening test stimuli, were reproduced by the cor-responding loudspeakers in the room that was used for the listening tests. The loudspeaker configuration and the playback conditions were the same as the listening test. A reproduced sound field, created by a combination of the main and each height microphone layer, was recorded us-ing a Neumann KU100 dummy head microphone placed at the listening position. This was also carried out for the main layer alone, in order to examine signal characteristic differences between 2D and 3D reproductions (i.e., main layer only vs. with height).
3.2.1 Energy of Ear Input Signal
The energies of the left ear input signals, resulting from the combinations of different microphone layers, were com-puted for the time segments of 0 ms to 5 ms (direct) and 5 ms to 750 ms (ambient) separately. Results of which are plotted in Fig. 10 using 0 dB, the energy for the main layer only, as reference. For the direct sound segment, the 0m height layer shows an energy increase of 2.5 dB. The en-ergy appears to decrease linearly but only slightly from 0.6 dB to 0.2 dB, as the spacing increases from 0.5m to 1.5m. For the ambient parts of the signals, a more dramatic energy increase is observed between the 2D and 3D reproductions. Energy for the main layer is –6.8 dB and this increases by 7.4 dB with the 0m height layer. The ambient energies for the 0.5m, 1m, and 1.5m layers are 0 dB, 0.1 dB, and –
Fig. 10. Energies of left ear input signals with different vertical microphone spacings
0.1dB, respectively. D/R energy ratios for the spaced layers are considerably low and vary only slightly between 0.2 dB and 0.5 dB. The differences in energy increase observed for different microphone layer spacing seems to be associated with spectral changes caused by the different microphone spacings, which will be shown in Section 3.2.3.
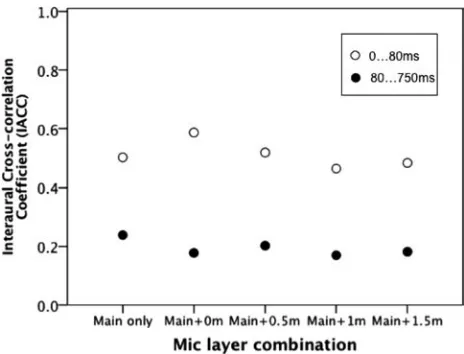
3.2.2 Interaural Cross-Correlation Coefficient (IACC)
[image:8.581.304.539.357.534.2]Fig. 11. Interaural cross-correlation coefficients for the binaural impulse responses of height channel reproduction with different vertical microphone spacings; IACCE3indicates integration from 0 ms to 80 ms and IACCL3from 80 ms to 750 ms.
the binaural signals produced by the main microphone layer combined with each height layer. This was also done for the main microphone layer alone, to see how added height channels would have affected horizontal spatial impression. These measures were proposed by Hidaka et al. [19] and are standard predictors for apparent source width (ASW) and listener envelopment (LEV), respectively. The IACC is the maximum absolute value of the normalized cross-correlation function Eq. (1) for binaural impulse responses calculated over the lag (τ) range of –1 ms and +1 ms [19]. IACC3is the average of the IACCs for three octave bands
centered on 500 Hz, 1 kHz, and 2 kHz. IACCE3indicates
the IACC3measured within the integration time window of
0 ms to 80 ms, and IACCL3from 80 ms to 750 ms.
IACC measurement results are plotted in Fig. 11. It is ob-served that the IACCE3values are greater than the IACCL3
ones. The IACCE3for the main layer alone is 0.5 and the
ad-dition of the 0m height layer increases this by 0.09. IACCE3
values for 0.5m, 1m, and 1.5m added to the main layer are 0.52, 0.46, and 0.48, respectively. For the IACCL3results,
the height layers show slightly lower values than the main layer (0.24) in general, varying between 0.17 and 0.2.
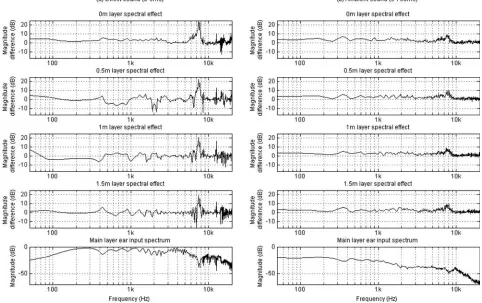
3.2.3 Spectral Influence of Height Channel Different spacings of main and height microphone layers introduce different time delays between the main and height loudspeaker signals arriving at the ear. This would cause differences in the frequency responses of the resulting ear input signals, depending on the phase relationship of the loudspeaker signals. In order to investigate the polarities and magnitudes of spectral changes in the ear signal, as caused by the addition of height microphones with different spacings, the frequency response of the left ear impulse response for the main layer has been subtracted from the main layer combined with each height layer. This was done for the direct (0 ms – 5 ms) and ambient (5 ms – 750 ms) sound components separately. The spectral influences of
height layers were also measured for the binaural recordings of the listening test stimuli.
Fig. 12(a) shows the results obtained for the direct sound components. The bottom panel shows the frequency spec-trum of the left ear input signal with only the main mi-crophone layer reproduced. Each of the upper four panels shows the spectral magnitude differences of the left ear sig-nal of the main and height layers to that of the main layer only. This represents the spectral changes caused to the main layer ear signal by the addition of each height micro-phone layer. It is observed that the 0m layer results show positive values at almost all frequencies, whereas the other layers have noticeable fluctuation in the polarity of mag-nitude difference. This means that the main and 0m height layer signals summed at the ear more constructively, while the other height layers introduced both addition and sub-traction depending on frequency. This seems to be due to comb filtering effects caused by the interchannel time dif-ference (ICTD) between the main and spaced height layer signals; the 0m layer did not suffer from this problem due to its vertically coincident nature. Above 5 kHz, the fre-quency spectrum of ear signal is largely influenced by the head-related transfer functions (HRTF) of the loudspeaker’s elevation and azimuth angles. The high peaks around 8 kHz observed for the direct sound results were produced by the difference between the HRTFs of the main and height loud-speaker positions. For example, a HRTF for 0◦ elevation and 30◦ azimuth usually has a notch dip at around 8 kHz, whereas that for 30◦ elevation at the same azimuth has a notch peak at the same frequency [22]. From the results for the ambient sound components, plotted in Fig. 12(b), it is observed that the magnitude differences for every layer fluc-tuate less than those of the direct sound results and mostly have positive values up to about 10 kHz. The difference between each layer appears to be small, although the 0m layer tends to have slightly less fluctuations in magnitude than the spaced layers between 1 kHz and 5 kHz.
[image:9.581.43.275.40.217.2]Fig. 12. Spectral magnitude differences of the left ear impulse response of the main and height layers to that of the main layer only; (a) direct sounds (0ms. . .5ms) (b) ambient sounds (5ms. . .750ms); 1024-point average FFT; the bottom panels show the magnitude frequency response of the ear input signal for the main layer.
layers. Nevertheless, the coincident layer still changes the spectrum most constructively for these sources, especially between 100 Hz and 300 Hz for the percussions and be-tween 200 Hz and 800 Hz for the strings.
4 DISCUSSION
This section discusses the results of the listening tests based on those of the signal analysis presented above in terms of spatial impression, preference, and practical im-plications.
4.1 Spatial Impression
The results generally indicate that the effect of micro-phone spacing between main and height layers on 3D spa-tial impression was little or small, depending on the type of sound source. The 0m spacing produced a significantly, al-beit slightly greater spatial impression than the larger spac-ings for the acoustic guitar solo and percussion ensemble, which have more transient characteristics than the trumpet solo and string quartet. It was also apparent that the 0.5m, 1m, and 1.5m spacings did not have significant differences in perceived spatial impression. Possible explanations for these results are provided as follows.
The perceived results should first be explained in relation to the level of direct sound picked up by the height micro-phone. As mentioned in Section 0, the primary purpose of the height microphones is to capture ambient sounds for
audibility threshold) was also investigated. The results showed that the localization threshold was between –6 dB and –7 dB for delay times up to 5 ms, whereas the audibility threshold was between –9 dB and –10 dB. Based on this, the ICLD of 7.6 dB for the 0m spacing in the current experi-ment would have been large enough for the source image to be localized at the base loudspeaker position but not enough to totally suppress potential audible effects caused by the vertical interchannel crosstalk. For the 0.5m, 1m, and 1.5m spacings, on the other hand, the ICLDs were greater than 9 dB (see Table 3) and would have therefore produced no or little perceptual differences. It is considered that if the front main layer microphones had been angled more downwards, thus making ICLDs between the main and height channels greater than, e.g., 9 dB, the 0m spacing might have not been significantly different from the other spacings in perceived spatial impression.
The result that the spaced microphone layers did not have significant differences seems to be associated with the am-bient sound component rather than the direct component. It was shown in Fig. 10 that the ambient sound energies of the binaural impulse responses of reproduced sounds (BIRRSs) were almost constant for all spaced layers. Furthermore, the magnitudes and patterns of the spectral changes of ambi-ent sounds that were caused by differambi-ent layer spacings did not vary much, as shown in Fig. 12(a). However, the verti-cal interchannel decorrelation of ambient sounds does not appear to directly explain the perceived spatial impression results. It was shown in Fig. 9 that the microphone spacings of 0.5m, 1m, and 1.5m caused little variation in the mid-dle frequency band ICCCs, between the main and height channel signals measured for the ambient sound compo-nents. This pattern initially seems to correspond to the per-ceived results. However, it was also apparent that the low band ICCCs decreased almost linearly as the microphone spacing increased, which does not explain the perceived results. The effectiveness of ICCC on the perceived ver-tical width change has not yet been fully investigated for musical sources. However, the present authors [15] found from subjective experiments using band-passed pink noise sources that perceived differences between different de-grees of ICCC for vertical image spread were relatively small compared to that for horizontal effect. Based on this, it is suggested that the perceptual effect of vertical ICCC between the main and height microphones on the current results was not strong. This also gives rise to the question about whether ICCC would be an effective measure for predicting perceived vertical spatial impression in general, which requires a further investigation.
The results are also discussed in terms of horizontal spa-tial impression. Fig. 11 showed that the 0m height layer produced the highest IACCE3; the difference between the
0m and 0.5m layers was 0.09, and those among the other spacings were in the region of 0.02 to 0.04. This initially seems to suggest that horizontal ASW perceived with the 0m layer would have been narrower than that with a more widely spaced layer. However, considering that the just no-ticeable difference (JND) of IACC is known to be around 0.075 [24], it is thought that the perceived differences in
horizontal ASW caused by the IACC changes were mini-mal. For the IACCL3results, there was no obvious change
observed for different layer spacings, thus suggesting no perceptible horizontal LEV change.
However, it should be noted that the above IACC mea-sures only consider three middle octave frequency bands. Research by Morimoto and Maekawa [25] suggests that the levels of low frequency components of a source signal has an independent effect on the perception of ASW; increases of low frequency levels can cause greater increases of hor-izontal ASW than those at higher frequencies. This might be related to the dependency of the spatial impression re-sults on the sound source, which can be seen in Fig. 6; the percussion and acoustic guitar sources had more obvious microphone spacing effects than the trumpet and strings. Fig. 13 showed that for the former, the ear input signal pro-duced by the coincident layers had greater spectral magni-tudes than that of the spaced layers at frequencies between 100 Hz and 300 Hz, whereas the latter did not show such differences. From this, it can be suggested that the spatial impression results were associated with horizontal ASW as well as vertical ASW, mainly due to the increase in low fre-quency level in the ear input signals. In addition, it is also suggested that such transient sources as the percussion and guitar also produced stronger LEV than the more continu-ous trumpet and string sources, since ambient sounds could be more clearly heard between the offset of one sound event and the onset of the following event.
4.2 Preference
Similarly to the spatial impression results, there was no significant difference observed between any of the spaced layers. The 0m height microphone layer was found to be slightly, but significantly preferred to the spaced layers, and this was most obvious between the 0m and 1.5m results for the trumpet and percussion sources. Formal elicitation of preference attributes was not conducted in the present study. However, the subjects were informally asked to comment on the main reasons for their preference judgment after the listening test. Most of them commented on extended height or vertically perceived image spread, but also a number of comments were given on tonal attributes such as clarity and fullness.
coincident layer to the main layer across the whole fre-quency. However, the spaced layers, which had a time delay between the main and crosstalk signals, caused somewhat destructive magnitude changes to the main layer at a num-ber of frequency regions. Therefore, it is thought that if the crosstalk level of each spaced layer had been as high as that of the coincident layer, then there would have been more audible and negative coloration effects, potentially lowering the preference.
In addition, the spectrum with the coincident layer was shaped so that certain frequency regions were emphasized. For example, the coincident height layer for the percus-sion quartet produced magnitude gains at frequencies be-tween 100 Hz and 300 Hz and also bebe-tween 1 kHz and 2 kHz, which could have resulted in increases in fullness and clarity, respectively. Similarly, the trumpet source had magnitude gains mainly at frequencies between 400 Hz and 500 Hz and those around 2 kHz when the coincident layer signals were combined with the main layer signals at the ear.
4.3 Practical Implications for a 3D Microphone Array Design
From the discussions above it might be suggested that in practical recording situations where vertical interchannel crosstalk is inevitably present due to the desired angle and polar pattern of height microphone (e.g., upward-facing car-dioids as in the current experiment), a vertically coincident 3D main microphone array could be beneficial compared to a vertically spaced array since coincident signals cause no comb-filtering at the ear. The coincident nature of main and height channel signals will also be useful for 3D to 2D downmix applications.
However, a fundamental solution to avoid a tone col-oration would be to reject vertical crosstalk by choosing the polar pattern and angle of height microphone appropri-ately, although in this case the microphone could no longer face directly upwards as recommended in [3]. For exam-ple, in a coincident setup, a maximum ICLD between the main and height microphones could be achieved by using a so-called “back-to-back” cardioid configuration, with the microphones’ subtended angle being 180◦. Alternatively, a figure-of-eight height microphone could be configured in such a way that its null-point faces toward the source so that direct sound could be maximally suppressed. In this case, however, the rear lobe of the height microphone might pick up undesired floor reflections or audience noise.
Additionally, in cases where a vertically spaced array is utilized to achieve greater channel separation (e.g., lower ICCC), it is considered that the omni polar pattern would not be an ideal choice for height channel microphones since it would mainly produce a vertical ICTD rather than an ICLD. It is evident from [12, 13] that the precedence effect does not fully operate in a vertical stereophonic setup; a time delay applied to the height channel does not cause the phantom image to be fully localized at the position of main loudspeaker. The lack of vertical ICLD also means that the level of vertical interchannel crosstalk is not suppressed
sufficiently. A delayed vertical crosstalk without any level suppression would cause strong comb-filtering when it is summed with the main channel signal at the listener’s ear, which might be perceptually unpleasant.
4.4 Limitations and Further Works
Limitations of the current study and further works are dis-cussed as follows. The direction of the height microphone was an experimental constant in this study; all of the height microphones were angled directly upwards to capture re-flections from the same direction. This inherently gave rise to different degrees of interchannel crosstalk in the height channel signals due to the use of the cardioid polar pattern. The D/R energy ratios of the front height channel signals were also relatively high, which means that the influence of ambient sound on the perceived result might have been less dominant than that of the direct sound for those chan-nels as discussed in the above sections. This suggests that the perceived results were mainly source-related. In or-der to investigate the effect of vertical microphone spacing for environment-related attributes without the influence of interchannel crosstalk, two types of experiments are pro-posed. First, the microphone setup of the current study will be modified in such a way that the null-points of the height microphones of each layer faces toward the sound source in order to maximally reject the direct sound form the source. Second, a 3D ambience microphone array will be designed and placed beyond the critical distance of a large recording venue, where the D/R ratio is below 1, in order to capture diffused sound mainly. For this, a conventional ambience microphone array called “Hamasaki Square” [7], employing four side-facing figure-of-eight microphones ar-ranged in a square formation, will be augmented with four additional height channel microphones placed at different spacings from it.
Since the scope of the current study was a 3D main microphone array design, the height channel microphones were placed within a relatively small range of vertical spac-ing between 0m and 1.5m. In recordspac-ing venues with high ceilings, however, some recording engineers might place height microphones at a large vertical distance from the main microphones for a maximum vertical channel sepa-ration. In order to test the effectiveness of this approach, a future experiment will include a wider range of height microphone spacings (e.g., microphones placed beyond the vertical critical distance).
is a vertically long instrument, the organ is considered to be a useful sound source for future 3D recording experiments. Height channel microphones should be configured so that the vertical spread of the original source image could be represented effectively.
5 SUMMARY AND CONCLUSIONS
The present study investigated the effect of spacing be-tween main and height channel microphone layers on per-ceived spatial impression and preference in the context of a 3D main microphone array. Multichannel room impulse responses, as well as string and percussion quartets, were recorded in a concert hall using a nine-channel microphone array. A five-channel main array was vertically augmented, with four upward-facing cardioid microphones placed di-rectly above the front left, front right, rear left, and rear right microphones. The spacings between the main and height microphones tested were 0m, 0.5m, 1m, and 1.5m. Impulse responses of each position were convolved with anechoic trumpet and acoustic guitar signals. Listening tests were conducted on perceived spatial impression and preference in a dry listening room using a nine-channel loudspeaker setup. The recorded impulse responses were analyzed for their signal energies, interchannel level dif-ferences (ICLDs), and interchannel cross-correlation co-efficients (ICCCs). Binaural recordings of the test stimuli were also made at the listening position. The energies and interaural cross-correlation coefficients (IACCs) of the ear signals were measured. The magnitudes of spectral changes caused by the addition of each height microphone layer to the main layer were also investigated.
The listening test results were statistically analyzed and discussed together with the physical measurement results. It was shown that the layer spacings of 0.5m, 1m, and 1.5m did not produce significant differences in perceived spatial impression. The 0m layer was found to be slightly greater than or similar to the spaced layers depending on the type of source. These results were explained from a viewpoint of the perceptual effect of vertical interchannel crosstalk (direct sounds in the height channel signals); the ICLDs between the main and 0m height layer signals were not large enough to completely suppress the potential effects of crosstalk, whereas those for the spaced pairs were suf-ficiently large, thus no or little audible effects produced by crosstalk. The levels of ambient sounds analyzed for main and height microphone signals as well as those for ear input signals were found to be almost constant. IACCs measured for the ambient part of the ear input signals were also found to be similar for different layer spacings. These results suggested that vertical microphone layer spacing had little effect on the perception of environment-related spatial impression. Additionally, ICCCs measured for ver-tical and diagonal microphone pairs did not seem to explain the perceived results directly.
The preference results showed similar patterns to the spatial impression results overall; there was no significant difference between spaced layers, whereas the coincident layer was slightly preferred to the spaced layers
depend-ing on sound source. Informal comments collected from the subjects suggested that the main preference attributes were tonal quality as well as spatial quality. The results were discussed in relation to the delta spectrum measure-ments, which showed that the addition of the coincident microphone layer to the main layer had a positive spectral influence on the ear input signal, whereas that of a spaced layer caused substantial comb filtering effects in the result-ing spectrum.
6 ACKNOWLEDGMENT
This work was supported by the Engineering and Phys-ical Sciences Research Council (EPSRC), UK, Grant Ref. EP/L019906/1. The authors thank the music technology students and staff at the University of Huddersfield who participated in the listening tests and Dr. Francis Rumsey for his advice on statistical analysis. They are also grateful to the editor and two anonymous reviewers of this paper for their insightful and constructive comments, which greatly helped improve the manuscript.
7 REFERENCES
[1] ITU-R, “Recommendations BS.2159-4: Multichan-nel Sound Technology in Home and Broadcasting Applica-tions,”International Telecommunications Union(2012).
[2] B. V. Daele and W. V. Baelen, Productions in Auro-3D, URL: http://www.auro-3d.com/professional/technical-docs/ 2012.
[3] G. Theile and H. Wittek, “Principles in Surround Recordings with Height,”presented at the 130th Conven-tion of the Audio Engineering Society(2011 May), conven-tion paper 8403.
[4] M. Williams, “The Psychoacoustic Testing of the 3D Multiformat Microphone Array Design, and the Basic Isosceles Triangle Structure of the Array and the Loud-speaker Reproduction Configuration,” presented at the 134th Convention of the Audio Engineering Society(2013 May), convention paper 8839.
[5] P. Geluso. “Capturing Height: The Addition of Z Microphones to Stereo and Surround Microphone Arrays,”
presented at the 132nd Convention of the Audio Engineer-ing Society(2012 Apr.), convention paper 8595.
[6] S. P. Lipshitz, “Stereo Microphone Techniques: Are the Purists Wrong?”J. Audio Eng. Soc., vol. 34, pp. 717– 743 (1986 Sep.).
[7] K. Hamasaki, “Multichannel Recording Techniques for Reproducing Adequate Spatial Impression,”Proc. of the Audio Engineering Society 24th International Conference: Multichannel Audio—The New Reality(2003 June).
[8] F. Rumsey and W. Lewis, “Effect of Rear Micro-phone Spacing on Spatial Impression for Omnidirectional Surround Sound Microphone Arrays,” presented at the 112th Convention of the Audio Engineering Society(2002 Apr.), convention paper 5563.
[10] J. Blauert, Spatial Hearing, rev. ed. (MIT Press, Cambridge, MA, 1997).
[11] J. L. Barbour, “Elevation Perception: Phantom Im-ages in the Vertical Hemisphere,”Proc. of the Audio Engi-neering Society 24th International Conference: Multichan-nel Audio—The New Reality(2003 June).
[12] H. Lee, “The Relationship between Interchannel Time and Level Differences in Vertical Sound Localization and Masking,” presented at the 131st Convention of the Audio Engineering Society(2011 Oct.), convention paper 8556.
[13] R. Wallis and H. Lee, “Investigation into Vertical Stereophonic Localization in the Presence of Interchannel Crosstalk,”presented at the 136th Convention of the Audio Engineering Society(2014 Apr.), convention paper 9026.
[14] F. Wendt, M. Florian, and F. Zotter, “Amplitude Panning with Height on 2, 3, and 4 Loudspeakers,”Proc. of the 2nd International Conference on Spatial Audio(2014). [15] C. Gribben and H. Lee, “The Perceptual Effects of Horizontal and Vertical Interchannel Decorrelation Us-ing the Lauridsen Decorrelator,” presented at the 136th Convention of the Audio Engineering Society(2014 Apr.), convention paper 9027.
[16] A. Farina, “Advancements in Impulse Response Measurements by Sine Sweeps,” presented at the 122nd Convention of the Audio Engineering Society(2007 May), convention paper 7121.
[17] H. Lee, “A New Microphone Technique for Effec-tive PerspecEffec-tive Control,”presented at the 130th
Conven-tion of the Audio Engineering Society(2011 May), conven-tion paper 8337.
[18] V. Hansen, and G. Munch, “Making Recordings for Simulation Tests in the Archimedes Project,”J. Audio Eng. Soc., vol. 39, pp. 768–774 (1991 Oct.).
[19] T. Hidaka, L. Beranek, and T. Okano “Interaural Cross-Correlation Lateral Fraction, and Low- and High-Frequency Sound Levels as Measures of Acoustical Quality in Concert Halls,” J. Acoust. Soc. Am., vol. 98, pp. 988– 1007 (1995).
[20] ITU-R, “Recommendations ITU-R BS.1116: Meth-ods for the Subjective Assessment of Small Impairments in Audio Systems including Multichannel Sound Systems,” International Telecommunications Union (1994).
[21] A. W. Bronkhorst and T. Houtgast, “Auditory Dis-tance Perception in Rooms,”Nature, vol. 397, pp. 517–520 (1999).
[22] B. Gardner and K. Martin, URL: http://sound. media.mit.edu/resources/KEMAR.html. 2000.
[23] H. Lee and F. Rumsey, “Investigation into the Ef-fect of Interchannel Crosstalk in Multichannel Microphone Technique,”presented at the 118th Convention of the Audio Engineering Society(2005 May), convention paper 6374.
[24] T. J. Cox, W. J. Davies, and Y. W. Lam, “The Sen-sitivity of Listeners to Early Sound Field Changes in Audi-toria,”Acoustica, vol. 79, pp. 27–41 (1993).
[25] M. Morimoto and Z. Maekawa, “Effects of Low Frequency Components on Auditory Spaciousness,” Acus-tica, vol. 66, pp. 190–196 (1988).
THE AUTHORS
Hyunkook Lee Christopher Gribben Hyunkook Lee received a B.Mus. degree in music and
sound recording (Tonmeister) from the University of Sur-rey, Guildford, UK, in 2002, and his Ph.D. degree in audio engineering and psychoacoustics from the Institute of Sound Recording (IoSR) at the same University in 2006. From 2006 to 2010, Dr. Lee was Senior Research Engineer in audio R&D at LG Electronics, South Korea. Currently, he is Senior Lecturer in music technology and the leader of the Applied Psychoacoustics Lab (APL) at the University of Huddersfield, UK. Dr. Lee has also been a freelance recording engineer since 2002. His current research includes spatial audio psychoacoustics, 3D sound recording and image rendering techniques, and interactive virtual acoustics. He is an active member of the Audio Engineering Society and a fellow of the Higher Education Academy, UK.