Studies on T-even Bacteriophage DNA
Thesis by
Jungsuh Park Kim
In Partial Fulfillment of the Requirements
For the Degree of
Doctor of Philosophy
California Institute of Technology
Pasadena, California
1972
ii
Acknowledgments
Although words may not adequately describe my indebtedness to the many people who helped make this work possible, I feel
pleasantly obliged to mention some of them here:
My foremost gratitude goes to Professor Norman Davidson who so kindly and continuously supplied valuable suggestions, guidance and encouragement throughout the course of this study.
I deeply appreciate the help of Professor William Wood, Drs. Steven Beckendorf and John Wilson in preparing Part I of this Thesis. Thanks are due also to Drs. Ray Bowman, Tom Broker, Davis Hershey, and Sheldon York for their patience in correcting parts of this Thesis.
iii
Abstracts
Part I.
The regions of sequence homology
and non-homology
between the
DNA molecules of T2,
T4, and T6 have been
mapped by
the
electron microscopic heteroduplex method.
The heteroduplex
maps
have been oriented with respect to the
T4
genetic map. They
show characteristic, reproducible patterns of
substitution and
deletion
loops.
All
heteroduplex molecules show
more than 85%
homology.
Some of the
loop patterns in T2/T4 heteroduplexes are similar
to
those
in T4/T6.
We find that the rII, the lysozyme and ac genes, the D region,
and gene 52 are homologous in T2, T4, and T6. Genes 43 and 47 are
probably homologous between T2 and T4. The region of greatest
homology
isthat bearing the late genes. The host range region,
which comprises a part of gene 37 and all of gene 38,
isheterologous
in T2, T4, and T6. The remainder of gene 37
is
partially
homolo-gous in the T2/T4 heteroduplex (Beckendorf, Kim and Lielausis,
1972)
but it is heterologous in T4/T6 and in T2/T6. Some of the
tRNA
genes are homologous and some are not. The internal protein
genes in general seem to be non-homologous.
iv
terminally repetitious region in T2 is larger. There is a length
distribution of the terminal repetition for any one phage DNA,
indicating a variability in length of the DNA molecules packaged
within the phage.
Part II.
~coli cells infected with phage strains carrying
extensive deletions encompassing the gene for the phage ser-tRNA
are missing the phage tRNAs normally present in wild type infected
cells. By DNA-RNA hybridization we have demonstrated that the
DNA complementary to the missing tRNAs is also absent in such
deletion mutants. Thus the genes for these tRNAs must be clustered
in the same region of the genome as the ser-tRNA gene. Physical
mapping of several deletions of the ser-tRNA and lysozyme genes,
by examination of heteroduplex DNA in the electron microscope, has
enabled us to locate the cluster, to define its maximum size, and to
order a few of the tRNA genes within it. That such deletions can be
isolated indicates that the phage-specific tRNAs from this cluster
are dispensable.
v
Part IV.
A population of double-stranded ¢X-RF DNA
molecules carrying a deletion of about 9% of the wild-type DNA has
been discovered in a sample cultivated under conditions where the
phage lysozyme gene is nonessential.
The structures of deleted
monomers, dimers, and trimers have been stud
i
ed by the electron
microscope heteroduplex method.
The dimers and trimers are
shown to be head-to-tail repeats of the deleted monomers. Some
vi
Table of Contents
Acknowledgments
Abstracts
Part I. Sequence Homology Studies between T2, T4 and
ii iii
T6 DNAs by Electron Microscopy
. • . . . .
1(a) The T2/T4 Heteroduplex
11(b) The T4/T6 Heteroduplex
(c) The T2/T6 Heteroduplex
. . .
(d) Molecular Weight Determination of
T-even DNAs by Electron Microscopy
Part II. Bacteriophage T4 Transfer RNA-Clustering
of the Genes for the T4 Transfer RNA
42
46
67
81
Part III. Structure of Bacteriophage T4 Genes 37 and 38 .
115
Part IV. Electron Microscopic Studies of Heteroduplex
DNA from a Deletion Mutant of Bacteriophage
<f>X-174
. . .
. . .
.
.
. . .
. . . .
.
Propositions
. . .
.
. . .
-
.
.
. .
. . .
.
.
. .
1
Part I
2
The
regions
of sequence
homology
and non-homology between
the DNA
molecules of
T2, T4,
and
T6 have been mapped
by the
electron microscopic
heteroduplex method. The heteroduplex
maps
have been oriented with
respect to the T4 genetic map.
They show
characteristic, reproducible patterns of substitution and deletion
loops.
All heteroduplex molecules show more than 85% homology.
Some of
the loop
patterns in T2/T4
heteroduplexes
are similar to
those
in T4/T6.
We find that the rll,
the
lysozyme and ac genes, the D region,
and gene 52 are homologous in T2, T4, and T6. Genes 43 and 47 are
probably homologous between T2 and T4. The region of greatest
homology is that bearing the late genes. The host range region,
which comprises a part of gene 37 and all of gene 38,
isheterologous
in T2, T4, and T6. The remainder of gene 37 is partially
homolo-gous in the T2/T4 heteroduplex (Beckendorf, Kim and Lielausis,
1972) but it is heterologous in T4/T6 and
in
T2/T6. Some of the
tRNA genes are
homologous
and some are not. The internal protein
genes in
general seem to be non-homologous.
3
4
Introduction
The bacteriophages T2, T4, and T6 are known to be closely related by the criteria of serological cross-reaction, genetic
complementation, genetic recombination and morphology. Genetic relatedness can also be investigated by DNA-DNA homology. In the case of T-even phages, such studies have been made by classical hybridization experiments (Schildkraut, Wierzchowski, Marmur, Green and Doty, 1962; Cowie, Avery and Champe, 1971). A more
penetrating study of the DNA-DNA homology between related phages can be made by the electron microscope heteroduplex method (Davis and Davidson, 1968; Westmoreland, Szybalski and Ris, 1969; Davis, Simon and Davidson, 1971; Davis and Hyman, 1971).
The closely related lambdoid phages undergo genetic recom-bination and can complement each other genetically. The regions of
homology in several lambdoid phages have been mapped by electron microscopy (Simon, Davis and Davidson, 1971). Perfect DNA
sequence homology was found in most of the essential genes and homology in some silent regions. The regions of homology and non-homology are large, at least gene size.
5
T2, T4, and T6 are expected to be perfectly homologous in
most essential genes and non-homologous
in the regions whichgenetic studies have already shown to be non-homologous such as the
host range region and exclusion genes (Russell, 1967). Less
6
T-even DNAs contain glucosylated hydroxymethylcytosine
(HMC), but the pattern of glucosylation is species-specific
(Sinsheimer, 1954; Lehman and Pratt, 1960). All three phages
induce an HMC-a:-glucosyl transferase. T4 induces an additional
HMC-p-glucosyl transferase, while T6 (and probably T2) induces a
"di-glucosylating" enzyme (Kornberg, Zimmerman and Kornberg,
1961; Zimmerman, Kornberg and Kornberg, 1962). T4 excludes
T2 and T6 very strongly, while T6 excludes T2 weakly (Russell,
1967). All these observations suggest that there is closer genetic
relationship between T2 and T6 than between the other pairs. A
similar conclusion was drawn by Cowie et al. (1971) from their
DNA-DNA hybridization studies.
In this paper we present our results on base sequence
homol-ogy between T-even DNAs as studied by the electron microscope
heteroduplex method. We compare the physical map with that derived
from genetic studies. Physical measurements of the molecular
weight, the genome size, and the size of the terminal repetition for
each T-even phage are also presented.
Materials and Methods
(a) Phages
7
psub.68, psub.A27, psub.A33, and psub.All9 were obtained from
Dr. John Wilson.
Several hybrid phages between T2 and T4 were used. Hybrids
in the host range region, T2h
4+
and T4r22
[
Bx28T2Lh
2+](T4h
2+)were
obtained from Dr. Frank Stahl through Dr. William Wood. T2L was
crossed to T4BrH23, rH88, and r638 by Dr. John Wilson. T2am
+progeny were selected on a restrictive host at low temperature by
Dr. Steven Beckendorf from crosses of T2 bearing am mutations in
genes 43 and 47 and a temperature-sensitive mutation in gene 34 with
UV-irradiated wild type T4D.
(b) Bacteria
~
coli BB, S/4, S/6 and CR63r- were obtained from
Dr. William Wood.
(c) Media
Hershey broth, used for phage and bacterial growth, and
enriched Hershey top and bottom agar, used for plating assays,
8
Citrate top and bottom agar used for preparation of plate stocks of the lysozyme deletion mutant contained the following: a) citrate bottom agar; 10 g tryptone. 11 g Noble agar, 5 g NaCl and 1 £ H20, all autoclaved and cooled to 55
°,
with 50 m£ 1 M Tris, pH 8. 0 and 10 m£ 25% sodium citrate dihydrate being added just before pouring; b) citrate top agar; same as bottom agar except with 7 g agar.( d) Growth of bacteriophage
E. coli BB were grown to about 2 x 10⁸ cells/m£ in Hershey broth and then infected with 2 to 5 bacteria. In growing the T4B strain, 20 µg/m£ L-tryptophan was added 2-3 min before infection. 30 minutes after infection, 1 M Tris, pH 8. 5 was added to raise the pH of the culture medium to between 7. 5 and 8. 0 to minimize intro-ducing single-strand breaks in DNA (Drs. Hyman and Davis have suggested that after phage infection, when bacterial lysis occurs, phage are usually exposed to a slightly acidic medium. Under this condition DNA is depurinated, so that a break in the phosphodiester chain is introduced upon treatment with alkali). A few drops of chloroform were added to lyse the remaining unlysed cells.
The phage were purified by several cycles of differential centrifugation and stored in 0.1 M NaCl, 0. 01 M MgS04 and 0. 01 M Tris, pH 8. 5.
9
Lielausis,
1963).
(
e)
Hybridization
When
a
mixture of
two closely
related
phage DNAs,
AA' and
BB'
is
denatured and renatured,
the renatured
sample will contain
homoduplexes,
AA' and BB' and
heteroduplexes,
AB' and A 'B.
To prepare such heteroduplexes, a solution containing equal numbers
of
two
different phages
(total
phage concentration about
~x
10
10phages/mf) was made 0.1 Nin NaOH, 0. 01 Min EDTAto
lyse
the
phage and
to
denature
the
DNA.
The
solution was
left
at room
temperature
for 10 min after which it was neutralized by adding 100
µ£1.
8 M Tris-HCl,
O.2 M Tris base and 1 m£ of formamide per mf
of phage solution. The phage DNAs were renatured by dialysis
against 0. 9 M NaCl,
O.1 M Tris, pH 8. 5, 0. 01 M EDTA and 60%
formamide at room temperature for 1 hr. Finally, the renatured
DNA was dialyzed against
O.1 M NaCl,
O.01 M Tris, pH 8. 5 and
0. 001 M EDTA to remove formamide.
(f) Electron microscopy
10
internal
l
ength standards
(5200 bases
long,
Davidson and Szybalski,
1971).
Grids
picked
up
from
th
e
protein
film
were
stained with uranyl
acetate and shadowed with Ft-Pd. Photographs were taken
using a
Philips EM300. Negative
images
of
the DNA molecul
es were
traced
with the
aid of a
Nikon Shadowgrap
h
.
One per cent
formamide lowers the melting temperature of
native DNA by 0. 7
°
C
(Mcconaughy, Laird and
McCarthy,
1969).
The
cation concentration of the spreading solution described above
is
0. 06 M.
The melting temperature of sheared T4DNA at 0. 06 M
[N
a+]
is 75. 5° (Wetmur and Davidson, 1968). Our mounting condition
of DNA at 25 °C is therefore
equivalent to T m-23
°.
The denaturing
power
of the hypophase
described above
is about the same as that of
the
spreading solution.
11
Results
(a) The T2/T4 Heteroduplex
The T2/T4 heteroduplex map shows a characteristic and
reproducible pattern of substitution and deletion loops. The electron
micrograph shown on Plate 1 is an entire circular heteroduplex
molecule carrying the T4BrH23 deletion (a deletion of length 4200 base
pairs in both the rIIA and B cistrons). The rH23 deletion loop is
indicated by an arrow. Both T2 and T4 DNAs are circularly permuted
and terminally repetitious (MacHattie, Ritchie and Thomas, 1967),
so that unbroken heteroduplex molecules form circles having two
single-strand branches.
The heteroduplex map, constructed from
the loop patterns in a number of whole molecules and by matching
overlapping patterns from many broken molecules, is shown in Fig.
1.
About 87% of the T4DNA molecule is homologous to T2DNA.
The
positions of the loops are reproducible except for one or two regions
which will be described later.
To orient this physical heteroduplex map with respect to the
genetic map (Edgar and Wood, 1966), three T4rII deletions and the
deletion eG19 in the lysozyme gene of T4 were used. The deletion
12
Plate 1. T2/T4BrH23
heteroduplex
circular molecule.
The
letters
("A" and "H")
identify
the
loops
in Fig. 2.
Double- and single-stranded circular <t>X-1 74 DNA
molecules are in the background. Two single-stranded
branches corresponding to terminal repetition region are
indicated
by thinner arrows, and rH23 deletion loop
13
·.-:: ... ·
.,.,.
:
.
,
..
.
·-.
-,-'.:·"~.:
.
:
:
>: ..
~::.
.
.
, '
?J
•
-
~~
, ..
. ,
''"'
X
•
"-'"
X
~
,,
" .
14
Fig. 1. T2/T4 heteroduplex map oriented relative to
the
T4 genetic map (Edgar and Wood, 1966; Wood and Edgar,
1967).
In the
heterodupl
ex
map, outer and
inner
arcs
represent a longer strand and a shorter strand,
respectively. The surrounding duplex segments are
separated by the average of the two arms of a substitution
15
16
cistron. Deletion r638 deletes all of the rIIB cistron
and extends
into
region D.
Electron micrographs of the
T2/T4B, T2/T4BrH23,
T2/
T4BrH88 and T2/T4Br638
heteroduplexes around the
rII region
are
shown in Plate 2. Figure 2
is
a schematic representation
of
the loop
patterns of these heteroduplexes. Since the
rH23 deletion loop lies
between deletion loop A and substitution loop H of the regular T2/T4
heteroduplex map, these two features can be used
as
position markers.
The deletion rH88 loop is closer to loop A than is the deletion r638
loop.
Therefore the direction loop A
-
loop H corresponds to the
rIIA
-
rIIB cistron. This orients our physical map relative to the
genetic map (see Fig. 1).
If
the right
end of
the deletion rH23 coincides
with
that
of the
rIIA cistron, we estimate the
size
of rIIA cistron to be
2400
base
pairs.
Ifthe deletion rH23
extends
beyond the right
end of rIIA
cistron, it will be smaller. The deletion r638 starts
at
the
beginning
of rIIB cistron (Benzer, 1961) and extends into
halfway of the D
region.
Thus
the
rIIB cistron should be smaller than r638 deletion
(960 base pairs). The region D adjacent to the rIIB
cistron
has been
identified as a DNA sequence which is
transcribed
early
during
infection.
The region D
is
subdivided into three regions; D
1(a
delayed-early gene), D
2a and D
2b (immediate-early
gene)
(Sederoff,
Bolle and Epstein, 1971).
Itseems that the left end
of
the rH23
deletion is located at the boundary between D
1and D
2a
regions
17
18
19
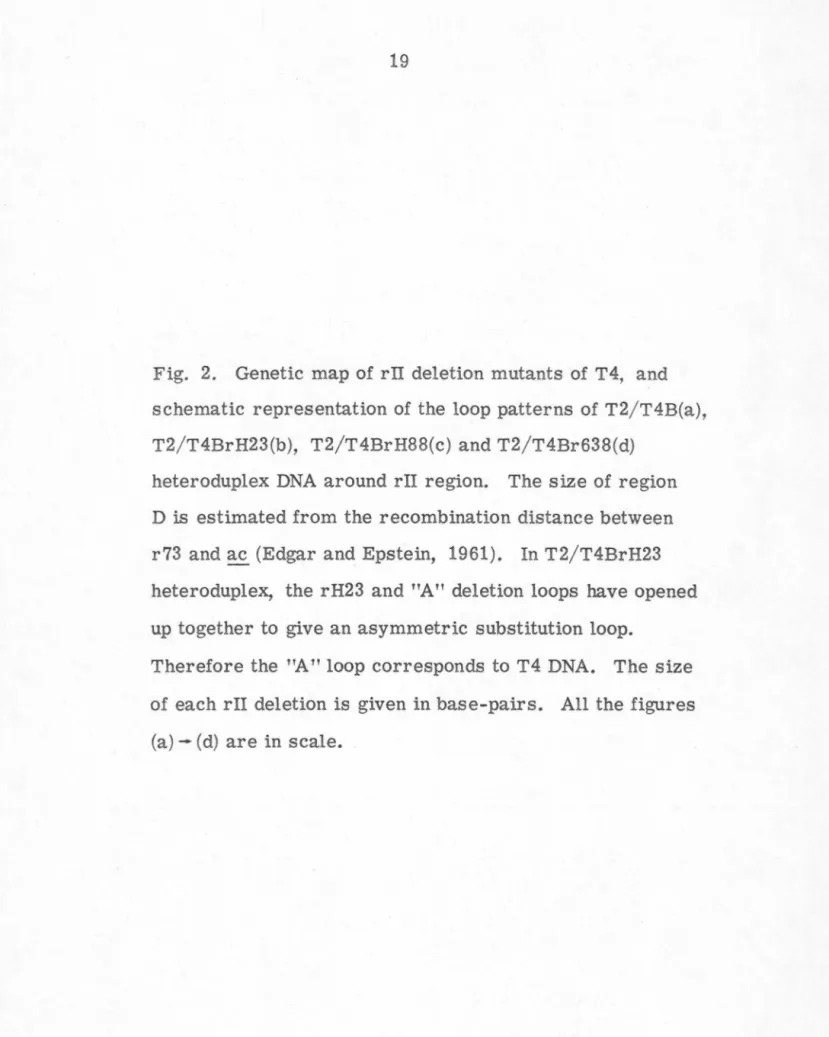
Fig. 2. Genetic map of rII deletion mutants of T4, and
schematic representation of the loop patterns of T2/T4B(a),
T2/T4BrH23(b), T2/T4BrH88(c) and T2/T4Br638(d)
heteroduplex DNA around rII region. The size of region
D
isestimated from the recombination distance between
r73 and ac (Edgar and Epstein, 1961). In T2/T4BrH23
heteroduplex, the rH23 and "A" deletion loops have opened
up together to give an asymmetric substitution loop.
H
I I
I I
(a) --1 -...,
\ I
I I
I I
I I
I I (b) __J --..,
I I
I I
I I
I I
(c) - - l -.,
I I
I I
I I
'
II I
\ I
. (d)
...,
~I I
\ I
20
rllB
rllA
A
I \
I \
~ rH23(4200) ... / ... / ... ... /
I \
I \
'----'
rH88(1400)
"
\ I\ I
I \
I \
~
r638(960)
"
\ I\I A
I \ I \
~
rIIB
~rllA21
rH23 and r638, we conclude that the size of the region D
1is at least
1000 base pairs.
There are
two
strains of T4, T4D
(Doerman)
and T4B
(Benzer). Most of the rII mutants of T4
have been isolated
from the
Benzer strain, while most of the amber and
temperature-sensitive
mutants have been isolated from the Doerman strain. They were
derived
from
a common ancestor, but T4D has
lost
its requirement
for
L-tryptophan. To investigate the sequence relationship between
T4D and T4BrH23,
the
T4D/T4BrH23 heteroduplexes were examined
in
the electron microscope. These heteroduplex molecules seem to be
entirely double-stranded throughout the molecule except for the rH23
deletion loop. We thus conclude by heteroduplex criteria that they
are homologous.
Should there be any regions of non-homology
smaller than 100 base pairs, they may not be resolved with our present
technique, especially when we do not know where to expect to find
non-homology. Another well-known rII deletion mutant, T4rEDdf41
(derived from T4D by Edgar, Feynman, Klein, Lielausis and
Steinberg (1962)) seems to be identical to T4BrH23 by heteroduplex
mapping.
Our measurements made on
the
T4BrH23/T4BeG19
hetero-duplex show that
~Gl9 is located 140° from the rH23 deletion.
22
Plate 3. Electron
micrographs
of T2/T4B(a) and
T2/T4-B~Gl9(band c)
heteroduplex
DNAs
around
the~gene.
Size of
the
double-stranded region
between
l
oops B and C
correspond to
1050
base pairs
in (a). In (b) there
is a
~Gl9deletion
loop (700 bases)
between
loops
Band C. The
double-stranded region between
loops
Band
~Gl9 isvariable in
length.
The
largest length
observed was 180
base-pairs. Frequently the
loops
B and eG19 opened up
together to give a symmetric substitution
loop
(indicated
·
by an arrow) shown
in
(c). Letters relate the
loop
pattern
in the micrograph to the schematic representation in
Fig. 3.
23
.•
.
·
::
·
·
·";.
-
.
·
...
· -:..
•
.
:
•
•.
•
.
• • ' • •.
• •.
.
.
.
.
•
.
•.
.
.
..; • ··• •• ·: : :. • • : .• •.• •• :" ·'.
.
··~
·: .. : : •. ;···
:~-.
• . • l ••
•
.
.
.
.
.
.
·.
.
..
.
-·
.
.
.
.
,
.
...
.
·
.
·
.
..
.
.
.
..
·
.
·
•
.
..-
-
.
.
.
. ••. . . .
.
. .
.
.
... ·.-
.
·
·
.
:
·. i.·: .·
·
,
.
:.
~·
·=
:
.
. ...
.
....
.
N
·
.
···~
:~
··
...
,;
.
~
·
..
.
~. ·~
....
:r"
.
·
.
·
··
· .
.
.
.
,
.
.
.
.
.
.
.
.
.
.
.
.
.
.
.:-.
....
• . •• ••
.
.
~~.f
".
·
•
· ·
,
•
.
:
-.
D
;
.
• :
:
·
• •• • ,
.
• • \"
.
.;
.
.
'
.
•
.
...
.
.
.
.
.
.
...
....
~
""..
.
.
.
....
...
·
.
.
·
·
.,
.·
.
....
..
·
.
.-
.
)
'
.
.
·;
.
·
.
• . ·:
.
.
.
~·
~
·
.
. •
·
C".:,r
.
f; • . : ; .... :-:· • • • • • •••;
.
.
.
.
.
..
. .
.
.
;.
.
..
'.·.
.
.
.
.
~:
"
:::
:~
\'.\.:.
".
·
.
.
:
'
.
.
:
.
.
'..
·.
:
.
.
_..
.
:
.
~
.
.
.
.
~
;
·
.
;..
.
.
:
.
:
..
..
.
.
.
·'
..
~
.
.
\.
.
.
'
' /
.
.
.
.
.
. .
.
.
.. ...
.
.
.
.
..
.
.
.
.
•
.
.
;.
.
..
·
,.
•
• ·. .. ; . ' . •·• . • ; • • . . • • •
....
• .... . • • • .. • • •.
'.
•.
. " ' ...
• l.
.. .• . , •• • •.
•.
.
•. I ..
.
. . • - -. ....
•..
.
.
.
.
.
.
.
.
.
.
.
...
..
.
.
.
.
..
.
.
.
..
·'
•
..
.
,. ..,,,,
....
.
..
a
f ..
.
.
•
~-rA~cl'
' -.... y•r
·.:.__.."6.l~ ~
·.·f1.
..
~·
• ••
...
••
.
J';
.
· . •.:~
~• ·•
·.
.·-
·
··~
.•·
••
.. .• •'
·
~
. :·
. . -•
-·
~~.
'
•
.
·
·
.
.
~-
·
.
-...
.
..
.
....
..
.
.
. .
·
~
..
'
.
..
-
..._,,
"
...
.
.
.
.
,
.
.
...
·
;:.
.
.
.
·.
·..
•
..
·.
~
.
~
,
.
.
••
....
.
.
•
·
s
·
.
•
:.
.•
.
..
•
.•• •
..
. .
..
,
•.•
.
~·
.·
:
•·1
~
·
'.
:).;.
y.
..~
.~·
~
·
•.
. ....
. '
.~·
-·
-
:
.~•
...• •
, ..
:
••,,
.:
'
·
.
..
.
·
:.
~.
''.
v·
·
· .
·
"
..
.. .
'1
··
...
··.:
•
··
.
.
·
.
••
.
•
..
··
=
.~.
C
•
.
•
.
..
..
..
-
.
.
. •()
·~'
....
·~··
. .
.
. ..,,
··
•
-
.:
·
.
.
.
. ..
.
.
..
"
.
.
.
.
.
....
.,,.
•
·
.
.
.-
..
,
.
.
..
•
"
. .
.~
·
·
..~s
·
~
·-
c
·.
~·
;
;
_
.
..
-·
·
·
~·
..
·
.-.
,;I'~
,
,
.·
.
·
.
·
.•
·
.
• •
.
·
:
•.
.
.
.
.
.
.
.
".
. · ' ".
.
.
.
.
..,.
.
...
.
,
..
..
.
.
·""
-.;
•.
·
.
'•
.
·
.. ·
"
·
':"'
•.
.
.
.
,:
.
..
.
; .
..
..
.
.
·.
c·
.
-~
·
.
..
,
·.·
.,.;·,
•·· ...
.
·
..
··
. •
..
.
.
.
. ' •'
.
..
.
,.
.
.
''
·,·~..
.. ~•
.
. .
•
.
,
.
.
•
.
·.
:
.
'
•
._
·.
•
:"'
.
~
.
~
•
.
b
r.~
:·
...
..
..
·
:
.
.•..
.
.
...
..
..
.
.
·•
:
...
.
.
.
.
•
.
.
\
.
.
:
-
•.
'··
...
-.
·~
·
.
.
.
•.
..
..
•
••
•
.
,• ..
.
.
~··
.
.
...
...
.
.
.
....
,.
.
·
...
.
··
.
.
.
.
..
.
.
,"
.
...
.
·
.
.
.
.
.
.
.
.;•·.~··
.
.
..
.
'./.
-
...
•
...
...
.
...
..
.
-
.
.
•
,
.
.
.
.
:....
.
.
.
·
•
....
. .
.
.
.
.
.
_...
.
.
..
.
.
.
.
.
.
..
.
.
.
.
,.-. .
..
' • ; • • •• . .. . ' . • . • • - : !' • .... • ••• .. ... • •
.
"
.
.
.
.
.
.
'•
-.
'.
.
•'
.
...
/.
.
.
..
.
\
~
::'.
~~
· .. •
.
~
·
··
.
:
:
.
.
~~:.:::-.?:·.
~
.
i
·
·· ..
--'! ••
.
Q..;~
·
.,
. .
.
• . •
a •. • e + , . f.'\ ., • - • • ' • . • • • I ,. •
....
-
·
v~·
..
..
it-/ - • ... ... • •~:
·
.
:
.
...
..
·
•
.
·
.
J
·
·
-
·
.
-
"
.
.•
.,..
.
•:
;
..
.
.
.
..
... ·
,
'
.
.
....
•
.
·;.: • .' ..
.
-
.
.
.
.
.
.
.
.._
.
-~
-
.
.
;
.
.
.
.
.
.
.
.
.
.
.
.
.
.
.
:
.
'.
.
.
.
.
.
.
.
.
. .
.
.
.
.
..
.
.
l .
.
.
.
.
' .. . ,
. .
.
. \.' . . .
.
.
.
.
.;
-
. . . . . . . . . ..
. .
..
.
.
.
..
.
..
.
.
:
"
.
.
.
.
•
.
.
..
.
.
.
.
.
.
.
I • • , ( • ~
•
•
•
.
•.
•
.
•
•
.
•
•
.
... • •
•
•
..
~
•
-
.
·
...
•
•
:
•• • • •
•
•
•
•
. .
•
•
•
c ...
••
•
24
Fig. 3. Schematic representations of the three
heteroduplex molecules for which electron micrographs
are shown in Plate 3.
(a) T2/T4B.
25
- Clockwise
84
c
0
E
Fr - 1
,...,
,..,
r---1 r---t\ I \ I I I I I I I
\ I \/ I I I I I I
(a) - - - I ---, I I ·~
,...,
,...,
w L-I I I I I I I I
I I I I I I I I
'-' 82
u L-.J L...-....Jc
I
J/
,...,
,...,
..---..,
I I I I I I II
'"
I I I I I I(b)
___,
--, ' I I L....J u'----••
I,..., ~ r-I
'"
I I I I I II II I I I I I I I
~w w L--1 L...J
OR
l!G19
c
'
~;
n r---1 .----iI I I I I I I
I
,,,
I I I I I I(c) __J I I I L...J w '
----.., I I,...,
,..,
26
(700 bases) was found between the loops B and C. This position is about 135
°
from the rII region around the circular map by the shorter spanning. This result confirms the map order that was obtained with the rII deletion mutants. The eG19 deletion loop and substitution loop B (with single-strand sizes of 1250 and 480 bases, respectively)often open up together to give a substitution loop in which both strands are about equal in length (Fig. 3c). From this observation it is
possible to deduce that the longer strand (B4) of the loop corresponds
to the T4 molecule and the shorter one (B2 ) to T2.
(i) Homology in the tail fiber and neighboring genes
Tail fiber assembly in T4 requires at least 6 phage genes; 34, 35, 36, 37, 38, and 57. Genes 34 and 37 code for the two major structural proteins. The products of T4 gene 37 and 38 (P37 and P38) interact during tail fiber assembly, and they are incompatible with P37 and P38 of T2 (Russell, 1967). Russell's ge_netic studies indicated that the host range determinants for T4 were closer to gene 38 than to gene 37 among the tail fiber genes. We therefore suspected that gene 37 and gene 38 should map in the large substitu-tion loop H of Figs. 1 and 2.
To test this, we examined heteroduplexes T2h4+ /T2rH23 and T4h2+ /T4rH23. The history of T2rH23 mutant will be described
later. T2h4+ and T4h2+ were made to be isogenic to T2 and T4,
27
it is
also possible that the loop H contained genes other than the host
range determinant. By heteroduplex methods, quite a few T4 and T2
genes were found in T2h4+ and T4h2+, respectively.
These conclusions were confirmed
by the more
extensitve
biochemical,
genetic and heteroduplex
studies
of
Beckendorf
et al.
(1972).
They showed that the host range
determinant
as well as
gene 38 maps
in
the loop H. The longer strand
(H
2 ,2600 bases)
comes from T2 and the shorter strand (H
4,1560 bases) from T4
(Beckendorf
et al.,
1972).
This observation
isconsistent with the
fact that the
molecular weight of P37 from T2 is
13,
000 daltons
(approximately
400 bases) larger than that from T4. The difference
in
length
between the
~and H
4arms of the substitution loop H
therefore suggests that gene 38 of T2 is also bigger than gene 38 of
T4. The results of Beckendorf et al. (1972) indicate that the rest of
gene 37 consists of homologous, partially homologous and heterogous
segments which map counterclockwise from loop H (Fig. 4).
There has been conflicting evidence as to the relative sizes
of T2 and T4 genes 34 and 35. Genetic recombination studies
suggest that their lengths were greater in T4 than in T2 (Russell,
1967). Mosig's physical mapping (1968)
however
indicated genes 34
and 35 of T4 are smaller than indicated by the genetic studies.
It wasthen
found
(Beckendorf
and Wilson, 1972),
that the
molecular weight
of P34 in T2 and T4 are same (130, 000 daltons) and that T4 gene 34
has a sharp gradient of increasing recombination near one end of its
28
between
T2
and
T4, suggesting that the genetic sequences are
homologous.
The following
physical
argument suggests
that the
gene 34 and
35 of T2 and T4 are at
least
partly
homologous and not
greatly
different
in
size.
The
sizes of
the
relevant
peptide
gene products
(Ward
and Dickson, 1971; King and Laemmli,
1971)
and corresponding
numbers of coding nucleotides for T4 are: P38, 240 amino acids,
720 nucleotides; P37,
1180
amino acids, 3540 nucleotides; P36,
220 amino acids, 660 nucleotides; P35, 360 amino acids, 1080
nucleotides (personal communication with Dr. Dickson); P34, 1360
amino acids, 4080 nucleotides (assuming an average residue
molec-ular weight of 110 per amino acid). Figure 4 shows these spacings on
the heteroduplex map, assuming that genes are contiguous. This map
suggests that gene 35 is homologous, and about 90% of gene 34 is
homologous.
There are three known genes between the rll cistron and gene
38: the D region, the ac gene (acriflavine resistant) and gene 52
(DNA-delayed). In T2/T4 heteroduplexes all three genes map in
homologous region about 8000 base-pairs long.
(ii)
Homology in genes 43 and 47
A triple mutant of T2 (amber mutations in genes 43 and 47
and a temperature-sensitive mutation in gene 34) was crossed to wild
type T4D, which had been subjected to an average of 17-19 lethal hits
of UV irradiation per molecule. The input ratio of T2 to T4 was
29
Fig. 4. T2/T4
heteroduplex
map
and translational
map
(based on the size of
peptide gene product
)
around
the tail
fiber
genes.
(a) Scale in base-pairs.
(b)
T2/T4 heteroduplex map. The deletion type
loop
in the
left
end corresponds to T4 DNA. This will be shown
in section (c). For the loop H, the spacing between
the surrounding duplex segments is equal to the length
of the T4 single-strand, i.e., H
4 •(c)
Translational map of T4. Map position of gene 37 is
drawn from Beckendorf et al. (1972).
(d) Partially homologous region of gene
37 in
the T2/T4
----I
31
restrictive to T2) at 30°C. Each plaque was replated on a mixture
of S/4 and S/6 at 30
°
C to select T2 phage
(clear plaque)
containing
T4 genes 43 and 47 (T4
phage
give
turbid plaques),
but still retaining
their
temperature sensitive mutation
(this
was
tested
by replating at
43°C).
Heteroduplexes
formed from three independently
isolated
hybrid
phages and T4 were examined. Loop
patterns
observed here
were
identical
to those from 9 to 1 o 'clock--that
is, in
the region
spanning
genes
43 and 47 on
the
wild
type
T2/T4
heteroduplex
map
(see
Fig.
1).
This result
indicates
that genes 43 and 47 in T2 are
homologous to T4 within the
limits
of our present
technique
.
(iii) Homology
in tRNA genes
32
We used several T4 tRNA deletion mutants (psut; ~8, psub.6.27,
psub.6.119 and psubA33) to study which T4 tRNA genes are homologous
to T2 tRNA genes. The physical map of the e and psub deletions has
been constructed and relative positions of tRNA genes have been
determined (Wilson et al., 1972a). Electron micrographs of the
heteroduplex molecules between T4 tRNA deletion mutants and T2
are in Plate 4. Their schematic representation of the loop patterns
is shown in Fig. 5. Figure 5(a) shows loop patterns around the tRNA
gene in T2/T4. The two arrows indicate the extreme limits of the
tRNA gene clusters. Figures 5(b)-(e) represent the position of each
deletion (colored area) in the T2/T4 tRNA deletion mutants
heteroduplex. All information shown in Figs. 5(a)-(e) is presented
together in Fig. 5(f). The loop E is an asymmetric substitution loop
(the difference in the size of the two strands is about 210 bases).
From the size of the loop E appearing in T2/T4 psui;A.8, it is possible
to conclude that the longer strand is from T2DNA. We have compared
the sizes of deletions psuj;.6.119 and psuj;.o.33 in T4 with the sizes of
the loops occurring due to deletion of the tRNA genes in T2/psub.6.119
and T2/psub.6.33 heteroduplexes, respectively. We suggest that the
longer strand of the loop F also corresponds to T2 DNA. Band 1- and
ser-tRNA genes are homologous and band 2- and gly-tRNA genes
map at a non-homologous region. The leu-tRNA gene could be
homologous in T2 and T4. The band 1- and band 2-tRNA genes have
not yet been characterized. McClain and Barrel (personal
33
Plate 4. Electron micrographs of the heteroduplexes
between T2 and T4 tRNA deletion mutants around tRNA
gene. The loops are labelled as
B-Fto correspond to
Fig. 5.
(a) T2/T4 heteroduplex around the tRNA genes. The
double-stranded region between loops E and
F(indicated
by an arrow) as well as E
4strand was decreased
slightly.
(b) T2/T4 psubA8 heteroduplex.
(c) T2/T4
psub~27heteroduplex.
(d) T2/T4
psub~ll9heteroduplex.
(e) T2/T4 psubA33 heteroduplex.
35
Fig. 5. Schematic representation of the loop patterns between T2 and T4 tRNA deletion mutants. The colored areas represent size and map position of the deletions. (a) T2/T4 heteroduplex around tRNA genes. The two
arrows indicate the extreme limits of the tRNA gene clusters.
(b) T2/ T4 psubA8 heteroduplex. Glycine- and ser-tRNA genes are deleted in T4 psubA8 (Wilson et al., 1972a). (c) T2/T4 psubA27 heteroduplex. Band 2-, gly- and
ser-tRNA genes are deleted in T4 psubA27.
(d) T2/T4 psubA119 heteroduplex. Glycine- and ser- and leu-tRNA gene are deleted in T4 psubA119.
(e) T2/T4 psubA33 heteroduplex. All the tRNA genes are deleted in T4 psubA33.
(f) The results in (a) -(e) are presented all together in (f). For the loops B, E and F the spacing between the surround-ing duplex segments is equal to the length of the T4 ssurround-ingle -strand, i.e., B4, E4 and F 4• For loops, such as C and D, where the identity of the strand(s) is not known, the
36
'
'
----. Clockwise F I I ....Jc
t, I I\D
,..,
I IF4 F1
nn
I I I I I
..._
_
__.
,
---
L..-....1 L..JL--~
r--n
r'1]r--1 I I
E2
I I \ I I ,Ii II 1 I 1 / \ 1 1 1 !1
L...I ...._ _ _ _, L...l y ~
F2
F~
I
~'
n
run
n
I 11 I I I 1 I I I
....J _ _ _ , ~--- ~ L-1 ~
- - . I I r----i r""J! r
-\ I \ I 1 I \ I \ \ I if I
\ I : \ I I I \ I \ \I I l I
' - - J ~ L-.J ~ ' L.JU
I
t,
n
rwnn
I I \ I I I D I I I
....J ..__ ... - - - ~ ...,
'---- '---- \ ,' : , I I / 1 1 \ 1 1 - : ' { l
' I I \ I I I \ I \ \I 1 II I
'---.J 1--' L....J '---' ' A..JU
,
t,
n
n.J.1Jn
I I \ I I I I I
_,..J - - - ' " " - - - I I
L...-~ I I ,...---, i
-\ I I \ I I I I I \ \ I 11 I
\ I I \ I I I I I \ \I I• I
\ - - 1 L...l L...1 I I~ ' Ul.J
I l
f'i
., . . .
,
r1 r i II II
1
1 I 1 I I I I I
I\ I I I I I I
::;
\ I,-...
:\
I';: =---1
\ I•1-•t ...
I I I /1 I I~ ~
II I\ I I \ I I I \ I \ \I 11\ I
\....--I L...l L...I .... _ _ _ , ~ ' L.l.U Band 2
Gly
'
•
,...,,
.~
...
~rse~
.,
I
r,
I I ij~eu1 I I I:::;, /---: ..
,---:
~r
.·
~, .~
:
' I I \ I I I \ I \ \ I !
r,
!
\.../ ... ..., L-.l. y ~
Bond 1
37
fewer than 10 nucleotides from a praline-tRNA. Ser-tRNA and some of the tRNAs in band 5 were not present in cells infected with T4
psuba53 (Wilson et al., 1972a). These two observations imply that the pro-tRNA gene might be on the right side of the ser-tRNA gene, which is a homologous region in T2/T4.
The overall picture then is that some of the tRNA genes of T4 are homologous to genetic sequences in T2 and some are not.
The loop F has a variable structure, consisting of up to 4 small loops, as shown below. The single-stranded regions can
x /
'
/'
/'J
I I\
I I \
J
F~
i i
r--:
I I I I - - - L__J t _ _
,,
'
/'
I I ....---\ \I I
I I
L - - or - - - J
,,", \
r--
--,
/ ' I I I < '..._ _ _ _ __,
I
I
_ _ _ J
----,
I I
I
I L . r
-\ \
r - - - i
I I I
I I I
L__J l - _
,..----,
\ I
\ I
, . . .
38
expand by opening up of the short double-stranded region between the
loops until there is finally one large loop. The patterns of loop
opening show that F; and F 4, and F 2 and F 4 could not belong to the
same DNA. The longer strand of the completely opened loop F
seems to be T2 DNA. We therefore suggest that F2 and F;
corres-pond to T2 DNA, and F 4 to T4 DNA. It is fair to assume that the
double- stranded regions between the loops F 2 and F 4, and between
the loops F; and F 4 are homologous (instead of only partially
homologous), because in T4 DNA, a region of known perfect homology
about 250 base-pairs long between rH88 and r638 deletion loops was
observed to open up completely about 50% of the time (unpublished
result) under the same denaturing conditions.
(iv) Homology in internal proteins
Three low molecular weight internal proteins (IP I, IP II and
IP III) are present in relatively large amounts within the phage head.
These basic proteins can bind to DNA at low salt concentrations, but
are completely dissociated from DNA at high salt concentration.
Black (1971) isolated mutants in the structural genes of each of the
internal proteins. Mutants in IP II and IP III gene were amber.
The single and double mutants grow normally on su- bacteria. The
three genes are arranged in the following order: -r48 II III e Iv 57-.
IP III undergoes assembly-dependent cleavage (Laemmli, 1971).
T2 DNA does not direct the synthesis of any T4 internal proteins
(Black and Gold, 1971). Black (personal communication through
39
deletion mutant phages (eG192, eG506, eG326, eG342 and eG19) and
looked for missing proteins. A physical map of these deletions has
been constructed (Wilson et al., 1972a). Figure 6 presents the loop
patterns of T2/ T4 e deletion mutants which show how much T4 DNA
is deleted and whether there are internal proteins missing.
The results show that the IP III gene is very close to the ~
gene, and the IP I gene is far from the IP II and IP III genes. IP I
contains about 90 amino acids (Black and Ahmad-Zadeh, 1971),
which correspond to 270 bases on the DNA template, in reasonable
agreement with the size of the IP I gene on the map. IP III consists
of about 160 amino acids (480 base-pairs) and its gene is adjacent to
the e gene. Thus one can map the IP III gene accurately. A spacer
of about 300 bases is between the IP II gene (220 base-pairs) and the
IP III gene. The results show that the gene for IP II is completely
non-homologous between T2 and T4; gene for IP III contain homologous
and non-homologous segments. The IP I gene seems to be homologous.
In T2, the sum of the B2 loop (480 bases) and the overlapping region
(180 base-pairs) between eG342 and eG19 is barely large enough to
correspond to the template for the synthesis of IP II and IP III.
It is also possible that the IP II and IP III genes are smaller in T2,
since polyacrylamide gel patterns of the T2L internal proteins showed
that they have mobilities different from those of T4 internal proteins
(Black and Ahmad-Zadeh, 1971). The internal proteins in T4 are
dispensable because T4 deletion mutants in one or two of these genes
40
Fig. 6. (a) Schematic representations of the loop
patterns of T2/T4BeG19, T2/T4BeG326, T2/T4BeG342,
T2/T4B~Gl92
and T2/T4BeG506 heteroduplexes. Dark
areas and lines indicate the sizes and ends of the deletions.
(b) Map positions of IP I, IP II, and IP III in the T2/T4
heteroduplex.
41
eG342 ---+Clockwise
eG326
l
c
D
E F~~
,..,
n~
I I 1 I I\ I I I I I
(a)
__J ~w
'--
eG192'''''1
i
,
- -
'
I I I\ 82 / eG19 I \ I I
'
I I \ \ I I I\...::./ L....\ 1...1 I I £...lf &.JU
n
.,
I ~ I I
I
,,
I I I I__,
...._
eG506
~ r
-\ I I ' I
'
'
I / \ \ I1•
I\ I I \ I I I I I \ \I
LAJ
'---J i - l L..J I I L...lfIPm
IP I
•
n1
nln
I
,,
' I I I I I II I\ I ' I I I I I
(b)
~'
~ ~L--~
I \ I I i r-,n
r--'
I I I,
\ / \ \ I t I\ I I \
'
I'
I I \ \1 I 1\ I'---' ~ L-1 I I&...) I WU
(c)
IP
I
IP Il !Pm
eG192
+
-
-eG506
-
+
+
eG326
+
-
-eGl9
+
+
-42
(b) The T4/T6 Heteroduplex
The heteroduplex T4/T6 map has been constructed and
oriented in a manner similar to the one described previously for
T2/T4 (Fig. 7) . . Eighty-eight per cent of T4 DNA is homologous to
T6 DNA. The rII and lysozyme genes are homologous. Some of the
loop patterns are similar to those observed in the heteroduplex
T2/ T4.
A schematic representation of the loop patterns around the
~gene is shown in Fig. 8. In the heteroduplex T4BeG19/T6, we have
observed a substitution (3600 bases, 800 bases) which is absent in
wild type T4/ T6. The size of the eG19 deletion is 700 bases and the
double-stranded region between loops I and B4' (3600 bases) was
decreased by the size of this deletion in T4BeG19/ T6. Thus the
right end of the eG19 deletion must start within the double-stranded
region near the loop
B:.
Also we know loop B41
consists of T4 DNA
because its size was unaffected by the presence of the ~Gl9 deletion.
The host range region (part of gene 37 and all of gene 38) is
heterologous, as is the rest of gene 37. In contrast, the latter
region is partially homologous in the T2/T4 system. This
observa-tion is consistent with genetic result that the products of genes 37
and 38 from T4 and T6 are incompatible (Russell, 1967). The two
strands of the host range loop are about equal in length, indicating
that there is no large difference in the size of the respective genes
43
Fig. 7. The T4/T6 heteroduplex map oriented with
respect to the T4 genetic map. This heteroduplex map
was oriented
byusing three rII deletion mutants of T4 and
44
[
I
rHSB
___. Clockwise
8~(3600) I
J
n
f1
I I---i
I I I Ir- I
&....-• I I , II r
-11 I I ' •' I
1
' - I :
!l
!----'
I \-
__..- =
LJ ...___.i
,
----
---
eG19J
6
J2
L.-a
~
1\ I
___J \ I I I f l • I l'1 I I
-=======::::----_j'
I I I---I • I f
-' I 11 I I
----, ' .,.-' I I
/~
II \ ' ....,. ,,, LJ L.1....1
I \ ...._ ,,,
L.-.l
800
Fig.
8.
Schematic representation of the loop patterns of T4/T6
(a) and
T4B~Gl9/T6(b} heteroduplexes around
the~gene.
Size of the loops is given in base-pairs.
(a)
(b)
~
46
A map of the tRNA gene cluster was obtained by forming the
heteroduplexes
T4psuba27/T6 and T4psuba33/T6. The
loop
patterns
observed
in these heteroduplexes are shown in Fig.
9. The band 1-,
band 2-,
leu-,
and probably pro-tRNA
genes are homologous.
Since
loop I
is
present in
only 50% of
the T4/T6
het
eroduplexes and is
somewhat variable in size, we don't
know whether loop I
isan
AT-rich or a partially
homologous
region.
Ifthe
latter
possibility
is correct, the gly- and ser-tRNA genes may be non-homologous.
The IP I gene was mapped in a homologous region (Fig. 9
-
(d))
by
comparing loops
J1and
J6in T4/T6 with loops F
1and
F21in T2/T4.
It
seems that loop
J6is equivalent to F
2'and loop
J 1to F
1 • Ifthis is
true, loop
J6comes from T6 DNA. The map position for the IP II and
the IP III
genes in T4 is the loop B
4'in the T4/T6 heteroduplex,
suggesting that in T6 either there are no genes corresponding to the
T4 IP II and IP III genes or they map elsewhere.
(c)
The T2/T6 Heteroduplex
The T2/T6 heteroduplex map is shown in Fig. 10.
Eighty-nine per cent of the heteroduplex appears double-stranded.
Itseemed
probable that the largest substitution loop in this map would be the
host range region. Unfortunately, there was no immediate way
available to orient the T2/T6 map with respect to the two other
heteroduplex maps, T2/T4 and T4/T6.
47
Fig. 9. Schematic representation of the loop patterns
around tRNA genes in the following heteroduplex molecu
l
es:
(a) Scale in base-pairs.
(b)
T4 psubA27/T6. Band-2, gly- and ser-tRNA genes
are deleted in psubA27.
(c) T4 psubA33
/
T6. All the tRNA genes are deleted in
psubA33.
(d) Map position of each tRNA gene on T4
/
T6
hetero-duplex. IP I gene is also mapped. Some results
obtained in the T2
/
T4 system were used to locate
[
JrH88
lr638
rH23 52
Fig. 10.
49
30
I,':
"
'I
,,
'•
",,
ll
~The T2/T6 heteroduplex map with T2 genetic map (Russell, 1967).
50
mutants. The characteristics of
the
original T4rII deletions are
summarized
in
Table
1.
To prevent
the
markers of T2 from being
partially excluded
(which they
normally would
be in
a mixed infection
with T4
(Russell, 1967)) the
T4rII
deletion
mutants were exposed to
UV radiation sufficient
to
give 20
lethal hits per phage.
The
input
ratio of T2 to any T4rII deletion was 10:1 except
in the
case of
T4BrH23, where
the
ratio was 1 :1. The progeny from these crosses
were plated on S/ 4 from which several r-type plaques were picked
and tested for the characteristics of
the
original deletions by
complementation (T2rH88-l, T2r638 and T2rH23). T2rH88-l was
back-crossed to T2 to make it as isogenic as possible with T2
(T2rH88-2).
rH88
r638
rH23
Table 1
Characteristics of the original T4rII deletions
rIIB point mutant
HB232
EM84
NT332
c
c
c
c: complementation
+:
recombination
rIIA point mutant
HB118 HB122
EM640
+
c
c
c
neither complementation nor recombination
(indicating that the deletion overlaps
51
DNA
from
these
phages
was examined
to
see
how
many T4
genes
were
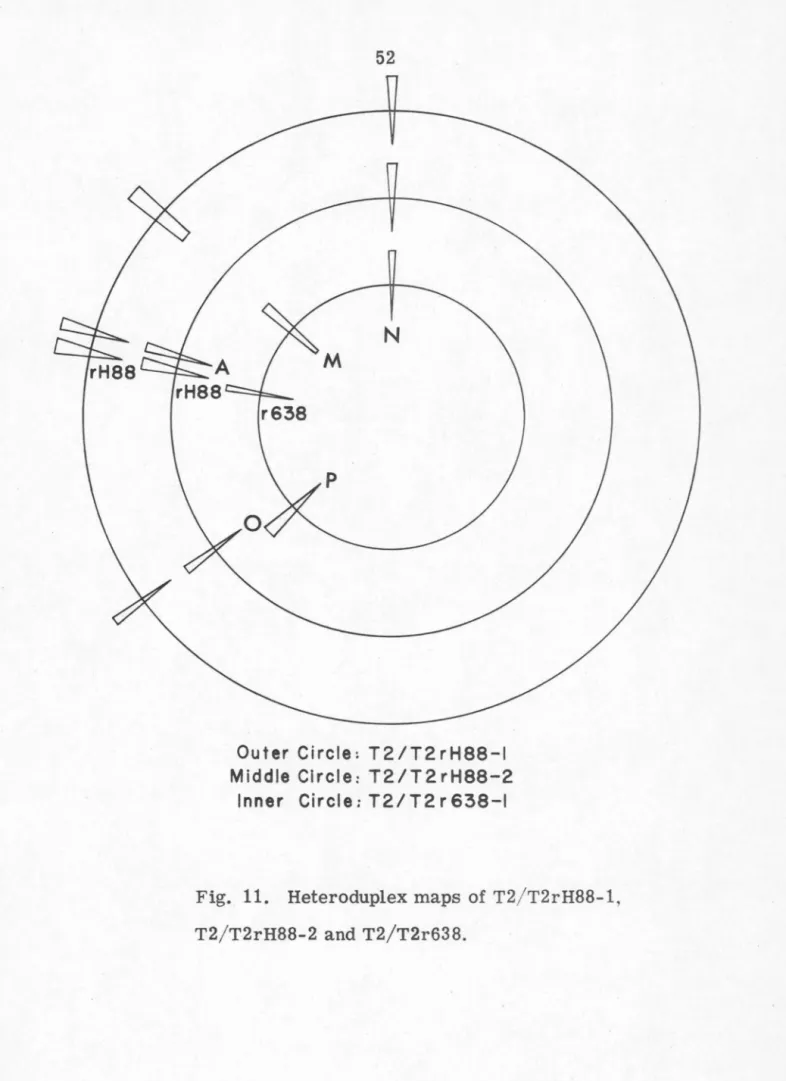
picked up. Figure
11
is
a schematic
representation
of
the loop
patterns of
the heteroduplex T2rH88-1/T2,
T2rH88-2/T2
and T2r638/T2. In general,
these DNA heteroduplex molecules
looked
like T2 except
in
3 or
4
regions
and the rll deletions
appeared
where they were expected. At about
10
o'clock
(loop
M) T2rH88-2
lost
a
piece
of T4DNA which appeared in T2rH88-l. A
loop
at
12
o'clock (loop N) on each circle was mapped by
its disappearance
in
the
heteroduplexes T2rH88-l/T4rH88, T2rH88-2/T4rH88 and
T2r638/T4r638. An increase in the double-stranded region between
the closest
loops
on either side of the loop indicates that loop N
corresponds
to
T4 DNA. Loop
0in the T2/T2rH88 heteroduplexes
is
not identical to
loop
P in T2/T2r638. From heteroduplexes with
T4, one finds
that
both loops
0 and P come from T4 DNA. Also, by
forming heteroduplexes with T6, we have shown that loop 0 in
T2/T2rH88 appears in T4/T6 but not in T2/T6. Thus T4 has a
region of 600 base-pairs long which T2 and T6 lack. On the other
hand, loop P
in
T2/T2r638 appears in T2/T6 but not in T4/T6,
showing that T4 and T6 contain a region of 1000 base-pairs long which
T2 lacks. We don't understand why these 3 or 4 pieces of T4 DNA
are consistently introduced to T2.
The recombinant phage T2rH23 contains very many T4 genes,
including the rH23 deletion.
Itis homologous to T2 throughout the
52
N
r638
Outer Circle: T2/T2rH88-I Middle Circle: T2/T2rH88-2
Inner Circle: T2/ T2 r 638-1
Fig. 11. Heteroduplex maps of T2/T2rH88-1,
53
All
three
rII deletions are not
needed to
orient the T2/T6
heteroduplex
map, because each rII deletion
mutant
contains several
other markers as well. The pattern of
the loops around
the rII
region in
the
T2rH88-l/T6
heteroduplex is shown in
Fig.
12.
The
regions of
loops
A and
M
appearing
in both T2/T4
and T4/T6 map at
homologous
region
in
T2/T6.
The direction loop A- loop
rH88
corresponds to the rIIA- rIIB direction (see also Fig. 2). This
information allows orientation of the T2/T6
heteroduplex
map, as
shown
in
Fig. 10. The rll gene
is
homologous. The
largest
non-homologous region is
that
bearing genes 37 and 38. The combined
size of genes 37 and 38 in T2 is greater by 900 base-pairs than that
in T4.
In
T2/T6, one strand of the host range loop is larger by 1000
bases than the other.
Ifthe longer strand corresponds to T 2 DNA,
then one would expect to observe a symmetric loop in T4/T6, which
is indeed the case. We therefore conclude that
the
size of genes 37
and 38 in T2 is larger by about 1000 base-pairs than that in T4 and in
T6. The electron microscopic observation that there is less DNA
homology in gene 37 between T2 and T6 and between T4 and T6 than
between T2 and T4 seems to be inconsistent with the genetic results
that P37 and P38 are more compatible between T2 and T6 than between
T2 and T4 (Russell, 1967). Perhaps non-homology in DNA sequences
does not necessarily imply incompatibility of the gene product.
The position of the e gene can be deduced on the T2/T6 map
by comparison with the T2/T4 and the T4/T6 heteroduplex maps.
54
Fig. 12. Schematic representation of the loop patterns
of T2/T6 (a) and T2rH88-l/T6 (b) heteroduplexes around
the rII region. The direction
loop
A-loop rH88
corresponds to the rIIA- rIIB cistron. The shorter strand
of the host range loop is labelled as H6, because that
seems to be T6 DNA. The other strand is labelled as
H~to
avoid confusion with H
2loop in Fig. 4. The size of
56
Fig. 13. Schematic representation of the loop patterns
of T2/T4 (a), T4/T6 (b), and T2/T6 (c) heteroduplex
around
the~the tRNA and the internal protein genes.
The shorter strand of the loop K is likely to be T6 DNA,
because shorter strand of the loop E is known to be T4 DNA
and the sequence for the loop E
ishomologous in T4/T6.
Similarly the L
2and L
6loops seem to be T2 and T6 DNAs,
58
each