Essays in Agricultural Economics
-Appendices
Francisco Pereira Fontes
A thesis submitted to the Department of Geography and Environment
of the London School of Economics and Political Science
for the degree of Doctor of Philosophy
February 2018
Abstract
This thesis explores topics in Agricultural Economics and is composed of five papers. In the
first paper (Chapter 2), a latent-class stochastic frontier model is used to estimate efficiency
scores of farmers in Ethiopia. Compared to conventional models, which assume a unique
frontier, much lower inefficiencies are found, suggesting that part of the inefficiencies uncovered
in the literature could be an artefact of the methods used. The second paper (Chapter 3)
revisits the link between cereal diversity and productivity using a panel dataset in Ethiopia.
The results suggest that the positive effect between cereal diversity and productivity becomes
much smaller when households who produce teff (a low-productivity and high-value crop)
are excluded from the sample, hinting at the possibility that results could be driven by yield
differentials between cereals, rather than diversity. The third paper (Chapter 4) estimates
the labour impacts of the adoption of Soil and Water Conservation technologies (SWC) in
Ethiopia. The results suggest that adopting SWC technologies leads to an increase in adult
and child labour. Understanding the labour impacts is important in itself, but it also raises
concerns about using impact evaluation methods that require no change in inputs as an
identifying assumption of impacts. Paper 4 (Chapter 5), assesses the pertinence of a drought
index that has recently been proposed in the literature and argues that it defines drought
too narrowly. An extension to this index is proposed and we show, using a dataset of Indian
districts, that the original index is likely to underestimate the impacts of drought. In Paper
5 (Chapter 6), we identify data-driven ranges of rainfall for which the marginal effects of a
rainfall-temperature index (RTI) are different and then we discuss how the impacts of drought
Contents
2 “Blatent” Heterogeneity: Implications for Efficiency Measurement and
Policy. A case study of Ethiopia. 211
A Appendix A - Additional results, figures and tables . . . 212
3 Revisiting the link between cereal diversity and production in Ethiopia 226 A Appendix A - Additional figures and tables . . . 227
A.1 Battese Correction Main Sample . . . 242
A.2 No imputed data . . . 248
A.3 Balanced Sample . . . 270
B Appendix B - Data preparation and Battese correction . . . 292
B.1 Data preparation . . . 292
B.2 Battese correction . . . 294
4 SWC Technology adoption and labour allocation: Implications for impact evaluation and policy. A case study of Ethiopia 296 A Appendix A - Theoretical model . . . 297
B Appendix B - data preparation . . . 301
C Appendix C - Choosing an instrument . . . 304
5 The importance of a comprehensive drought index to estimate drought-induced cereal losses in India 308 A Appendix A - Additional figures and Tables . . . 309
B Appendix B - Data preparation . . . 326
B.1 Data and Variables . . . 326
C Appendix C - Cost estimates methodology . . . 335
6 Threshold effects of extreme rainfall events and the evolution of drought
impacts on Indian agriculture 339
List of Figures
3A.1 Map of Villages in the ERHS (up to 2004) . . . 227
3A.2 Background information of Villages in the ERHS (up to 2004) . . . 228
3A.3 Effect of Shannon index Semi parametric Full sample . . . 237
3A.4 Effect of Shannon index Semi parametric Northern Highlands . . . 238
3A.5 Effect of Shannon index Semi parametric Central Highlands . . . 239
3A.6 Effect of Shannon index Semi parametric Arussi/Bale . . . 240
3A.7 Effect of Shannon index Semi parametric Enset . . . 241
3A.8 Effect of Shannon index Semi parametric Full sample (No imputed values) . 260 3A.9 Effect of Shannon index Semi parametric Northern Highlands (No imputed values) . . . 261
3A.10 Effect of Shannon index Semi parametric Central Highlands (No imputed values) . . . 262
3A.11 Effect of Shannon index Semi parametric Arussi/Bale (No imputed values) . 263 3A.12 Effect of Shannon index Semi parametric Enset (No imputed values) . . . . 264
3A.13 Effect of Shannon index Semi parametric Full sample (No imputed values, with scatter) . . . 265
3A.14 Effect of Shannon index Semi parametric Northern Highlands (No imputed values, with scatter) . . . 266
3A.15 Effect of Shannon index Semi parametric Central Highlands (No imputed values, with scatter) . . . 267
3A.16 Effect of Shannon index Semi parametric Arussi/Bale (No imputed values, with scatter) . . . 268
3A.17 Effect of Shannon index Semi parametric Enset (No imputed values, with scatter) . . . 269
3A.18 Effect of Shannon index Semi parametric Full sample (Balanced sample) . . 282
3A.19 Effect of Shannon index Semi parametric Northern Highlands (Balanced
sample) . . . 283
3A.20 Effect of Shannon index Semi parametric Central Highlands (Balanced
sam-ple) . . . 284
3A.21 Effect of Shannon index Semi parametric Arussi/Bale (Balanced sample) . . 285
3A.22 Effect of Shannon index Semi parametric Enset (Balanced sample) . . . 286
3A.23 Effect of Shannon index Semi parametric Full sample (Balanced sample, with
scatter) . . . 287
3A.24 Effect of Shannon index Semi parametric Northern Highlands (Balanced
sample, with scatter) . . . 288
3A.25 Effect of Shannon index Semi parametric Central Highlands (Balanced
sam-ple, with scatter) . . . 289
3A.26 Effect of Shannon index Semi parametric Arussi/Bale (Balanced sample,
with scatter) . . . 290
3A.27 Effect of Shannon index Semi parametric Enset (Balanced sample, with
scatter) . . . 291
5A.1 Proportion of drought-affected districts (by type, May-December growing
sea-son) . . . 309
5A.2 Type 1 droughts in excess of Type 2 droughts May-December growing season 310
5A.3 Estimated coefficients and 95% confidence intervals . . . 313
6A.1 Rolling regressions - Additional windows (Full sample) . . . 357
6A.2 Rolling regressions - Additional windows (Arid and Semi-arid areas) . . . 358
6A.3 Rolling regressions - Additional windows (Sub-humid and humid areas) . . . 359
6A.4 Rolling regressions - Additional windows (Barley, Maize and Millet) . . . 360
List of Tables
2A.1 Technical efficiency studies in Ethiopia (Part 1) . . . 213
2A.1 Technical efficiency studies in Ethiopia (Part 2) . . . 214
2A.1 Technical efficiency studies in Ethiopia (Part 3) . . . 215
2A.1 Technical efficiency studies in Ethiopia (Part 4) . . . 216
2A.2 Summary statistics by latent class two-class translog - Year dummies only . . 217
2A.3 Results - stochastic frontier model (translog) Pooled OLS, Fixed effects and two-class LCM (Year dummies) . . . 218
2A.4 Summary statistics - Efficiency scores by method and agro-ecological zone (Translog - Year dummies) . . . 219
2A.5 Class allocation by peasant association two-class LCM translog - Year dum-mies only . . . 220
3A.1 List of Peasant Associations by AEZ . . . 228
3A.2 Parametric translog full . . . 229
3A.3 Parametric translog full (teff only) . . . 230
3A.4 Parametric translog full (no teff) . . . 231
3A.5 Semi-parametric model: Parametric component (Full sample) . . . 232
3A.6 Semi-parametric model: Parametric component (Northern Highlands) . . . . 233
3A.7 Semi-parametric model: Parametric component (Central Highlands) . . . 234
3A.8 Semi-parametric model: Parametric component (Arusi/Bale (Other)) . . . 235
3A.9 Semi-parametric model: Parametric component (Enset) . . . 236
3A.10 Bandwidth choice . . . 241
3A.11 Main results : Parametric translog (Battese adjustment) . . . 242
3A.12 Main results : Parametric translog - Teff only (Battese adjustment) . . . 243
3A.13 Main results : Parametric translog - No teff (Battese adjustment) . . . 244
3A.14 Parametric translog full (Battese transformation) . . . 245
3A.15 Parametric translog teff only (Battese transformation) . . . 246
3A.16 Parametric translog noteff (Battese transformation) . . . 247
3A.17 Summary Statistics . . . 248
3A.18 Parametric translog full (No imputed data) . . . 249
3A.19 Parametric translog teff only (No imputed data) . . . 250
3A.20 Parametric translog no teff (No imputed data) . . . 251
3A.21 Parametric translog full (Battese transformation, no imputed data) . . . 252
3A.22 Parametric translog teff only (Battese transformation, no imputed data) . . . 253
3A.23 Parametric translog no teff (Battese transformation, no imputed data) . . . . 254
3A.24 Semi-parametric model: Parametric component (Full sample), no imputed values . . . 255
3A.25 Semi-parametric model: Parametric component (Northern Highlands), no imputed value . . . 256
3A.26 Semi-parametric model: Parametric component (Central Highlands), no im-puted values . . . 257
3A.27 Semi-parametric model: Parametric component (Arusi/Bale (Other)), no im-puted values . . . 258
3A.28 Semi-parametric model: Parametric component (Enset), No imputed values . 259 3A.29 Bandwidth choice - (no imputed values) . . . 269
3A.30 Summary Statistics . . . 270
3A.31 Parametric translog full (Balanced Panel) . . . 271
3A.32 Parametric translog teff only (Balanced Panel) . . . 272
3A.33 Parametric translog no teff (Balanced Panel) . . . 273
3A.34 Parametric translog full (Battese transformation) . . . 274
3A.35 Parametric translog teff only (Battese transformation, balanced sample) . . . 275
3A.36 Parametric translog no teff (Battese transformation, balanced sample) . . . . 276
3A.37 Semi-parametric model: Parametric component (Full sample), Balanced sample277
3A.39 Semi-parametric model: Parametric component (Central Highlands),
Bal-anced sample . . . 279
3A.40 Semi-parametric model: Parametric component (Arusi/Bale (Other)), Bal-anced sample . . . 280
3A.41 Semi-parametric model: Parametric component (Enset), Balanced sample . . 281
3A.42 Bandwidth choice - (no imputed values) . . . 291
4C.1 Falsification tests additional instruments (Adult labour) . . . 306
4C.2 Falsification tests additional instruments (Child labour) . . . 307
5A.1 Full sample robustness checks 1 . . . 311
5A.2 Full sample robustness checks 2 . . . 312
5A.3 Rice sample robustness checks 1 . . . 314
5A.4 Rice sample robustness checks 2 . . . 315
5A.5 Wheat sample robustness checks 1 . . . 316
5A.6 Wheat sample robustness checks 2 . . . 317
5A.7 Maize sample robustness checks 1 . . . 318
5A.8 Maize sample robustness checks 2 . . . 319
5A.9 Millet sample robustness checks 1 . . . 320
5A.10 Millet sample robustness checks 2 . . . 321
5A.11 Sorghum sample robustness checks 1 . . . 322
5A.12 Sorghum sample robustness checks 2 . . . 323
5A.13 Barley sample robustness checks 1 . . . 324
5A.14 Barley sample robustness checks 2 . . . 325
6A.1 Unit root tests (Full sample and agro-ecological zones) . . . 340
6A.2 Unit root tests (by crop) . . . 341
6A.3 Robustness check - controls (full sample and agro-ecological zones) . . . 342
6A.4 Robustness check - controls (by crop) . . . 343
6A.5 Robustness check - De-meaned yield (full sample and agro-ecological zones) . 344 6A.6 Robustness check - de-meaned yield (by crop) . . . 345
6A.7 Robustness check - annual growing season (full sample and agro-ecological zones) . . . 346
6A.8 Robustness check - annual growing season (by crop) . . . 347
6A.9 Robustness check - May-December growing season (full sample and agro-ecological zones) . . . 348
6A.10 Robustness check - May-December growing season (by crop) . . . 349
6A.11 Robustness check - additive RTI (full sample and agro-ecological zones) . . . 350
6A.12 Robustness check - additive RTI (by crop) . . . 351
6A.13 Time results - F-tests of joint significance . . . 352
6A.14 Time results - F-tests of joint significance . . . 352
6A.15 Parametric time results - Full sample . . . 352
6A.16 Parametric time results - arid and semi-arid areas . . . 353
6A.17 Parametric time results - sub-humid and humid areas . . . 354
6A.18 Parametric time results - barley and maize . . . 355
6A.19 Parametric time results - millet and sorghum . . . 356
Chapter 2
“Blatent” Heterogeneity:
Implications for Efficiency
Measurement and Policy. A case
study of Ethiopia.
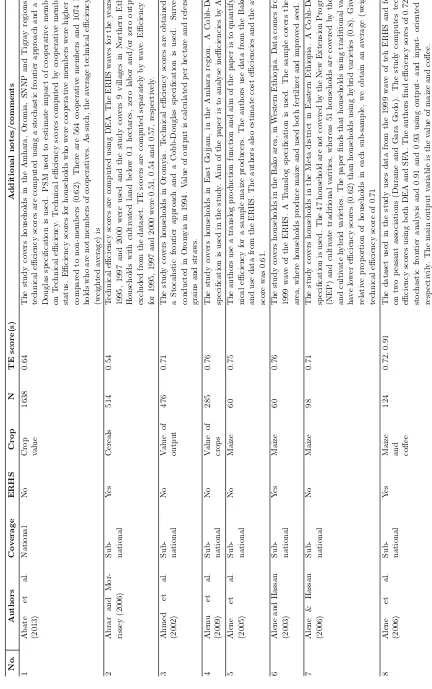
T able 2A.1: T ec hnical efficiency studies in Ethiopia (P art 1) No. Authors Co v erage ERHS Crop N TE score(s) Additional notes/commen ts 1 Abate et al. (2013) National No
Crop value
1638 0.64 The study co v ers households in the Amhara, Oromia, SNNP and Tigra y region s. The tec hnical efficiency scores are computed using a sto ch as ti c fron tier approac h and a Cob b-Douglas sp ecification is used. PSM used to estimate impact of co op erativ e mem b ership on T ec hnical efficiency . T ec h nical efficiency scores computed b y co op erativ e mem b ership status. Efficiency scores for households who w ere co op erativ e mem b ers w ere higher (0.67) compared to non -m em b ers (0.62). There are 564 co op erativ e mem b ers and 1074 house-holds who are not mem b ers of co op erativ es . As suc h, the a v e rage tec hnical efficiency score (w eigh ted a v erage) is 2 Abrar an d Mor-rissey (2006) Sub- national Y es Cereals 514 0.54 T ec h nical efficiency scores are computed using DEA. The ERHS w a v es for the y ears 1994, 1995, 1997 and 2000 w ere used and the stud y co v ers 9 villages in Northern Ethiopia. Households with cultiv ated land b elo w 0.1 hec tar e s, zero lab or and/or ze ro output are excluded from the dataset. T E sco ers are computed separ ate ly b y w a v e. Efficiency scores for 1995, 1997 and 2000 w ere 0.51, 0.54 and 0.57, resp ectiv ely . 3 Ahmed et al. (2002) Sub- national No V alue of output 476 0.71 The stu dy co v ers households in Orom yia. T ec hnical efficie n c y scores are obtai ned using a Sto cahstic fron tier approac h and a Cobb-Douglas sp ecification is use d . S urv ey w as conducted in Orom yia in 1994. V alue of output is calculated p er hectare and refers to all grains and stra ws. 4 Alem u et al. (2009) Sub- national No V alue of crops 285 0.76 The stu dy co v ers households in East Go jjam, in the Amhara region. A Cobb-Douglas sp ecification is use d in the study . Aim of the pap er is to analyse inefficiencie s b y AEZ. 5 Alene et al. (2005) Sub- national No Maize 60 0.75 The authors use a translog pro duction function and aim of the pap er is to quan tify tec h -nical efficiency for a sample maize pro ducers. The authors use data from the Bak o area and u se data from the ERHS. The authors also estimate cost efficiencies and the a v erage score w as 0.61. 6 Alene and Hassan (2003) Sub- national Y es Maize 60 0.76 The study co v e rs households in the Bak o area, in W estern Ethiopia. Data comes from the 1999 w a v e of th e ERHS. A T ranslog sp ecification is use d . The sample co v ers the Bak o area, where households pro duce maize and used b oth fertilizer and impro v ed seed. 7 Alene & Hassan (2006) Sub- national No Maize 98 0.71 The study co v ers households in the Meta district in Eastern Ethiopia. A Cobb-Douglas sp ecification is used. The 47 household ar e not co v ered b y the New Extension Programme (NEP) and cultiv ate tradi tional v arities, whereas 51 households are co v ered b y the NEP and cultiv ate h ybrid v arieties. The pap er finds that households using traditional v arieties ha v e lo w er efficiency scores (0.62) than households using h ybrid v arieties (0.8). Giv en the relativ e prop ortion of households in e ac h sub-sample, w e obtain an a v erage (w eigh ted) tec hnical efficiency score of 0.71 8 Alene et al. (2006) Sub- national Y es
Maize and coffee
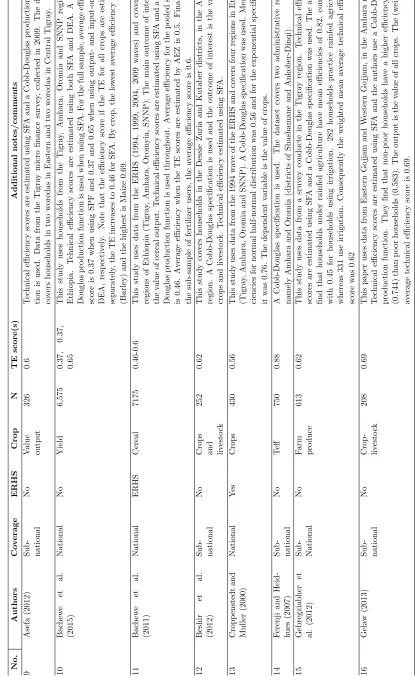
[image:13.612.132.564.26.715.2]T able 2A.1 : T ec hnical efficiency studies in Ethiopia (P art 2) Authors Co v erage ERHS Crop N TE score(s) Additional notes/commen ts (2012) Sub- national No V alue output 326 0.6 T ec hnical efficiency scores are estimated using SF A and a Cobb-Douglas pro duction func-tion is used. Data from the Tigra y micro finance surv ey , collected in 2009. The dataset co v e rs households in tw o w oredas in Eastern and tw o w oredas in Cen tral Tigra y . hew e et al. National No Yield 6,575 0.37, 0.37, 0.65 This study u ses households from the Tigra y, Amhara, Oromia and SNNP regions in Ethiopia. T e h nical efficiency scores are estimated using b oth SF A and DEA. A Cobb-Douglas pro duction function is use d when using SF A. F or the full sample, a v erage efficie n c y score is 0.37 when using SPF and 0.37 and 0.65 when using outpu t-and input-orien ted DEA, resp ectiv ely . Note that the efficiency score if the TE for all crops are estimated separately , the TE increas es to 0.46 for SF A. By crop, the lo w est a v erage efficiency is 0.27 (Barley) and the highest is Mai z e 0.69. hew e et al. National ERHS Cereal 7175 0.46-0.6 T h is study uses data from the ERHS (1994, 1999, 2004, 2009 w a v es) and co v ers four regions of Ethiopia (T igr a y, Amhara, Or om yia, SNNP). The main outcome of in terest is the v alu e of cereal output. T ec hnical efficiency scores are estimated using SF A and a Cobb-Douglas pro duction function is used throughout. Av erage efficiency for the p o oled sample is 0.46. Av erage efficiency when the TE scores are estimated b y AEZ is 0.5. F inally , for the sub-sample of fertilizer users, the a v erage efficiency score is 0.6. et al. Sub- national No
Crops and liv
[image:14.612.135.550.27.709.2]T able 2A.1 : T ec hnical efficiency studies in Ethiopia (P art 3) No. Authors Co v erage ERHS Crop N TE score(s) Additional notes/commen ts 17 Keb ede and Ade-new (2011) Sub- national No Wheat 32 0.82 T ec h nical efficiency score s w ere estimated using SF A and a Cobb-Douglas sp ecification w as used. This study fo cuses on commercial farms in the Bale zone. The output v ariable is wheat pro duction. 18 Khairo and Bat-tese (2005) Sub- national No Maize 180 0.73 This Study fo cuses on the households co v ered the NEP and on households that fal l outside the NEP . The geograph ic al co v erage of the study is limited to th e Harari region. 19 Mek onnen et al. (2013) National Y es Cereals 815 0.58 This pap er co v ers four regions in Eth iopia (Tigra y , Amhara, Oromia, SNNP) and uses data from the ERHS (1999 and 2004 w a v es). The study uses a GMM approac h. The pap er find s that, at the p easan t ass o ciation lev el, a v erage tec hnical efficiency scores range from 46.4% to 69.1%. 20 Mussa e t al. (2012) Sub- national No
Wheat, Teff, Chic
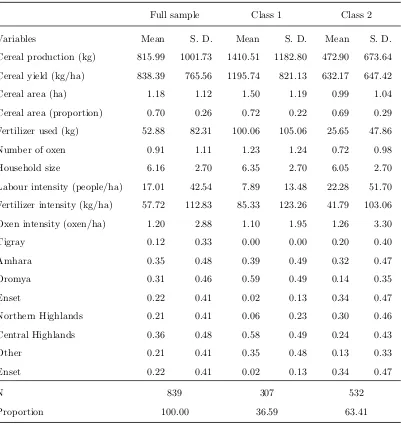
Table 2A.2: Summary statistics by latent class two-class translog - Year dummies only
Full sample Class 1 Class 2
Variables Mean S. D. Mean S. D. Mean S. D.
Cereal production (kg) 815.99 1001.73 1410.51 1182.80 472.90 673.64
Cereal yield (kg/ha) 838.39 765.56 1195.74 821.13 632.17 647.42
Cereal area (ha) 1.18 1.12 1.50 1.19 0.99 1.04
Cereal area (proportion) 0.70 0.26 0.72 0.22 0.69 0.29
Fertilizer used (kg) 52.88 82.31 100.06 105.06 25.65 47.86
Number of oxen 0.91 1.11 1.23 1.24 0.72 0.98
Household size 6.16 2.70 6.35 2.70 6.05 2.70
Labour intensity (people/ha) 17.01 42.54 7.89 13.48 22.28 51.70
Fertilizer intensity (kg/ha) 57.72 112.83 85.33 123.26 41.79 103.06
Oxen intensity (oxen/ha) 1.20 2.88 1.10 1.95 1.26 3.30
Tigray 0.12 0.33 0.00 0.00 0.20 0.40
Amhara 0.35 0.48 0.39 0.49 0.32 0.47
Oromya 0.31 0.46 0.59 0.49 0.14 0.35
Enset 0.22 0.41 0.02 0.13 0.34 0.47
Northern Highlands 0.21 0.41 0.06 0.23 0.30 0.46
Central Highlands 0.36 0.48 0.58 0.49 0.24 0.43
Other 0.21 0.41 0.35 0.48 0.13 0.33
Enset 0.22 0.41 0.02 0.13 0.34 0.47
N 839 307 532
Proportion 100.00 36.59 63.41
S. D. refers to Standard deviations
Table 2A.3: Results - stochastic frontier model (translog) Pooled OLS, Fixed effects and two-class LCM (Year dummies)
Pooled OLS F.E. Latent Class Class 1 Class 2
Constant 6.566*** 7.303*** 6.006***
(0.115) (0.189) (0.144)
Area 0.530*** 0.564*** 0.060 0.726***
(0.043) (0.027) (0.071) (0.050)
Oxen 0.539*** 0.464*** 0.229 0.912***
(0.143) (0.100) (0.168) (0.202) Household size -0.087 -0.181*** -0.253** -0.040
(0.090) (0.051) (0.118) (0.109) Fertilizer -0.279*** -0.355*** -0.218*** -0.166***
(0.046) (0.027) (0.071) (0.060) Area sq -0.073*** -0.066*** -0.296*** 0.034* (0.015) (0.010) (0.029) (0.018)
Oxen sq 0.049 0.056 0.623*** -0.586***
(0.142) (0.096) (0.165) (0.210) Household size sq 0.127** 0.172*** 0.302*** 0.062
(0.057) (0.035) (0.071) (0.072) Fertilizer sq 0.149*** 0.174*** 0.097*** 0.069***
(0.013) (0.008) (0.018) (0.020) Area * oxen -0.024 -0.032 0.157*** 0.009
(0.039) (0.027) (0.052) (0.053) Area * Household size 0.055** 0.051*** 0.098*** -0.023
(0.023) (0.015) (0.036) (0.027) Area * Fertilizer -0.006 -0.012*** 0.029*** 0.009
(0.006) (0.004) (0.011) (0.008) Oxen * Household size -0.063 -0.032 -0.083 -0.159
(0.070) (0.048) (0.072) (0.106) Oxen * Fertilizer -0.077*** -0.078*** -0.111*** 0.024
(0.015) (0.011) (0.020) (0.022) Household size * Fertilizer -0.001 0.001 0.010 -0.003
(0.012) (0.008) (0.016) (0.016) Dummy fertilizer -0.481*** -0.583*** -0.464*** -0.388***
(0.072) (0.042) (0.126) (0.081) Dummy oxen -0.044 -0.046** -0.051 -0.045
(0.029) (0.020) (0.038) (0.036) 1995 0.477*** 0.459*** 0.144*** 0.759***
(0.036) (0.030) (0.045) (0.048) 1997 0.304*** 0.289*** 0.242*** 0.450***
(0.039) (0.031) (0.049) (0.049) 1999 0.410*** 0.406*** 0.190*** 0.632***
(0.040) (0.032) (0.050) (0.049) 2004 0.504*** 0.498*** 0.264*** 0.731***
(0.039) (0.032) (0.049) (0.049) 2009 0.607*** 0.597*** 0.321*** 0.823***
(0.039) (0.032) (0.055) (0.049) Selection equation
Constant -0.654
(0.791)
Av. Proportion cereal 0.401
(0.862)
Av. Area 0.015
(0.194)
Av. Labour intensity -0.161***
(0.021) Av. Fertilizer intensity 0.019***
(0.002)
Av. Oxen intensity -0.101
(0.118)
Prior Probabilities 0.175 0.825
Variance parameters
Table 2A.4: Summary statistics - Efficiency scores by method and agro-ecological zone (Translog - Year dummies)
All
Mean S.D. Min. Max.
Pooled OLS 0.55 0.15 0.12 0.90
Fixed Effects 0.57 0.11 0.15 0.85
LCM (2 classes) 0.76 0.10 0.27 0.95
Northern Highlands
Mean S.D. Min. Max.
Pooled OLS 0.53 0.15 0.16 0.86
Fixed Effects 0.59 0.11 0.20 0.82
LCM (2 classes) 0.74 0.11 0.39 0.94
Central Highlands
Mean S.D. Min. Max.
Pooled OLS 0.59 0.13 0.13 0.84
Fixed Effects 0.59 0.09 0.22 0.80
LCM (2 classes) 0.77 0.10 0.40 0.94
Others
Mean S.D. Min. Max.
Pooled OLS 0.60 0.12 0.16 0.89
Fixed Effects 0.59 0.09 0.21 0.85
LCM (2 classes) 0.77 0.10 0.27 0.95
Enset
Mean S.D. Min. Max.
Pooled OLS 0.60 0.12 0.16 0.89
Fixed Effects 0.59 0.09 0.21 0.85
LCM (2 classes) 0.77 0.10 0.27 0.95
S. D. refers to standard deviations. Min. refers to the minimum value. Max. refers to the maximum value
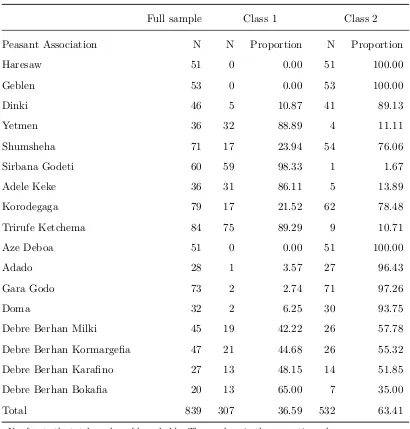
Table 2A.5: Class allocation by peasant association two-class LCM translog - Year dummies only
Full sample Class 1 Class 2
Peasant Association N N Proportion N Proportion
Haresaw 51 0 0.00 51 100.00
Geblen 53 0 0.00 53 100.00
Dinki 46 5 10.87 41 89.13
Yetmen 36 32 88.89 4 11.11
Shumsheha 71 17 23.94 54 76.06
Sirbana Godeti 60 59 98.33 1 1.67
Adele Keke 36 31 86.11 5 13.89
Korodegaga 79 17 21.52 62 78.48
Trirufe Ketchema 84 75 89.29 9 10.71
Aze Deboa 51 0 0.00 51 100.00
Adado 28 1 3.57 27 96.43
Gara Godo 73 2 2.74 71 97.26
Doma 32 2 6.25 30 93.75
Debre Berhan Milki 45 19 42.22 26 57.78
Debre Berhan Kormargefia 47 21 44.68 26 55.32
Debre Berhan Karafino 27 13 48.15 14 51.85
Debre Berhan Bokafia 20 13 65.00 7 35.00
Total 839 307 36.59 532 63.41
References papers included in Table 2A.1
References
[1] Abate, G. T., Francesconi, G. N., & Getnet, K. (2014). Impact of agricultural cooperatives
on smallholders technical efficiency: empirical evidence from Ethiopia. Annals of Public
and Cooperative Economics, 85(2), 257-286.
[2] Abrar, S., & Morrissey, O. (2006). Supply response in Ethiopia: accounting for technical
inefficiency.Agricultural economics, 35(3), 303-317.
[3] Ahmed, M. M., Gebremedhin, B., Benin, S., & Ehui, S. (2002). Measurement and sources
of technical efficiency of land tenure contracts in Ethiopia.Environment and Development
Economics, 7(3), 507-527.
[4] Alemu, B. A., Nuppenau, E. A., & Boland, H. (2009). Technical efficiency of farming
systems across agro-ecological zones in Ethiopia: An application of stochastic frontier
analysis.Agricultural Journal, 4(4).
[5] Alene, A. D., & Hassan, R. M. (2003). The determinants of farm-level technical efficiency
among adopters of improved maize production technology in western Ethiopia. Agrekon,
42(1), 1-14.
[6] Alene, A. D., & Hassan, R. M. (2006). Erratum: The efficiency of traditional and hybrid
maize production in Eastern Ethiopia: An extended efficiency decomposition approach.
Journal of African Economies, 15(2), i-xxvii.
[7] Alene, A. D., Manyong, V. M., & Gockowski, J. (2006). The production efficiency of
maize production in western Ethiopia. Quarterly Journal of International Agriculture,
44(2), 167-182.
[9] Asefa, S. (2012). Who is technically efficient in crop production in Tigray region, Ethiopia?
Stochastic frontier approach. Global Advanced Research Journal of Agricultural Science,
1(7), 191-200.
[10] Bachewe, F. N., Koru, B. & Taffesse, A. S. (2015). Cereal
productiv-ity and its drivers: The case of Ethiopia. ESSP II Working Paper 75.
Ad-dis Ababa, Ethiopia and Washington, D.C.: Ethiopian Development Research
Institute (EDRI) and International Food Policy Research Institute (IFPRI).
http://ebrary.ifpri.org/cdm/ref/collection/p15738coll2/id/129230
[11] Bachewe, F., Guush, B., Sinafikeh, A., Gerawork, G., Taffesse, A. S. & Hoddinott, J.
(2011). Sources of Inefficiency and Growth in Agricultural Output in subsistence
Agri-culture: A stochastic Frontier Analysis.International Food Policy and Research Institute,
ESSP II Working Paper, (19).
[12] Beshir, H., Emana, B., Kassa, B., & Haji, J. (2012). Economic efficiency of mixed
crop-livestock production system in the North eastern highlands of Ethiopia: the stochastic
frontier approach.Journal of Agricultural Economics and Development, 1(1), 10-20.
[13] Croppenstedt, A., & Muller, C. (2000). The impact of farmers’ health and nutritional
sta-tus on their productivity and efficiency: evidence from Ethiopia. Economic Development
and Cultural Change, 48(3), 475-502.
[14] Feremji, B. T. & Heidhues, F. (2007). Study of total factor productivity of tef in Ethiopia:
application of a growth decomposition approach.Quarterly Journal of International
Agri-culture, 46(2), 119-144.
[15] Gebregziabher, G., Namara, R. E., & Holden, S. (2012). Technical efficiency of irrigated
and rain-fed smallholder agriculture in Tigray, Ethiopia: A comparative stochastic frontier
production function analysis. Quarterly Journal of International Agriculture, 51(3), 203.
[16] Kebede, K. & Adenew, B. (2011). Analysis of Technical Efficiency: Lessons and
Impli-cations for Wheat Producing Commercial Farms in Ethiopia. Journal of Economics &
Sustainable Development, 2(8), 39-48.
[17] Khairo, S. A., & Battese, G. E. (2005). A study of technical inefficiencies of maize
farmers within and outside the new agricultural extension program in the Harari region
of Ethiopia. South African Journal of Agricultural Extension, 34(1), 136-150.
[18] Mekonnen, D. K., Dorfman, J. H., & Fonsah, E. G. (2013). Productivity and Efficiency
of Small Scale Agriculture in Ethiopia. In 2013 Annual Meeting, February 2-5, 2013,
Orlando, Florida (No. 143038). Southern Agricultural Economics Association.
[19] Mussa, E. C., Obare, G. A., Bogale, A.,& Simtowe, F. P. (2012). Analysis of Resource Use
Efficiency in Smallholder Mixed Crop-Livestock Agricultural Systems: Empirical Evidence
from the Central Highlands of Ethiopia.Developing Country Studies, 2(9), 30-40.
[20] Nsanzugwanko, M. D., Battese, G. E., & Fleming, E. M. (1996). The Technical
Effi-ciency of Small Agricultural Producers in Central Ethiopia. 40th Annual Conference of
the Australian Agricultural & Resource Economics Society, University of Melbourne, 13-15
February 1996.
[21] Sauer, J. & Yilma, T. (2007). Consistent evidence on the efficiency of maize production
in southwest Ethiopia. Quarterly Journal of International Agriculture, 46(1), 23-48.
[22] Seebens, H., & Sauer, J. (2007). Bargaining power and efficiency - rural households in
Ethiopia.Journal of International Development, 19(7), 895-918.
[23] Suleiman, A. (1995). Evaluating the efficiency of farmers in Ethiopia.Ethiopian Journal
of Economics, 4(2), 47-66.
[24] Seyoum, E. T., Battese, G. E., & Fleming, E. M. (1998). Technical efficiency and
pro-ductivity of maize producers in eastern Ethiopia: a study of farmers within and outside
the Sasakawa-Global 2000 project.Agricultural economics,19(3), 341-348.
[25] Tesfay, G., Ruben, R., Pender, J., & Kuyvenhoven, A. (2005). Resource use efficiency
on own and sharecropped plots in Northern Ethiopia: determinants and implications for
sustainability.
[26] Tefera, T., & Subaro, D. V. (2013). Participation in land market and technical efficiency
[27] Ulimwengu, J. (2009). Farmers health and agricultural productivity in rural Ethiopia.
African Journal of Agricultural and Resource Economics, 3(2), 83-100.
[28] Yami, M., Tesafye, S., Begna, B., Fufa, F. Alemu, T., & Alemu, D. (2013). Source of
tech-nical inefficiency of smallholder wheat farmers in selected waterlogged areas of Ethiopia:
A translog production function approach.African Journal of Agricultural Research, 8(29),
3930-3940.
[29] Gelaw, F. (2013). Inefficiency and Incapability Gaps as Causes of Poverty: A Poverty
Line-Augmented Efficiency Analysis Using Stochastic Distance Function.African Journal
of Agricultural and Resource Economics (AfJARE), 8(2), 24-68.
Chapter 3
Revisiting the link between cereal
diversity and production in
A
Appendix A - Additional figures and tables
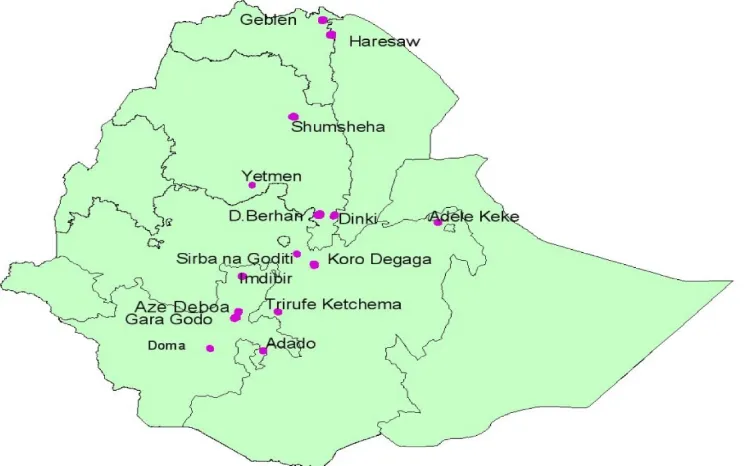
Figure 3A.1: Map of Villages in the ERHS (up to 2004)
Source: Dercon and Hoddinott 2004
Figure 3A.2: Background information of Villages in the ERHS (up to 2004)
Source: Dercon and Hoddinott 2004
Table 3A.1: List of Peasant Associations by AEZ
Agro-Ecological Zone Peasant Association
Northern Highlands Haresaw
Geblen
Shumsheha
Central Highlands Dinki
Debre Berhan Milki
Debre Berhan Kormargefia
Debre Berhan Karafino
Debre Berhan Bokafia
Yetmen
Turufe Ketchema
Enset Imdibir
Aze-Deboa
Adado
Gara-Godo
Do’oma
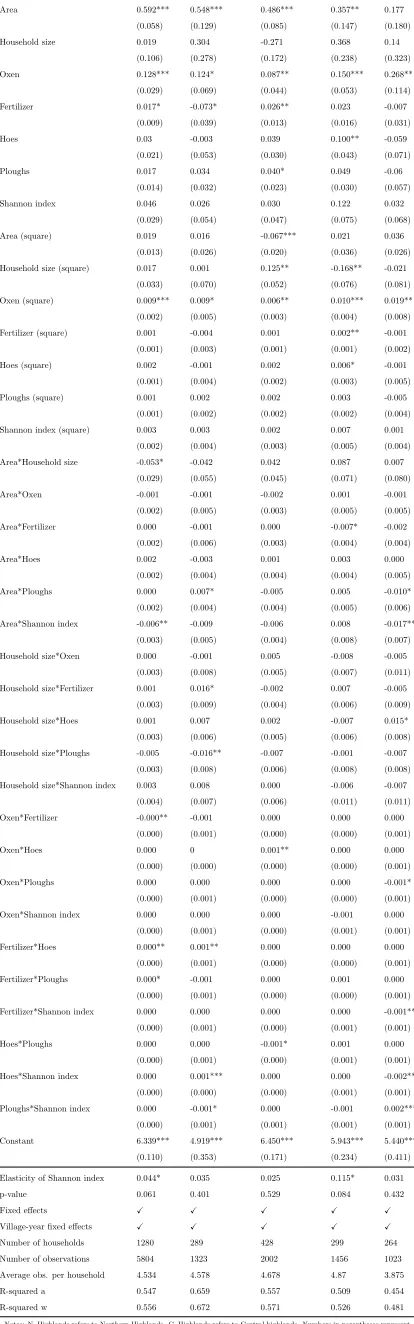
Table 3A.2: Parametric translog full
All N. Highlands C. Highlands Other Enset
Area 0.592*** 0.548*** 0.486*** 0.357** 0.177
(0.058) (0.129) (0.085) (0.147) (0.180)
Household size 0.019 0.304 -0.271 0.368 0.14
(0.106) (0.278) (0.172) (0.238) (0.323)
Oxen 0.128*** 0.124* 0.087** 0.150*** 0.268**
(0.029) (0.069) (0.044) (0.053) (0.114)
Fertilizer 0.017* -0.073* 0.026** 0.023 -0.007
(0.009) (0.039) (0.013) (0.016) (0.031)
Hoes 0.03 -0.003 0.039 0.100** -0.059
(0.021) (0.053) (0.030) (0.043) (0.071)
Ploughs 0.017 0.034 0.040* 0.049 -0.06
(0.014) (0.032) (0.023) (0.030) (0.057)
Shannon index 0.046 0.026 0.030 0.122 0.032
(0.029) (0.054) (0.047) (0.075) (0.068)
Area (square) 0.019 0.016 -0.067*** 0.021 0.036
(0.013) (0.026) (0.020) (0.036) (0.026) Household size (square) 0.017 0.001 0.125** -0.168** -0.021
(0.033) (0.070) (0.052) (0.076) (0.081)
Oxen (square) 0.009*** 0.009* 0.006** 0.010*** 0.019**
(0.002) (0.005) (0.003) (0.004) (0.008)
Fertilizer (square) 0.001 -0.004 0.001 0.002** -0.001
(0.001) (0.003) (0.001) (0.001) (0.002)
Hoes (square) 0.002 -0.001 0.002 0.006* -0.001
(0.001) (0.004) (0.002) (0.003) (0.005)
Ploughs (square) 0.001 0.002 0.002 0.003 -0.005
(0.001) (0.002) (0.002) (0.002) (0.004)
Shannon index (square) 0.003 0.003 0.002 0.007 0.001
(0.002) (0.004) (0.003) (0.005) (0.004)
Area*Household size -0.053* -0.042 0.042 0.087 0.007
(0.029) (0.055) (0.045) (0.071) (0.080)
Area*Oxen -0.001 -0.001 -0.002 0.001 -0.001
(0.002) (0.005) (0.003) (0.005) (0.005)
Area*Fertilizer 0.000 -0.001 0.000 -0.007* -0.002
(0.002) (0.006) (0.003) (0.004) (0.004)
Area*Hoes 0.002 -0.003 0.001 0.003 0.000
(0.002) (0.004) (0.004) (0.004) (0.005)
Area*Ploughs 0.000 0.007* -0.005 0.005 -0.010*
(0.002) (0.004) (0.004) (0.005) (0.006)
Area*Shannon index -0.006** -0.009 -0.006 0.008 -0.017**
(0.003) (0.005) (0.004) (0.008) (0.007)
Household size*Oxen 0.000 -0.001 0.005 -0.008 -0.005
(0.003) (0.008) (0.005) (0.007) (0.011) Household size*Fertilizer 0.001 0.016* -0.002 0.007 -0.005
(0.003) (0.009) (0.004) (0.006) (0.009)
Household size*Hoes 0.001 0.007 0.002 -0.007 0.015*
(0.003) (0.006) (0.005) (0.006) (0.008) Household size*Ploughs -0.005 -0.016** -0.007 -0.001 -0.007
(0.003) (0.008) (0.006) (0.008) (0.008) Household size*Shannon index 0.003 0.008 0.000 -0.006 -0.007
(0.004) (0.007) (0.006) (0.011) (0.011)
Oxen*Fertilizer -0.000** -0.001 0.000 0.000 0.000
(0.000) (0.001) (0.000) (0.000) (0.001)
Oxen*Hoes 0.000 0 0.001** 0.000 0.000
(0.000) (0.000) (0.000) (0.000) (0.001)
Oxen*Ploughs 0.000 0.000 0.000 0.000 -0.001*
(0.000) (0.001) (0.000) (0.000) (0.001)
Oxen*Shannon index 0.000 0.000 0.000 -0.001 0.000
(0.000) (0.001) (0.000) (0.001) (0.001)
Fertilizer*Hoes 0.000** 0.001** 0.000 0.000 0.000
(0.000) (0.001) (0.000) (0.000) (0.001)
Fertilizer*Ploughs 0.000* -0.001 0.000 0.001 0.000
(0.000) (0.001) (0.000) (0.000) (0.001)
Fertilizer*Shannon index 0.000 0.000 0.000 0.000 -0.001**
(0.000) (0.001) (0.000) (0.001) (0.001)
Hoes*Ploughs 0.000 0.000 -0.001* 0.001 0.000
(0.000) (0.001) (0.000) (0.001) (0.001)
Hoes*Shannon index 0.000 0.001*** 0.000 0.000 -0.002**
(0.000) (0.000) (0.000) (0.001) (0.001)
Ploughs*Shannon index 0.000 -0.001* 0.000 -0.001 0.002***
(0.000) (0.001) (0.001) (0.001) (0.001)
Constant 6.339*** 4.919*** 6.450*** 5.943*** 5.440***
(0.110) (0.353) (0.171) (0.234) (0.411)
Elasticity of Shannon index 0.044* 0.035 0.025 0.115* 0.031
p-value 0.061 0.401 0.529 0.084 0.432
Fixed effects X X X X X
Village-year fixed effects X X X X X
Number of households 1280 289 428 299 264
Number of observations 5804 1323 2002 1456 1023
Average obs. per household 4.534 4.578 4.678 4.87 3.875
R-squared a 0.547 0.659 0.557 0.509 0.454
R-squared w 0.556 0.672 0.571 0.526 0.481
Notes: N. Highlands refers to Northern Highlands. C. Highlands refers to Central highlands. Numbers in parentheses represent clustered standard errors at the household level. As explained in the methodology section, this specification does not include the adjustment proposed by Battese (1997) since there is little within-household variation of input-use. Instead 0 values are assigned the value of 0.000001.
Table 3A.3: Parametric translog full (teff only)
All N. Highlands C. Highlands Other Enset
Area 0.584*** 0.571** 0.538*** 0.523** -0.016
(0.095) (0.258) (0.160) (0.221) (0.261)
Household size 0.163 0.043 -0.273 0.514** -0.151
(0.146) (0.505) (0.336) (0.250) (0.396)
Oxen 0.164*** 0.157 0.074 0.163*** 0.260*
(0.038) (0.095) (0.074) (0.056) (0.147)
Fertilizer 0.032** -0.068 0.039* 0.026 -0.001
(0.013) (0.045) (0.022) (0.018) (0.049)
Hoes 0.033 -0.067 -0.026 0.092** 0.057
(0.028) (0.062) (0.051) (0.045) (0.093)
Ploughs -0.017 0.086 -0.034 -0.001 -0.163**
(0.021) (0.061) (0.037) (0.034) (0.078)
Shannon index 0.177*** 0.129 0.065 0.299*** 0.190
(0.047) (0.086) (0.066) (0.076) (0.133)
Area (square) 0.077*** 0.091* 0.004 -0.104 0.072**
(0.022) (0.054) (0.048) (0.065) (0.034) Household size (square) -0.043 0.100 0.128 -0.243*** 0.001
(0.047) (0.148) (0.095) (0.090) (0.103)
Oxen (square) 0.011*** 0.007 0.004 0.011*** 0.015
(0.003) (0.007) (0.005) (0.004) (0.010)
Fertilizer (square) 0.002** -0.003 0.002 0.002 -0.001
(0.001) (0.004) (0.002) (0.001) (0.003)
Hoes (square) 0.002 -0.005 -0.001 0.004 0.008
(0.002) (0.004) (0.004) (0.003) (0.007)
Ploughs (square) -0.001 0.008** -0.003 0.000 -0.011**
(0.001) (0.004) (0.003) (0.002) (0.005) Shannon index (square) 0.011*** 0.015** 0.003 0.018*** 0.006
(0.003) (0.006) (0.004) (0.005) (0.009)
Area*Household size -0.104** -0.180 -0.016 0.148 0.157
(0.048) (0.143) (0.087) (0.131) (0.112)
Area*Oxen 0.001 -0.003 -0.001 0.013* 0.003
(0.003) (0.007) (0.006) (0.007) (0.007)
Area*Fertilizer -0.001 0.000 0.001 -0.021*** -0.004
(0.003) (0.008) (0.006) (0.007) (0.007)
Area*Hoes 0.003 -0.013* 0.005 0.005 0.009
(0.003) (0.007) (0.006) (0.007) (0.007)
Area*Ploughs -0.006 0.012 -0.021** 0.004 -0.020**
(0.004) (0.009) (0.008) (0.009) (0.008) Area*Shannon index -0.019*** -0.035*** -0.017** -0.009 -0.022**
(0.005) (0.012) (0.009) (0.016) (0.009)
Household size*Oxen -0.007 -0.016 -0.004 -0.012 -0.026*
(0.005) (0.011) (0.009) (0.009) (0.013) Household size*Fertilizer -0.002 0.019 -0.001 0.009 -0.004 (0.005) (0.017) (0.008) (0.009) (0.017)
Household size*Hoes -0.003 0.008 0.011 -0.017** 0.022
(0.005) (0.011) (0.007) (0.008) (0.014)
Household size*Ploughs 0.007 -0.014 -0.005 0.005 0.007
(0.005) (0.014) (0.010) (0.011) (0.012) Household size*Shannon index 0.000 0.028 -0.006 -0.015 -0.040***
(0.006) (0.018) (0.011) (0.015) (0.015)
Oxen*Fertilizer 0.000 0.002 0.000 0.000 0.000
(0.000) (0.001) (0.001) (0.001) (0.001)
Oxen*Hoes 0.000 0.000 0.000 0.000 0.000
(0.000) (0.001) (0.000) (0.000) (0.001)
Oxen*Ploughs 0.000 0.002** 0.000 0.000 -0.001
(0.000) (0.001) (0.001) (0.001) (0.001)
Oxen*Shannon index 0.000 -0.001 0.000 0.001 0.001
(0.000) (0.002) (0.001) (0.001) (0.001)
Fertilizer*Hoes 0.000 0.001 0.000 0.000 0.001
(0.000) (0.001) (0.000) (0.000) (0.001)
Fertilizer*Ploughs 0.000 -0.003** 0.001 0.001 -0.001
(0.000) (0.001) (0.001) (0.001) (0.001) Fertilizer*Shannon index 0.000 -0.002 0.000 0.000 -0.001 (0.000) (0.002) (0.001) (0.001) (0.001)
Hoes*Ploughs 0.000 -0.001 -0.002** 0.000 0.001
(0.000) (0.001) (0.001) (0.001) (0.001)
Hoes*Shannon index 0.001 0.002 0.002** 0.002* -0.002*
(0.000) (0.001) (0.001) (0.001) (0.001) Ploughs*Shannon index 0.001** -0.002 0.001 -0.003** 0.003***
(0.001) (0.002) (0.001) (0.001) (0.001)
Constant 6.345*** 5.469*** 6.846*** 5.786*** 5.771***
(0.146) (0.553) (0.340) (0.232) (0.563) Elasticity of Shannon index 0.153*** 0.186** 0.036 0.252*** 0.096
p-value 0.000 0.019 0.536 0.000 0.254
Table 3A.4: Parametric translog full (no teff)
All N. Highlands C. Highlands Other Enset
Area 0.556*** 0.733*** 0.463*** 0.150 -0.070
(0.078) (0.256) (0.109) (0.219) (0.463)
Household size -0.134 0.246 -0.315 0.069 0.216
(0.162) (0.363) (0.215) (0.574) (0.871)
Oxen 0.101** 0.073 0.093 -0.057 0.296
(0.047) (0.117) (0.058) (0.205) (0.233)
Fertilizer 0.016 -0.094 0.032** 0.019 0.028
(0.014) (0.062) (0.016) (0.033) (0.067)
Hoes 0.033 0.143 0.096** 0.058 -0.258**
(0.034) (0.116) (0.040) (0.121) (0.121)
Ploughs 0.058** 0.029 0.061** 0.244*** 0.180
(0.024) (0.048) (0.031) (0.084) (0.149)
Shannon index -0.004 -0.094 0.095 -0.069 0.011
(0.050) (0.072) (0.081) (0.136) (0.131)
Area (square) -0.015 -0.075 -0.089*** 0.053 -0.009
(0.018) (0.064) (0.025) (0.062) (0.045)
Household size (square) 0.071 0.018 0.125* -0.033 -0.06
(0.047) (0.084) (0.064) (0.149) (0.188)
Oxen (square) 0.008** 0.008 0.007* -0.004 0.023
(0.003) (0.009) (0.004) (0.015) (0.016)
Fertilizer (square) 0.001 -0.006 0.003* 0.004 0.002
(0.001) (0.006) (0.001) (0.003) (0.004)
Hoes (square) 0.002 0.010 0.006** 0.003 -0.019**
(0.002) (0.009) (0.003) (0.009) (0.008)
Ploughs (square) 0.003* 0.000 0.004* 0.016*** 0.008
(0.002) (0.003) (0.002) (0.006) (0.009)
Shannon index (square) -0.001 -0.007 0.006 -0.009 -0.002
(0.003) (0.005) (0.006) (0.009) (0.008)
Area*Household size -0.01 -0.102 0.087 0.205* 0.059
(0.039) (0.089) (0.056) (0.104) (0.120)
Area*Oxen -0.004 -0.001 -0.004 -0.001 -0.018**
(0.003) (0.009) (0.005) (0.009) (0.009)
Area*Fertilizer 0.002 0.007 -0.003 -0.016** -0.005
(0.003) (0.010) (0.004) (0.006) (0.006)
Area*Hoes 0.001 0.001 0.000 0.006 -0.008
(0.003) (0.007) (0.005) (0.008) (0.008)
Area*Ploughs 0.005 0.015** 0.002 0.013 0.01
(0.003) (0.008) (0.005) (0.009) (0.009)
Area*Shannon index -0.002 0.004 -0.002 0.012 -0.017
(0.004) (0.009) (0.005) (0.011) (0.026)
Household size*Oxen 0.004 0.005 0.01 0.002 0.001
(0.005) (0.013) (0.007) (0.015) (0.022) Household size*Fertilizer 0.003 0.020* -0.003 0.011 0.003
(0.004) (0.011) (0.005) (0.010) (0.017)
Household size*Hoes 0.003 0.008 -0.003 0.003 0.008
(0.004) (0.008) (0.007) (0.010) (0.018) Household size*Ploughs -0.013** -0.021* -0.007 -0.013 -0.024
(0.005) (0.011) (0.009) (0.014) (0.020) Household size*Shannon index 0.000 0.005 -0.004 -0.029* -0.016
(0.005) (0.008) (0.007) (0.016) (0.035)
Oxen*Fertilizer -0.001** -0.002* 0.000 0.000 -0.002
(0.000) (0.001) (0.000) (0.001) (0.001)
Oxen*Hoes 0.000 -0.001 0.001*** 0.000 0.001
(0.000) (0.001) (0.000) (0.001) (0.001)
Oxen*Ploughs -0.001*** -0.001 -0.001* -0.001 -0.003*
(0.000) (0.001) (0.001) (0.001) (0.002)
Oxen*Shannon index 0.000 0.000 0.000 -0.001 0.000
(0.000) (0.001) (0.001) (0.001) (0.002)
Fertilizer*Hoes 0.000* 0.002** -0.001 0.000 0.000
(0.000) (0.001) (0.001) (0.001) (0.001)
Fertilizer*Ploughs 0.001* -0.001 0.001 0.001 0.003**
(0.000) (0.001) (0.001) (0.001) (0.001)
Fertilizer*Shannon index 0.000 0.000 0.000 0.001 0.000
(0.000) (0.001) (0.000) (0.001) (0.002)
Hoes*Ploughs 0.000 0.000 -0.001 0.000 0.000
(0.000) (0.001) (0.001) (0.001) (0.001)
Hoes*Shannon index 0.000 0.001 -0.001 0.000 0.001
(0.000) (0.001) (0.001) (0.001) (0.002)
Ploughs*Shannon index 0.000 0.000 0.000 0.000 0.003
(0.000) (0.001) (0.001) (0.001) (0.003)
Constant 6.305*** 4.852*** 6.347*** 6.115*** 5.745***
(0.175) (0.537) (0.222) (0.728) (1.268)
Elasticity of Shannon index 0.000 -0.058 0.076 -0.105 -0.016
p-value 0.997 0.219 0.272 0.382 0.838
Fixed effects X X X X X
Village-year fixed effects X X X X X
Number of households 893 211 344 128 210
Number of observations 3005 779 1323 496 407
Average obs. per household 3.365 3.692 3.846 3.875 1.938
R-squared a 0.547 0.659 0.557 0.509 0.454
R-squared w 0.556 0.672 0.571 0.526 0.481
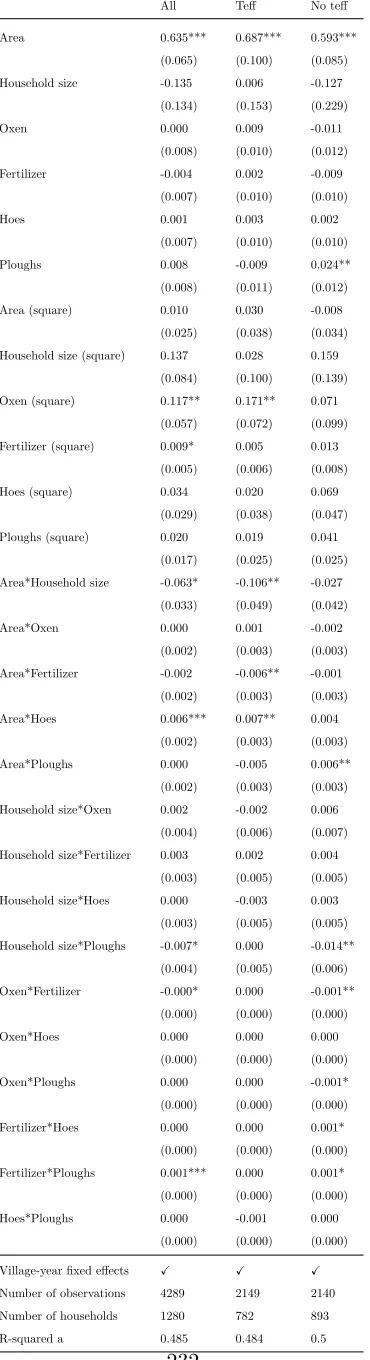
Table 3A.5: Semi-parametric model: Parametric component (Full sample)
All Teff No teff Area 0.635*** 0.687*** 0.593***
(0.065) (0.100) (0.085) Household size -0.135 0.006 -0.127
(0.134) (0.153) (0.229)
Oxen 0.000 0.009 -0.011
(0.008) (0.010) (0.012) Fertilizer -0.004 0.002 -0.009
(0.007) (0.010) (0.010)
Hoes 0.001 0.003 0.002
(0.007) (0.010) (0.010)
Ploughs 0.008 -0.009 0.024**
(0.008) (0.011) (0.012) Area (square) 0.010 0.030 -0.008
(0.025) (0.038) (0.034) Household size (square) 0.137 0.028 0.159
(0.084) (0.100) (0.139) Oxen (square) 0.117** 0.171** 0.071
(0.057) (0.072) (0.099) Fertilizer (square) 0.009* 0.005 0.013
(0.005) (0.006) (0.008) Hoes (square) 0.034 0.020 0.069
(0.029) (0.038) (0.047) Ploughs (square) 0.020 0.019 0.041
(0.017) (0.025) (0.025) Area*Household size -0.063* -0.106** -0.027
(0.033) (0.049) (0.042)
Area*Oxen 0.000 0.001 -0.002
(0.002) (0.003) (0.003) Area*Fertilizer -0.002 -0.006** -0.001
(0.002) (0.003) (0.003) Area*Hoes 0.006*** 0.007** 0.004
(0.002) (0.003) (0.003) Area*Ploughs 0.000 -0.005 0.006** (0.002) (0.003) (0.003) Household size*Oxen 0.002 -0.002 0.006
(0.004) (0.006) (0.007) Household size*Fertilizer 0.003 0.002 0.004
(0.003) (0.005) (0.005) Household size*Hoes 0.000 -0.003 0.003
(0.003) (0.005) (0.005) Household size*Ploughs -0.007* 0.000 -0.014**
(0.004) (0.005) (0.006) Oxen*Fertilizer -0.000* 0.000 -0.001**
(0.000) (0.000) (0.000)
Oxen*Hoes 0.000 0.000 0.000
(0.000) (0.000) (0.000) Oxen*Ploughs 0.000 0.000 -0.001* (0.000) (0.000) (0.000) Fertilizer*Hoes 0.000 0.000 0.001*
(0.000) (0.000) (0.000) Fertilizer*Ploughs 0.001*** 0.000 0.001*
Table 3A.6: Semi-parametric model: Parametric component (Northern Highlands)
All Teff No teff
Area 0.696*** 0.474* 0.988***
(0.143) (0.255) (0.244) Household size 0.022 -0.385 0.116
(0.392) (0.481) (0.529)
Oxen -0.008 0.052* -0.032
(0.022) (0.027) (0.034) Fertilizer 0.008 -0.003 0.024
(0.021) (0.028) (0.036)
Hoes 0.005 -0.004 0.007
(0.017) (0.030) (0.023)
Ploughs 0.001 -0.008 0.016
(0.025) (0.047) (0.031) Area (square) 0.041 0.046 0.010
(0.057) (0.096) (0.104) Household size (square) -0.028 0.286 -0.155
(0.221) (0.281) (0.302) Oxen (square) 0.126 0.042 0.180
(0.202) (0.208) (0.387) Fertilizer (square) -0.016 -0.033 -0.027
(0.026) (0.023) (0.046) Hoes (square) -0.129** -0.119 -0.044
(0.065) (0.072) (0.211) Ploughs (square) 0.063* 0.076 0.081
(0.037) (0.051) (0.075) Area*Household size -0.060 -0.016 -0.116
(0.069) (0.135) (0.091)
Area*Oxen 0.003 0.001 0.010
(0.005) (0.007) (0.010) Area*Fertilizer 0.000 -0.004 0.008
(0.006) (0.006) (0.011)
Area*Hoes 0.007 -0.006 0.007
(0.004) (0.007) (0.007) Area*Ploughs 0.004 0.004 0.015*
(0.005) (0.008) (0.008) Household size*Oxen 0.001 -0.020 0.009
(0.012) (0.015) (0.016) Household size*Fertilizer -0.002 0.007 -0.005
(0.010) (0.015) (0.015) Household size*Hoes 0.009 0.013 0.009
(0.008) (0.014) (0.010) Household size*Ploughs -0.014 -0.010 -0.018
(0.010) (0.014) (0.012) Oxen*Fertilizer -0.001 0.001 -0.003**
(0.001) (0.001) (0.001)
Oxen*Hoes 0.000 -0.001 0.000
(0.001) (0.001) (0.001) Oxen*Ploughs 0.000 0.002 -0.002* (0.001) (0.001) (0.001) Fertilizer*Hoes 0.002** 0.001 0.002***
(0.001) (0.001) (0.001) Fertilizer*Ploughs -0.001 -0.001 0.000
(0.001) (0.002) (0.001) Hoes*Ploughs 0.000 -0.001 0.000
(0.001) (0.001) (0.001) Village-year fixed effects X X X
Table 3A.7: Semi-parametric model: Parametric component (Central Highlands)
All Teff No teff
Area 0.615*** 0.589*** 0.634*** (0.110) (0.176) (0.126) Household size -0.374* -0.380 -0.412
(0.206) (0.291) (0.265) Oxen -0.001 0.003 -0.005
(0.012) (0.019) (0.014) Fertilizer 0.002 0.020 -0.005
(0.011) (0.018) (0.014) Hoes 0.008 0.004 0.011
(0.010) (0.017) (0.013) Ploughs 0.019 -0.007 0.021
(0.014) (0.023) (0.018) Area (square) -0.154*** -0.172* -0.160***
(0.045) (0.089) (0.051) Household size (square) 0.350*** 0.311* 0.393** (0.129) (0.172) (0.167) Oxen (square) 0.009 0.108 -0.027
(0.096) (0.154) (0.115) Fertilizer (square) 0.013* 0.020* 0.012
(0.007) (0.011) (0.009) Hoes (square) 0.083** 0.034 0.136***
(0.033) (0.056) (0.043) Ploughs (square) 0.000 -0.012 0.037
(0.023) (0.037) (0.029) Area*Household size -0.039 -0.025 -0.040
(0.061) (0.091) (0.072) Area*Oxen 0.000 0.011* -0.004
(0.005) (0.007) (0.006) Area*Fertilizer -0.002 0.000 -0.005
(0.004) (0.006) (0.005) Area*Hoes 0.001 0.008 -0.001
(0.005) (0.006) (0.006) Area*Ploughs -0.002 -0.018** 0.003
(0.005) (0.008) (0.006) Household size*Oxen 0.006 0.004 0.006
(0.006) (0.011) (0.008) Household size*Fertilizer 0.000 -0.012 0.006
(0.006) (0.009) (0.007) Household size*Hoes 0.000 -0.003 0.002
(0.006) (0.010) (0.007) Household size*Ploughs -0.012 -0.002 -0.015
(0.007) (0.011) (0.009) Oxen*Fertilizer 0.000 0.000 0.000
(0.000) (0.001) (0.000) Oxen*Hoes 0.001 0.000 0.001** (0.000) (0.001) (0.001) Oxen*Ploughs 0.000 0.001 -0.001**
(0.000) (0.001) (0.001) Fertilizer*Hoes -0.001* 0.000 -0.001
(0.000) (0.000) (0.001) Fertilizer*Ploughs 0.001 0.000 0.001
(0.000) (0.001) (0.001) Hoes*Ploughs -0.001 -0.002** -0.001
Table 3A.8: Semi-parametric model: Parametric component (Arusi/Bale (Other))
All Teff No teff
Area 0.417*** 0.748*** 0.401
(0.160) (0.276) (0.254) Household size 0.228 0.640*** -0.545
(0.236) (0.245) (0.470)
Oxen 0.009 -0.005 0.017
(0.013) (0.016) (0.025) Fertilizer -0.007 0.005 -0.042
(0.012) (0.015) (0.025)
Hoes 0.021* 0.032** 0.025
(0.013) (0.015) (0.023)
Ploughs -0.007 -0.023 0.034
(0.016) (0.020) (0.025) Area (square) 0.080 -0.133 0.275** (0.073) (0.140) (0.139) Household size (square) -0.202 -0.414** 0.178
(0.156) (0.192) (0.268) Oxen (square) 0.162* 0.165* 0.302
(0.090) (0.092) (0.449) Fertilizer (square) 0.002 -0.002 0.035* (0.007) (0.008) (0.021) Hoes (square) 0.062 0.061 0.094
(0.065) (0.072) (0.166) Ploughs (square) 0.019 0.012 0.156* (0.033) (0.035) (0.092) Area*Household size 0.025 -0.048 0.067
(0.077) (0.161) (0.113)
Area*Oxen -0.004 0.007 -0.009
(0.005) (0.008) (0.009) Area*Fertilizer -0.004 -0.015** -0.011
(0.004) (0.006) (0.007)
Area*Hoes 0.004 0.004 0.011
(0.005) (0.007) (0.008) Area*Ploughs 0.002 -0.004 0.011
(0.005) (0.008) (0.008) Household size*Oxen -0.003 0.001 -0.006
(0.007) (0.010) (0.012) Household size*Fertilizer 0.007 0.007 0.011
(0.006) (0.008) (0.009) Household size*Hoes -0.009 -0.015* -0.006
(0.007) (0.009) (0.011) Household size*Ploughs 0.004 0.009 -0.012
(0.007) (0.009) (0.013) Oxen*Fertilizer 0.000 0.000 0.000
(0.000) (0.000) (0.001)
Oxen*Hoes 0.000 0.000 0.001
(0.000) (0.001) (0.001) Oxen*Ploughs 0.000 -0.001 0.000
(0.001) (0.001) (0.001) Fertilizer*Hoes 0.000 0.000 0.000
(0.000) (0.001) (0.001) Fertilizer*Ploughs 0.001 0.000 0.000
(0.000) (0.001) (0.001) Hoes*Ploughs 0.000 0.000 0.000
(0.001) (0.001) (0.001) Village-year fixed effects X X X
Table 3A.9: Semi-parametric model: Parametric component (Enset)
All Teff No teff
Area 0.365* 0.578** -0.063
(0.192) (0.277) (0.275) Household size -0.127 -0.359 1.214
(0.399) (0.476) (0.867)
Oxen -0.004 0.011 -0.034
(0.029) (0.033) (0.045) Fertilizer -0.018 -0.003 -0.045
(0.023) (0.038) (0.057)
Hoes -0.059** -0.066** -0.024
(0.025) (0.030) (0.047)
Ploughs -0.010 -0.012 0.012
(0.025) (0.029) (0.052) Area (square) 0.017 0.026 0.022
(0.054) (0.076) (0.085) Household size (square) 0.276 0.298 -0.191
(0.223) (0.253) (0.464) Oxen (square) 0.221 0.280 0.054
(0.173) (0.248) (0.386) Fertilizer (square) 0.000 -0.003 -0.022
(0.017) (0.019) (0.031) Hoes (square) -0.018 0.212 -0.347
(0.135) (0.172) (0.265) Ploughs (square) 0.146 0.134 0.062
(0.117) (0.137) (0.165) Area*Household size -0.016 -0.118 0.201*
(0.087) (0.119) (0.115) Area*Oxen -0.001 -0.001 -0.002
(0.006) (0.008) (0.008) Area*Fertilizer -0.008* -0.009 -0.007
(0.005) (0.006) (0.008) Area*Hoes -0.001 -0.002 -0.008
(0.006) (0.007) (0.009) Area*Ploughs -0.007 0.000 -0.006
(0.006) (0.008) (0.009) Household size*Oxen 0.002 -0.005 0.016
(0.013) (0.015) (0.023) Household size*Fertilizer 0.010 0.010 0.031
(0.011) (0.016) (0.027) Household size*Hoes 0.021** 0.020 0.020
(0.011) (0.013) (0.019) Household size*Ploughs -0.011 -0.007 -0.021
(0.010) (0.011) (0.019) Oxen*Fertilizer 0.001 0.002 -0.001
(0.001) (0.001) (0.001)
Oxen*Hoes 0.000 0.000 0.001
(0.001) (0.001) (0.002) Oxen*Ploughs -0.002* -0.002 -0.001
(0.001) (0.001) (0.002) Fertilizer*Hoes 0.000 0.000 0.001
Figure 3A.3: Effect of Shannon index Semi parametric Full sample
(a) Full sample
(b) Non teff-producing households (c) Teff-producing households
Figure 3A.4: Effect of Shannon index Semi parametric Northern Highlands
(a) Full sample
Figure 3A.5: Effect of Shannon index Semi parametric Central Highlands
(a) Full sample
(b) Non teff-producing households (c) Teff-producing households
Figure 3A.6: Effect of Shannon index Semi parametric Arussi/Bale
(a) Full sample
Figure 3A.7: Effect of Shannon index Semi parametric Enset
(a) Full sample
(b) Non teff-producing households (c) Teff-producing households
Table 3A.10: Bandwidth choice
All N. Highlands C. Highlands Other Enset
Main 0.43 0.67 0.51 0.43 0.44
No teff 0.35 0.29 0.46 0.36 0.22
Teff 0.5 0.51 0.4 0.49 0.33
A.1 Battese Correction Main Sample
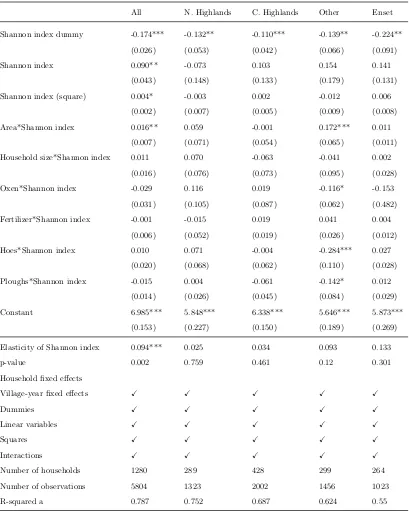
Table 3A.11: Main results : Parametric translog (Battese adjustment)
All N. Highlands C. Highlands Other Enset
Shannon index dummy -0.174*** -0.132** -0.110*** -0.139** -0.224**
(0.026) (0.053) (0.042) (0.066) (0.091)
Shannon index 0.090** -0.073 0.103 0.154 0.141
(0.043) (0.148) (0.133) (0.179) (0.131)
Shannon index (square) 0.004* -0.003 0.002 -0.012 0.006
(0.002) (0.007) (0.005) (0.009) (0.008)
Area*Shannon index 0.016** 0.059 -0.001 0.172*** 0.011
(0.007) (0.071) (0.054) (0.065) (0.011)
Household size*Shannon index 0.011 0.070 -0.063 -0.041 0.002
(0.016) (0.076) (0.073) (0.095) (0.028)
Oxen*Shannon index -0.029 0.116 0.019 -0.116* -0.153
(0.031) (0.105) (0.087) (0.062) (0.482)
Fertilizer*Shannon index -0.001 -0.015 0.019 0.041 0.004
(0.006) (0.052) (0.019) (0.026) (0.012)
Hoes*Shannon index 0.010 0.071 -0.004 -0.284*** 0.027
(0.020) (0.068) (0.062) (0.110) (0.028)
Ploughs*Shannon index -0.015 0.004 -0.061 -0.142* 0.012
(0.014) (0.026) (0.045) (0.084) (0.029)
Constant 6.985*** 5.848*** 6.338*** 5.646*** 5.873***
(0.153) (0.227) (0.150) (0.189) (0.269)
Elasticity of Shannon index 0.094*** 0.025 0.034 0.093 0.133
p-value 0.002 0.759 0.461 0.12 0.301
Household fixed effects
Village-year fixed effects X X X X X
Dummies X X X X X
Linear variables X X X X X
Squares X X X X X
Interactions X X X X X
Number of households 1280 289 428 299 264
Number of observations 5804 1323 2002 1456 1023
R-squared a 0.787 0.752 0.687 0.624 0.55
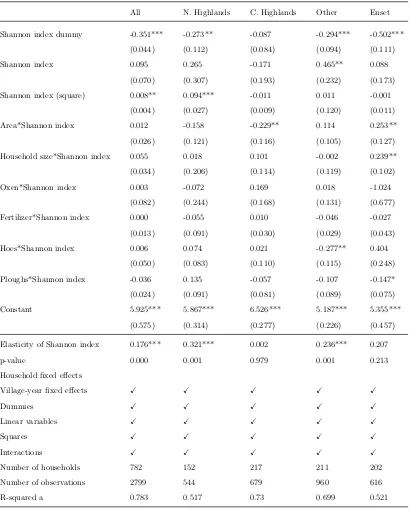
Table 3A.12: Main results : Parametric translog - Teff only (Battese adjustment)
All N. Highlands C. Highlands Other Enset
Shannon index dummy -0.351*** -0.273** -0.087 -0.294*** -0.502***
(0.044) (0.112) (0.084) (0.094) (0.111)
Shannon index 0.095 0.265 -0.171 0.465** 0.088
(0.070) (0.307) (0.193) (0.232) (0.173)
Shannon index (square) 0.008** 0.094*** -0.011 0.011 -0.001
(0.004) (0.027) (0.009) (0.120) (0.011)
Area*Shannon index 0.012 -0.158 -0.229** 0.114 0.253**
(0.026) (0.121) (0.116) (0.105) (0.127)
Household size*Shannon index 0.055 0.018 0.101 -0.002 0.239**
(0.034) (0.206) (0.114) (0.119) (0.102)
Oxen*Shannon index 0.003 -0.072 0.169 0.018 -1.024
(0.082) (0.244) (0.168) (0.131) (0.677)
Fertilizer*Shannon index 0.000 -0.055 0.010 -0.046 -0.027
(0.013) (0.091) (0.030) (0.029) (0.043)
Hoes*Shannon index 0.006 0.074 0.021 -0.277** 0.404
(0.050) (0.083) (0.110) (0.115) (0.248)
Ploughs*Shannon index -0.036 0.135 -0.057 -0.107 -0.147*
(0.024) (0.091) (0.081) (0.089) (0.075)
Constant 5.925*** 5.867*** 6.526*** 5.187*** 5.355***
(0.575) (0.314) (0.277) (0.226) (0.457)
Elasticity of Shannon index 0.176*** 0.321*** 0.002 0.236*** 0.207
p-value 0.000 0.001 0.979 0.001 0.213
Household fixed effects
Village-year fixed effects X X X X X
Dummies X X X X X
Linear variables X X X X X
Squares X X X X X
Interactions X X X X X
Number of households 782 152 217 211 202
Number of observations 2799 544 679 960 616
R-squared a 0.783 0.517 0.73 0.699 0.521
Notes: N. Highlands refers to Northern Highlands. C. Highlands refers to Central highlands. The specification in the regression is a translog specification and the full list of coefficients can be seen in Table 3A.21
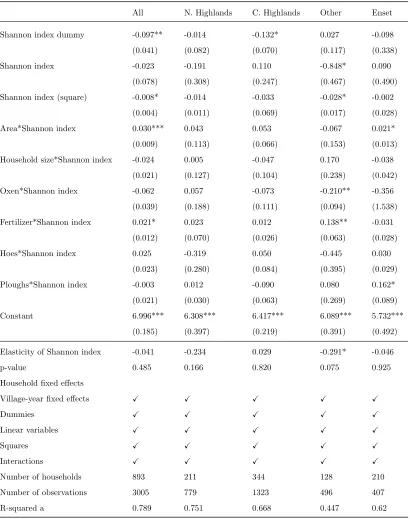
Table 3A.13: Main results : Parametric translog - No teff (Battese adjustment)
All N. Highlands C. Highlands Other Enset
Shannon index dummy -0.097** -0.014 -0.132* 0.027 -0.098
(0.041) (0.082) (0.070) (0.117) (0.338)
Shannon index -0.023 -0.191 0.110 -0.848* 0.090
(0.078) (0.308) (0.247) (0.467) (0.490)
Shannon index (square) -0.008* -0.014 -0.033 -0.028* -0.002
(0.004) (0.011) (0.069) (0.017) (0.028)
Area*Shannon index 0.030*** 0.043 0.053 -0.067 0.021*
(0.009) (0.113) (0.066) (0.153) (0.013)
Household size*Shannon index -0.024 0.005 -0.047 0.170 -0.038
(0.021) (0.127) (0.104) (0.238) (0.042)
Oxen*Shannon index -0.062 0.057 -0.073 -0.210** -0.356
(0.039) (0.188) (0.111) (0.094) (1.538)
Fertilizer*Shannon index 0.021* 0.023 0.012 0.138** -0.031
(0.012) (0.070) (0.026) (0.063) (0.028)
Hoes*Shannon index 0.025 -0.319 0.050 -0.445 0.030
(0.023) (0.280) (0.084) (0.395) (0.029)
Ploughs*Shannon index -0.003 0.012 -0.090 0.080 0.162*
(0.021) (0.030) (0.063) (0.269) (0.089)
Constant 6.996*** 6.308*** 6.417*** 6.089*** 5.732***
(0.185) (0.397) (0.219) (0.391) (0.492)
Elasticity of Shannon index -0.041 -0.234 0.029 -0.291* -0.046
p-value 0.485 0.166 0.820 0.075 0.925
Household fixed effects
Village-year fixed effects X X X X X
Dummies X X X X X
Linear variables X X X X X
Squares X X X X X
Interactions X X X X X
Number of households 893 211 344 128 210
Number of observations 3005 779 1323 496 407
R-squared a 0.789 0.751 0.668 0.447 0.62
Table 3A.14: Parametric translog full (Battese transformation)
All N. Highlands C. Highlands Other Enset
Fertilizer dummy -0.229*** -0.469** -0.225** -0.133 -0.303**
(0.056) (0.190) (0.102) (0.111) (0.120)
Oxen dummy -0.070*** -0.099** -0.088** -0.151*** -0.066
(0.022) (0.046) (0.038) (0.045) (0.059)
Hoe dummy -0.017 0.031 -0.014 -0.103** 0.054
(0.021) (0.041) (0.037) (0.042) (0.060)
Plough dummy -0.085*** 0.002 -0.109** -0.073 -0.099*
(0.024) (0.049) (0.042) (0.050) (0.054)
Shannon index dummy -0.174*** -0.132** -0.110*** -0.139** -0.224**
(0.026) (0.053) (0.042) (0.066) (0.091)
Area 0.641*** 0.562*** 0.633*** 0.618*** 0.543***
(0.036) (0.074) (0.068) (0.099) (0.104)
Household size -0.070 0.120 -0.217** 0.177 -0.348*
(0.060) (0.121) (0.103) (0.143) (0.200)
Oxen 0.411*** 0.610* 0.279* 0.288 1.601***
(0.106) (0.325) (0.160) (0.208) (0.567)
Fertilizer -0.138*** -0.339** -0.136** -0.048 -0.285***
(0.035) (0.169) (0.057) (0.066) (0.099)
Hoes 0.006 -0.430** 0.250** -0.049 0.085
(0.081) (0.217) (0.124) (0.161) (0.270)
Ploughs -0.009 0.107 -0.030 0.050 -0.032
(0.062) (0.132) (0.093) (0.127) (0.349)
Shannon index 0.090** -0.073 0.103 0.154 0.141
(0.043) (0.148) (0.133) (0.179) (0.131)
Area (square) -0.002 -0.005 -0.072*** 0.023 0.012
(0.007) (0.018) (0.015) (0.022) (0.017)
Household size (square) 0.044** 0.009 0.057* -0.059 0.135**
(0.020) (0.043) (0.035) (0.047) (0.060)
Oxen (square) -0.015 -0.319 -0.059 0.130 0.046
(0.055) (0.254) (0.082) (0.098) (0.241)
Fertilizer (square) 0.035*** 0.040 0.031*** 0.023*** 0.049***
(0.005) (0.034) (0.008) (0.009) (0.015)
Hoes (square) 0.016 -0.006 0.014 0.065 -0.156
(0.028) (0.075) (0.038) (0.062) (0.112)
Ploughs (square) 0.000 0.012 0.017 0.028 -0.054
(0.018) (0.043) (0.026) (0.035) (0.099)
Shannon index (square) 0.004* -0.003 0.002 -0.012 0.006
(0.002) (0.007) (0.005) (0.009) (0.008)
Area*Household size -0.033* 0.006 0.031 -0.042 0.019
(0.018) (0.039) (0.035) (0.050) (0.049)
Area*Oxen 0.041 -0.043 0.036 0.258*** -0.124
(0.032) (0.072) (0.055) (0.071) (0.124)
Area*Fertilizer -0.008 -0.005 -0.021** -0.023* -0.036**
(0.006) (0.025) (0.010) (0.012) (0.016)
Area*Hoes 0.024 -0.125** 0.105** -0.084* 0.027
(0.023) (0.063) (0.045) (0.048) (0.054)
Area*Ploughs 0.009 0.048 -0.061* -0.042 -0.010
(0.018) (0.037) (0.031) (0.045) (0.067)
Area*Shannon index 0.016** 0.059 -0.001 0.172*** 0.011
(0.007) (0.071) (0.054) (0.065) (0.011)
Household size*Oxen -0.073 -0.073 0.042 -0.140 -0.738**
(0.053) (0.135) (0.082) (0.096) (0.289)
Household size*Fertilizer -0.006 0.045 0.011 0.001 0.010
(0.008) (0.039) (0.014) (0.018) (0.029)
Household size*Hoes 0.046 0.261** -0.016 0.041 0.071
(0.037) (0.117) (0.060) (0.071) (0.114)
Household size*Ploughs 0.021 -0.047 -0.004 0.107* 0.066
(0.029) (0.062) (0.046) (0.062) (0.132)
Household size*Shannon index 0.011 0.070 -0.063 -0.041 0.002
(0.016) (0.076) (0.073) (0.095) (0.028)
Oxen*Fertilizer -0.026** -0.043 -0.029 -0.026 0.025
(0.012) (0.050) (0.020) (0.026) (0.055)
Oxen*Hoes -0.055 0.046 -0.072 0.011 -0.048
(0.044) (0.150) (0.067) (0.082) (0.178)
Oxen*Ploughs 0.006 -0.060 0.086* -0.132* -0.088
(0.034) (0.094) (0.049) (0.068) (0.206)
Oxen*Shannon index -0.029 0.116 0.019 -0.116* -0.153
(0.031) (0.105) (0.087) (0.062) (0.482)
Fertilizer*Hoes 0.005 0.021 -0.010 0.003 0.032
(0.010) (0.049) (0.015) (0.022) (0.033)
Fertilizer*Ploughs 0.004 -0.029 0.008 -0.027 -0.034
(0.007) (0.028) (0.011) (0.017) (0.038)
Fertilizer*Shannon index -0.001 -0.015 0.019 0.041 0.004
(0.006) (0.052) (0.019) (0.026) (0.012)
Hoes*Ploughs -0.038* -0.008 -0.078** 0.000 0.09
(0.022) (0.056) (0.032) (0.049) (0.094)
Hoes*Shannon index 0.010 0.071 -0.004 -0.284*** 0.027
(0.020) (0.068) (0.062) (0.110) (0.028)
Ploughs*Shannon index -0.015 0.004 -0.061 -0.142* 0.012
(0.014) (0.026) (0.045) (0.084) (0.029)
Constant 6.985*** 5.848*** 6.338*** 5.646*** 5.873***
(0.153) (0.227) (0.150) (0.189) (0.269)
Elasticity of Shannon index 0.094*** 0.025 0.034 0.093 0.133
p-value 0.002 0.759 0.461 0.12 0.301
Fixed effects
Village-year fixed effects X X X X X
Number of households 1280 289 428 299 264
Number of observations 5804 1323 2002 1456 1023
R-squared a 0.787 0.752 0.687 0.624 0.55
Notes: N. Highlands refers to Northern Highlands. C. Highlands refers to Central highlands.
Table 3A.15: Parametric translog teff only (Battese transformation)
All N. Highlands C. Highlands Other Enset
Fertilizer dummy -0.095 -0.338 -0.175 -0.118 -0.012
(0.079) (0.248) (0.140) (0.137) (0.186)
Oxen dummy -0.070** -0.101 -0.119* -0.035 -0.047
(0.032) (0.082) (0.065) (0.054) (0.070)
Hoe dummy -0.018 -0.020 -0.044 -0.086* 0.110
(0.030) (0.071) (0.057) (0.047) (0.079)
Plough dummy -0.101*** 0.061 -0.113 -0.056 -0.138**
(0.035) (0.088) (0.073) (0.064) (0.067)
Shannon index dummy -0.351*** -0.273** -0.087 -0.294*** -0.502***
(0.044) (0.112) (0.084) (0.094) (0.111)
Area 0.652*** 0.635*** 0.692*** 0.694*** 0.423**
(0.054) (0.134) (0.124) (0.156) (0.171)
Household size 0.004 -0.008 0.026 0.375** -0.369
(0.090) (0.220) (0.170) (0.177) (0.334)
Oxen 0.270* 0.220 -0.148 0.048 1.521*
(0.142) (0.430) (0.306) (0.201) (0.908)
Fertilizer -0.024 0.073 -0.072 -0.010 -0.160
(0.047) (0.280) (0.080) (0.073) (0.145)
Hoes -0.116 -0.505* -0.097 0.050 0.329
(0.101) (0.290) (0.194) (0.159) (0.373)
Ploughs 0.006 0.185 0.050 -0.066 -0.274
(0.081) (0.201) (0.148) (0.124) (0.414)
Shannon index 0.095 0.265 -0.171 0.465** 0.088
(0.070) (0.307) (0.193) (0.232) (0.173)
Area (square) 0.027** 0.008 -0.075** -0.098** 0.056*
(0.011) (0.032) (0.038) (0.039) (0.030)
Household size (square) 0.029 0.057 -0.040 -0.137** 0.184**
(0.030) (0.086) (0.060) (0.061) (0.085)
Oxen (square) -0.027 -0.573* 0.129 0.065 -0.246
(0.070) (0.314) (0.191) (0.089) (0.380)
Fertilizer (square) 0.022*** -0.031 0.021* 0.011 0.037*
(0.007) (0.058) (0.012) (0.010) (0.020)
Hoes (square) 0.013 -0.031 0.056 0.041 -0.224
(0.035) (0.096) (0.055) (0.058) (0.153)
Ploughs (square) 0.001 0.021 0.004 -0.015 0.013
(0.024) (0.057) (0.043) (0.034) (0.122)
Shannon index (square) 0.008** 0.094*** -0.011 0.011 -0.001
(0.004) (0.027) (0.009) (0.120) (0.011)
Area*Household size -0.067** -0.087 -0.047 0.093 0.098
(0.027) (0.086) (0.070) (0.088) (0.075)
Area*Oxen 0.094** -0.043 0.064 0.261*** -0.092
(0.048) (0.111) (0.118) (0.074) (0.235)
Area*Fertilizer -0.002 -0.048 -0.003 -0.049*** -0.016
(0.008) (0.039) (0.020) (0.018) (0.024)
Area*Hoes 0.038 -0.107 0.085 0.008 0.210**
(0.031) (0.108) (0.077) (0.065) (0.082)
Area*Ploughs 0.012 0.063 -0.057 0.012 -0.077
(0.024) (0.067) (0.055) (0.058) (0.077)
Area*Shannon index 0.012 -0.158 -0.229** 0.114 0.253**
(0.026) (0.121) (0.116) (0.105) (0.127)
Household size*Oxen 0.000 0.225 0.251* -0.080 -0.629
(0.070) (0.211) (0.149) (0.092) (0.493)
Household size*Fertilizer -0.025** -0.085 0.017 -0.002 -0.002
(0.012) (0.084) (0.021) (0.020) (0.043)
Household size*Hoes 0.090* 0.304* 0.109 -0.024 0.135
(0.048) (0.171) (0.099) (0.072) (0.152)
Household size*Ploughs -0.005 -0.126 -0.063 0.074 0.043
(0.039) (0.110) (0.074) (0.065) (0.152)
Household size*Shannon index 0.055 0.018 0.101 -0.002 0.239**
(0.034) (0.206) (0.114) (0.119) (0.102)
Oxen*Fertilizer -0.025 0.183** -0.065** 0.012 0.03
(0.016) (0.090) (0.030) (0.024) (0.094)
Oxen*Hoes -0.066 -0.105 -0.201* -0.054 -0.083
(0.055) (0.196) (0.106) (0.078) (0.310)
Oxen*Ploughs 0.048 0.078 0.159* -0.038 0.135
(0.044) (0.125) (0.082) (0.063) (0.286)
Oxen*Shannon index 0.003 -0.072 0.169 0.018 -1.024
(0.082) (0.244) (0.168) (0.131) (0.677)
Fertilizer*Hoes 0.007 0.118 -0.003 0.004 0.013
(0.012) (0.076) (0.021) (0.023) (0.048)
Fertilizer*Ploughs -0.003 -0.133* -0.001 0.003 -0.028
(0.009) (0.072) (0.016) (0.018) (0.048)
Fertilizer*Shannon index 0.000 -0.055 0.010 -0.046 -0.027
(0.013) (0.091) (0.030) (0.029) (0.043)
Hoes*Ploughs -0.019 0.054 -0.081* 0.006 0.143
(0.028) (0.071) (0.047) (0.048) (0.112)
Hoes*Shannon index 0.006 0.074 0.021 -0.277** 0.404
(0.050) (0.083) (0.110) (0.115) (0.248)
Ploughs*Shannon index -0.036 0.135 -0.057 -0.107 -0.147*
(0.024) (0.091) (0.081) (0.089) (0.075)