2016 International Conference on Artificial Intelligence: Techniques and Applications (AITA 2016) ISBN: 978-1-60595-389-2
A Method for Large-Scale IPTV Quality Estimation
Xiao-tong QIU
1, Li-sheng HUANG
2, Wen-jie
JIANG
3and Ming XIAN
31
UoG-UESTC Joint School, University of Electronic Science and Technology of China, Sichuan Chengdu, China
2
School of Computer Science & Engineering. University of Electronic Science and Technology of China, Sichuan Chengdu, China
3China Telecom Sichuan Branch, Sichuan Chengdu, China
Keywords: IPTV, Quality of experience, Estimation, Data-mining.
Abstract. Estimating the Quality of Large-Scale IPTV service is becoming difficult for internet service providers (ISPs), most ISPs have collected massive network operation data but such data seems have no matter with IPTV quality. In this paper, we demonstrated that the network data is significantly related with QoE (Quality of Experience) and proposed a data-mining based method for IPTV QoE estimation. The result of experiment based on real data set shows the accuracy and validity of our evaluation method.
Introduction
ISPs such as China Telecom, CMCC implemented mass IPTV operations based on broadband IP network[1]. However, there are myriad complaints about IPTV quality as users’ satisfaction towards IPTV services declines and ISPs fail to detect deterioration phenomena of quality of IPTV so that they cannot predict complaints and solve them in advance[2]. On the other hand, IPTV services accumulate scads of operation data which cannot be applied as expected during daily operation. Thus, to enhance experience, perform pre-maintenance and boost trust of clients, ISPs need to find a way to take full use of such network operation data, and retrieve Quality of experience for every IPTV user.
Relative work
Traditional evaluation methods of IPTV QoE can be classified as full reference evaluation, reduced reference evaluation and no reference evaluation[3]. Those methods mainly rely on decoding and analyzing of video itself and comparison between damage video and the original one. But in a real situation, operators could only perform mining analysis with present collected data rather than obtain video frames one by one from each clients to perform quality analysis to a content level. Therefore, in this paper, we focus on QoE evaluation method based on data mining.
There are two main aspects of research of QoE: QoE index selection analysis and QoE evaluation method. Data-mining is mainly applied in QoE index selection analysis and generally contains factor analysis[4], principal components analysis[5], correlation analysis[6], regression analysis and AHP analysis[7]. These five data mining methods described above is more applied in QoE index analysis, however, most researchers take one or two data mining methods alone to analysis QoE indexes without integration so that indexes selected could not be key indexes. Like the research in IP network video stream QoE evaluation model from Dalu Zhang, multi-regression analysis was used to obtain the predictive equation between indexes and QoE, however, the index selection relied on expertise so that is was hardly possible to prove correlation between indexes and QoE.
Selection of IPTV QoE Key Indexes
dimensionality reduction operation to reduce computing resource consumption during QoE data analysis.
[image:2.595.98.500.163.289.2]Original IPTV data selected by a provincial operator which includes more than 20 kinds of original indexes is used in this paper. After being cleaned and pretreatment, the preserved ones are divided into following 5 types.
Table 1. IPTV original indexes.
Index type Indexes
coding Bit rate, frame rate, video compression rate, fault tolerance Service platform Maximum number of concurrent, average response time
network Packet loss rate, jitter, delay, dropping rate, connectivity rate
Terminal CPU utilization, memory utilization
Application Delay factor (DF), Media loss rate (MLR)
In the following chapters, analysis, selection, dimensionality reduction will be performed to these indexes and quantitative relation will be determined between indexes and QoE.
Basic steps of index analysis are as follow:
Step 1: analyze index variables using factor analysis, i.e. using KMO test to determine whether it is necessary to analyze these indexes with factor analysis. If the KMO value is more than 0.7, it is necessary to perform factor analysis; otherwise, it is not necessary to perform factor analysis because lack of correlation between indexes which indicates independence of indexes.
Values of KMO statistic should range from -1 to 1. The KMO testing equation adopted in this paper is shown below.
2 i
2 2
j ij i j ij i j ij
r KMO
r a
(1)In the equation above, rij is the Pearson correlation coefficient between two variables; aij is the
partial correlation coefficient between two variables.
Pearson correlation coefficient mainly describes close degree between variables and it is represented by r whose formula is demonstrated below.
1
2 2
1 1
n
i i
i
n n
i i
i i
X E X Y E Y
r
X E X Y E Y
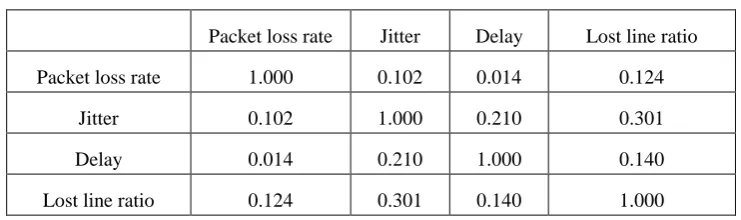
(2) [image:2.595.112.483.677.787.2]Due to the limited space, only a part of the KMO testing process of QoE indexes of IPTV bear network is illustrated in this paper. Simple correlation coefficients and partial coefficients between IPTV bear network QoE indexes are listed in the following table.
Table 2. Partial correlation coefficients between IPTV bear network indexes.
Packet loss rate Jitter Delay Lost line ratio
Packet loss rate 1.000 0.102 0.014 0.124
Jitter 0.102 1.000 0.210 0.301
Delay 0.014 0.210 1.000 0.140
With simple correlation coefficients of IPTV bear network, it is possible to determine the quadratic sum of all index simple correlation coefficient is 1.169 and the quadratic sum of all partial correlation coefficient is 0.237 so that according to the equation given before, the KMO value of IPTV bear network QoE index is 0.83. In a same manner, the KMO value of IPTV bear network QoE index is 0.78 and the KMO value of client terminal performance QoE is 0.80 which indicates that there three types of index are correlated and can be factor analyzed.
Step2: Perform dimensionalityreduction with principal components analysis, transfer correlated indexes to non-correlated indexes to reduce the amount of indexes. In multi-index analysis, principal components analysis, PCA, is a common method. Selected indexes are mapped to a group of factors by linear transformation, m factors with maximum deviations whose cumulative is supposed to reach the range of 75% to 95% is chosen. IPTV bear network QoE index will be taken as an example to introduce the process of dimensionality reduction using principal components analysis and steps in detail are illustrated as follow.
At first, set a 6*5 matrix A where 5 is the number of indexes and 6 is the number of index samples. The matrix is shown below.
0.025 50 240 30 70 0.019 40 224 26 74 0.018 35 210 24 76 =
0.026 28 198 19 81 0.021 26 176 16 84 0.014 20 172 20 80 A
Then, implement zero-mean normalization to matrix A and get a 6*5 matrix D which is shown below.
1.094 1.705 1.502 1.602 -1.602 -0.365 0.692 0.847 0.748 -0.748 -0.608 0.186 0.273 0.320 -0.320 1.337 -0.523 -0.219 -0.748 0.748 0.122 -0.726 -1.120 -1.388 1.388 -1.580 -1.334 -1.284 -0.534 0.534 D
Finally, the 5*5 covariance matrix R is computed as follow. 1.200 0.564 0.554 0.192 -0.192
0.564 1.200 1.168 1.084 -1.084
0.554 1.168 1.200 1.106 -1.106
0.192 1.084 1.106 1.200 -1.200
-0.192 -1.084 -1.106 -1.200 1.200
R
Determine 5 characteristic values and characteristic vectors of the covariance matrix. The larger characteristic value is, the more information the characteristic vector contains. The formula of contribution of principal component variance is shown below.
i 1 2 6 Cont=λ /( + + )
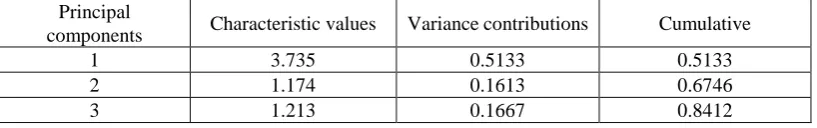
[image:3.595.95.504.721.785.2](3) Characteristic values of the covariance matrix and variance contributions are illustrated in the following table.
Table 3. Characteristic values of the covariance matrix and variance contributions.
Principal
components Characteristic values Variance contributions Cumulative
1 3.735 0.5133 0.5133
2 1.174 0.1613 0.6746
From Table 3, we see that selecting three principal components and the cumulative will be 86.12%, nevertheless, the cumulative of two principal components is only 67.46%. Thus, three principal components are selected.
[image:4.595.75.519.192.293.2]Ultimately, calculate corresponding characteristic values, i.e., loading factor, of each principal components indexes and find out which index contribute most to principal components using loading factors. For the convenience of selection, characteristic vectors are sorted from large one to small one according to their weights as follow.
Table 4. Characteristic vectors of covariance matrix.
First principal component Second principal component Third principal component Index First vector Index Second vector Index Third vector
Packet loss rate 3.363 Packet loss rate 4.012 Packet loss rate 3.102
Jitter 1.012 Jitter 1.109 Jitter 1.054
Delay 1.132 Delay -1.018 Delay -1.065
Lost line ratio -0.076 Lost line ratio -0.182 Lost line ratio -0.168
From the table above, in the first principal component, only the coefficient of dropping rate is over 2.00 and others are all less than 2.00; what is more, it is the same for the second and third principal components. Thus, a conclusion can be drawn that other indexes contribute little to the principal component so that they can be deleted from corresponding principal components and reach the conclusion that dropping rate affects the first principal components, jitter affects the second principal components and delay is the index which affects the third principal components.
[image:4.595.139.459.485.578.2]Step 3: All key indexes among three types of indexes are determined in step 2. However, whether these indexes would affect QoE is uncertain. So we judge whether theses indexes are key indexes with Pearson correlation coefficient which helps to analyze relation between these indexes and QoE. Implement Pearson correlation analysis to QoE indexes selected in step 2 using two-sided test and the result is shown in Table 5.
Table 5. Correlation coefficients of IPTV bear network QoE indexes.
MOS Dropping rate Jitter Delay
MOS 1.000 -0.623 -0.767 -0.698
Lost line ratio -0.623 1.000 0.228 0.070
Jitter -0.767 0.228 1.000 0.480
Delay -0.698 0.070 0.480 1.000
MOS value in Table 5 which represents clients’ true feelings being a result of subjective ratings from clients by a large number of telephone follow-ups and ranging from 0 to 5 can be taken as base of IPTV indexes correlation tests.
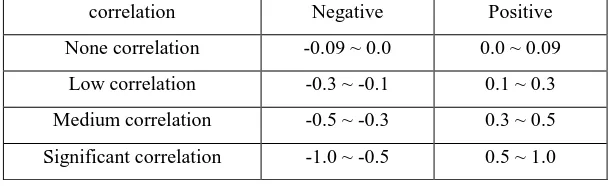
In order to introduce the relation between correlation coefficients and correlation, qualitative range of correlation between indexes is given in the following table.
Table 6. The relation between correlation coefficients and correlation.
correlation Negative Positive
[image:4.595.145.450.687.780.2]In accordance to the relation between Pearson correlation coefficient and correlation, it can be told that IPTV bear network indexes and MOS values are significant correlated and indexes are low correlated or medium correlated, i.e. indexes after dimensionality reduction meet the requirement. Similarly, indexes obtained by IPTV video QoE parameters and client terminal performance QoE parameters also satisfy the condition described, i.e., indexes selected by principal components analysis are key ones of QoE.
IPTV QoE Evaluation Model
According to the result of index analysis, key indexes affecting IPTV QoE are redirected into three types: IPTV video QoE parameters, IPTV bear network QoE parameters and client terminal performance QoE parameters. Define IPTV QoE score as the formula below.
,
SMOS mos u MOS N V
(4) SMOS is the expected IPTV QoE value which is real number from 0 to 1; mos(u) is the evaluation value of client terminal performance QoE parameters after fitting the range of 0 to 5.
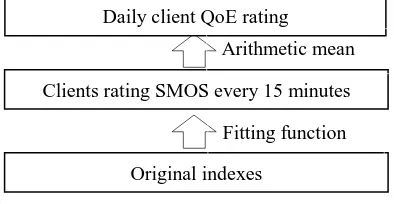
[image:5.595.194.391.344.446.2]In this evaluation model, the independent variable is evaluation indexes affecting QoE and the dependent variable is QoE. By the QoE index system structure, the flow chart of evaluation is shown as follow.
Figure 1. IPTV QoE evaluation process.
In this paper, regression analysis is adopted to perform quantitative calculation between original indexes and QoE. Function between indexes and QoE is determined and steps of regression analysis is as follow.
1) Be aware of which are independent and dependent variables respectively in the regression equation. From the QoE evaluation model described, it is known that once the regression equation between MOS(N,V) and mos(u) is determined, the regression equation related to indexes and QoE can be fully discovered. Thus, there are two regression equations in this chapter, dependent variables are MOS(N,V) and mos(u) respectively, while independent variables are their corresponding indexes. 2) Be aware of regression model. Multi-indexes problem which is simply a condition that each dependent variable has multiple indexes is involved in building regression equation, therefore, function fitting cannot be achieved by plotting discrete points. In this chapter, relation between indexes and dependent variables is analyzed and then a regression model is set using expertise.
3) Determine parameter coefficient. According to regression equation, index data and QoE values, by simulation under experiment condition, corresponding indexes of each parameter in regression equation are obtained and then a clear and complete regression equation is determined.
The regression equation gain in this paper is as follow.
4
2 4
1 2 3
1
1 3 5
ln , =
1 b b b
a a FR a BR
MOS N V
b PLR b Jitter b Delay
2
1 2 3
2
4 5
( ) c r c r c
mos u
r c r c
(5) Daily client QoE rating
Clients rating SMOS every 15 minutes
Original indexes
Arithmetic mean
In the equation above, FR is IPTV video frame rate whose unit is fps, BR is bit rate whose unit is bps, PLR is packet loss rate whose unit is %, Jitter has a unit in ms, Delay has a unit in ms, r represents
CPU performance when bit rate is fixed, a1,a2,a3 indicate coefficients of IPTV video QoE
parameter, b1 , b2 , b3 , b4 , b5 indicate coefficients of IPTV bear network QoE parameter,
1
c
,c2,c3,c4,c5indicate coefficients of client terminal performance QoE parameter. The formula of r is shown as follow.
1
1000
r
CPU BR
(6)
To evaluate the quality of the acquired regression equation, goodness of fit is the evaluating index in this paper. The measurement of goodness of fit is represented by the coefficient of determination shown below.
2 1
1 =
n i i
n i i
y y
SSR R
SST
y y
(7) As illustrated in the equation above, SSR is regression square sum, SST is sum of square of total,
i
y
is the theory value of dependent variable, y is the sample mean, yi is the actual measured value.
2
R is real number between 0 and 1; the closer to 1 the value is, which indicates observed points are
almost on the regression line, the better the goodness of fit of this regression equation is so that the equation can accurately reflect relation between independent and dependent variables; however, the closer to 0 the value is, which indicates observed only few points are on the regression line, the worse the goodness of fit of this regression equation is so that the equation cannot accurately reflect relation between independent and dependent variables.
Experiment and Verification
There are two methods adopted to verify the evaluation algorithm in this paper.
1)With real IPTV index data related to live and on-demand offered by clients served by some operator in a city, method mentioned in this paper is used to carry out fitting score. Then, calculate goodness of fitting of fitting algorithm in this paper using these clients telephone follow-up data, i.e. client subjective score.
2)With real IPTV index data offered by all clients served by some provincial operator in three days, method mentioned in this paper is used to carry out fitting score towards every client. Then, calculate average score in three days of every client and pre-warn with different threshold value. Ultimately verify hit rate of actual alerting according to IPTV complaint records in three days in the province.
Firstly, implement method (1), implement QoE evaluation model to evaluate live and on-demand services respectively, using telephone follow-up score, verify regression coefficients and goodness of fitting of each index parameters. Results of verification are illustrated in the following table.
Table 7. Verification of regression coefficient and fitting.
Video a1 a2 a3 b1 b2 Goodness of R2
Live 4.4520 -0.0065 0.078 7.033 1.912 93.04%
Two conclusion can be reached from the table above: (1) index parameters of different IPTV operation are different. The reason is that two video selected contain different data size in time and space information which means that they affect their own IPTV quality differently, thus, their correlations between dropping rate, bit rate, frame rate are different. (2) fitting regression function designed can well reflect relation between indexes and QoE. With goodness of fitting and deviation square sum, it can be told that goodness of fitting of different videos adopting evaluation model designed in this paper are all more than 90%, deviation square sums are all less than 0.04 as well. Therefore, this fitting regression function can well reflect true client experience.
Secondly, real provincial complaints data are used to verify actual performance. Steps of verification are list as below.
(1)Using IPTV operating data of all IPTV clients in a province in consecutive three days, score for all clients and calculate average score in three days. Index sample records are more than forty million in total.
(2)According to different scoring threshold values respectively, carry out quality forewarning to clients, extract forewarning lists of various threshold.
(3)Extract all IPTV quality complaint records in three days as complaining list which includes 2410 people.
(4)Compare QoE forewarning list and complaining list and get the hit rate to verify the validation of QoE evaluation model in this paper.
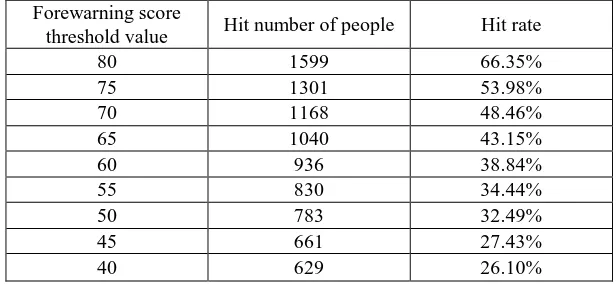
[image:7.595.143.451.392.534.2]For different forewarning score threshold values, hit rates of QoE forewarning list towards complaining list are list as follow.
Table 8. Hit rate against complaining list for different forewarning threshold values.
Forewarning score
threshold value Hit number of people Hit rate
80 1599 66.35%
75 1301 53.98%
70 1168 48.46%
65 1040 43.15%
60 936 38.84%
55 830 34.44%
50 783 32.49%
45 661 27.43%
40 629 26.10%
From the table above, with evaluation model designed in this paper, when the forewarning score threshold value is 80, the hit rate is 66.35%, i.e. method described in this paper can validly forewarn over 60% complaining clients. Thus, validation and value in application of this QoE evaluation model is verified.
Conclusion
Acknowledgement
This research was financially supported by the "Sichuan Engineering Laboratory of Computable Network and Application"(20160001).
References
[1] P Calyam, P Chandrasekaran, et al. Impact of router quering disciplines on multimedia QoE in IPTV deployments [J], IEEE Quality of Multimedia Experience, 2009, 6(2):92-97.
[2] FL. Zhao, SC.M, L.Y. QoE measurement and quantification method for a mobile communication network[J]. Journal of Electronic Measurement and Instrument, 2010,03:230-236.
[3] Bujlow T, Riaz T. A method for evaluation of quality of service in computer networks[C]. 2013 International Conference on Advanced Communication Technology, Jeju Island, Korea, 2013:17-25.
[4] Y. Yan. Construction and application of mobile service QoE Quantitative Index System[J]. Telecommunication Engineering, 2010,12:101-106.
[5] Winkler S. Quality of Experience (QoE): An important measure of success for IP-based video services 2007.
[6] Queiroz S. Comparative analysis of routing protocols for VoIP in a Wireless Mesh Backbone: A user perspective[J]. International Journal of Internet Protocol Technology, 2008,3(4):216-223.
[7] DD. Zhang, Qq. Zhang, Zg. Hu, Jl. Zhu. IP network video streams QoE evaluation model[J]. Computer Engineering and Applications, 2012,03:83-87.
[8] QQ. Liu, Yx. Ma, Hx. Ma. Network Fault Management SystemBased on Data Fusion and Data Mining [J]. Microelectronics and Computer, 2006, 06:74-76.
[9] C. Lin, J. Hu, Xz. Kong, Quality of Experience (QoE) Model and Evaluation Methods, 2012, The Computer Journal, Vol. 35, No. 1:1-16.
[10] Y. Luo. Mobile Internet services QoE research[D]. Beijing University of Posts and Telecommunications,2013.
[11] Jiawei Han. Data Mining: Concepts and Techniques[M]. China Machine PRESS,2004.
[12] A. ElEssailil, D. Schroederl, D, Staehle2, Quality-of-Experience driven Adaptive HTTP Media Delivery[C],IEEE ICC 2013 - Communication QoS,Reliability and Modeling Symposium, 2013.
[13] R. Song, L. Zeng. IPTV video quality control research and evaluation methods[J]. Radio and television technology, 2013, 09:20-23.
[14] Michal Ries, Catalina Crespi, Olivia Nemethova and Markus Rupp, "Content Based Video Quality Estimation for H.264/AVC Video Streaming", Wireless Communications and Networking Conference, 11-15 March 2007, Pages 2668 -2673.
[15] CH. Li, Rm. Hu, Hg, X. IPTV service quality indicators and network security[J]. Information and Communication, 2013, 10:245-246.
[16] Hyun Jong Kim, Seong Gon Choi. A study on a QoS/QoE correlation model for QoE evaluation on IPTV service//Proceedings of the 12th International Conference on Advanced Communication Technology (ICACT). 2010, 2:1337-1382.
[17] Hyun Jong Kim, Dong Geun Yun, Hwa-Suk Kim, KeeSeong Cho, SeongGonChoi.QoE Assessment Model for Video Streaming Service using QoSParamenters in Wired-Wireless NetWork[C]. IEEE International Conference on Advanced Communication Technology (ICACT), Chengdu, Sichuan, China 2012:459-464.