2016 Joint International Conference on Artificial Intelligence and Computer Engineering (AICE 2016) and International Conference on Network and Communication Security (NCS 2016)
ISBN: 978-1-60595-362-5
Research of Industrial Parts Measurement Algorithm
Based on Computer Graphics
Gui-Hua YANG
1,a, Meng-Da CHEN
11College of Mechanical and Control Engineering, Guilin University of Technology,
Guilin, Guangxi, China
Keywords:Edge detection, Fuzzy theory, Image feature, Industrial inspection.
Abstract. This paper presented a research method for industrial product detection system based on computer graphics. The method is applied an idea which combine fuzzy theory in edge detection with computer graphics, and it realized the automatic detection of industrial product appearance size on the production line. The industrial detection system is established by non-contact way, and it had great superiority in the accuracy, reliability, flexibility and automation, real-time, etc. it can satisfy the needs of high precision of industrial detection.
Introduction
With the advancement of industrial technology and the market competition is increasingly fierce. It is the appearance of the product, appearance design, internal quality and other factors are only attributed to quality of products. Higher requirements are put forward in product quality control. Industrial components detection system as the main part of the product quality control, its performance and function played is good or not directly affects the product quality control and production efficiency at some level.
Aiming at this problem of length measuring, Jia [1] presented a industrial inspection method of the digital close-range photographer methods. He used two or more industrial camera, can make industrial components detection of three- dimensional parameters. Miao [2] put forward a method of prepossessing image by using median filter, and it combined Hough transformation with Sub-pixel detection. It got better results, but the process is more complicated and can’t satisfy needs of two-dimensional length detection in industrial production process.
However, this paper presented a method which applied the digital camera and fuzzy theory in edge detection. This method overcame the problem which is standards of product sample selection, and time lag in the testing process in previous product. It not only can detect the two-dimensional length of the industry parts, but also satisfy high precision, high efficiency and automation.
Part Image Acquisition Principle
Aiming at testing of steel cord fabric for the processing factory, the paper realized the measurement of steel cord fabric size without affecting the basic production efficiency. It detected contour length of the product parts on the fixed position on the production line. At first, the parts contour shape is obtained by camera. Then all size parameters which are needed are obtained through image processing by PC, and the processed image the output parameters are displayed on LCD. At the same time, compared between the detection values and standard, if there is error, will feedbacked to PLC module, and the front equipment will correct the error accordingly.
The Principle of Parts Edge Image Acquisition
Pal and King, the fuzzy theory is introduced into the image edge extraction algorithm in [3-5], generally referred to as the classical fuzzy edge detection algorithm. The center of the algorithm is which increase the contrast between the different area with fuzzy enhancement technique. It improved the gray contrast of the edge on both sides, and extracted fuzzy edge. The basic steps for:
1) xijis a pixel gray-scale for (i, j) , and xmaxis the biggest gray scale. Images can be obtained by the membership function of fuzzy characteristics, can be represented as in Eq. (1).
1 maxe F ij ij ij d x x
P T x
F
. (1)
Among them, Fe,Fd exponential factor and reciprocal type factor, respectively, determine the value of P in the plane of the characteristics of fuzziness size, among them, as in Eq. (2).
max 1 2 e 1
c d
F
x u
F
. (2)
The type of the definition of fuzzy feature plane pijwill specifically said the first (i, j) has the biggest a pixel gray-scale level.
2)will be under test image map for fuzzy characteristic matrix
M i N j ij ij x p X 1 1 / ,pijis a fuzzy
feature, in this algorithm, the fuzzy characteristics of pixels of relative gray value.
3) after obtain image fuzzy plane, carries on the fuzzy enhancement, namely the original fuzzy characteristic function pijnonlinear transformation to a K time, usually for contrast enhancement transformation. In general, for A fuzzy set A do enhancement transformation, will produce A new fuzzy set B = INT (A).
Its membership function is as in Eq. (3).
2 2
2 , 0
1 2 1 1
ij ij
B
ij ij
x x r
x
x r x
< <
< . (3)
This kind of transformation is the result of the fuzzy set A ambiguity is reduced, increased the value of the A(x) above r also reduced the value of A(x) below r.
This can be represented as fuzzy enhancement algorithm, as in Eq. (4).
'
1 1
( ) ( ( )), 1, 2,3...
ij r ij r ij
p I p I I p r . (4)
[ ]
min
, ( , )
(
1)
M mn M N
M i M
mn mn ij
M i
mn mn
Edges
I
I
I
I
i j
Q
I
K
p
. (5)
Among them, the point Q is (i, j) as the center of 3 × 3 area, as in Eq. (5).
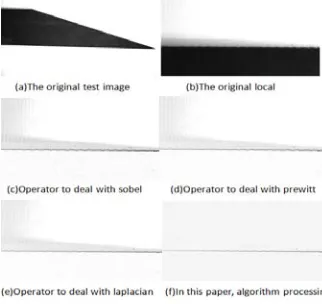
In the algorithm implementation process, set uc= 0.45, transit fuzzy enhancement for K=2, the results of the selected image edge extraction algorithm and other contrast is shown in figure 1.
[image:3.612.223.384.200.352.2]Figure 1. Related algorithm contrast.
Figure by the result of the experiment, it can draw the conclusion: in this paper, the fuzzy mathematics theory foundation of edge extraction method has a strong select good parameters can significantly eliminate noise, and accurately positioning to extract the image edge, but according to the different effect and precision of image contains information is different, different areas with different image or not are universal, this is a transit point location selection of arbitrary decision. In the operation of different measurement, need to adjust the transition point parameters repeatedly, to achieve the best effect.
Parts Image Morphology Identification Principle
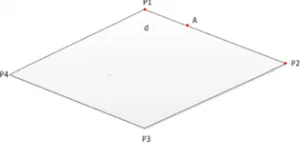
Definition 1, the characteristics of the image edge pixel value refers to the pixel with another point has certain specific pixel edge distance of horizontal ordinate bad difference. And according to the specific characteristics of pixels value following points, and margin call the edge distance characteristics, the pixels with the characteristic value following points from the linear distance between called features.
[image:3.612.225.388.559.634.2]
Figure 2. Characteristic value of schematic diagram.
According to this definition, obviously has the following theorem.
Theorem 1: if both edge points and follow on the same line, then the two edge points at the same eigenvalue.
Prove that amplify the polygon assertive P1 area is shown in figure 3.
Figure 3. Multiple edge point eigenvalue.
According to the definition, P 'for the eigenvalue of the point P to follow point, point P eigenvalue of P to 1
' 1P PO O ; '
1
Qto Q1the eigenvalue of the following points, the eigenvalue of the point Q1,
' 1 2 2 1
1 QO OQ
Q
; Q'for the point Q characteristic value following points, the eigenvalue of the point Q , '
3 3 OQ QO
Q
, '
1 1 ', , ,P Q Q
P points are on a straight line,
' 1 2 1 '
1P QOQ
PO ≌△
△ , PO1O1P' Q1O2O2Q1' , is a P and Q1 at the same eigenvalue. Point Q and Q ', P, P 'is not on the same line, so the eigenvalue of the P and Q are different.
According to the theorem 1, obviously has the following corollary.
Corollary 1 the pixel value of edge characteristics on the curve always changing.
By theorem 1, figure 3 pixel point on the line PP1 eigenvalue approximate equal, but after clockwise P1 pixels with P and eigenvalue changes, until the pixels and eigenvalue with points on a straight line, the pixels with a vertex distance than before when margin features, characteristic value again tend to be equal.
Theorem 2, according to the features of defined margin for d, to each edge of a polygon, as shown in figure 4 P1P2 into two lines, set to P1A andAP2, set the length of the P1A‘S d (assuming the edge pixel in the recognition process of direction is clockwise), another for AP2, length of P1P2d, then the pixels on the P1A eigenvalue have great changes, the pixels on the
2
AP eigenvalue approximate constant.
[image:4.612.231.382.487.562.2]
Figure 4. Characteristic values change.
Proof: the polygon is shown in figure 4, in the process of the recognition of the polygon characteristic margin for d.
Might as well analyzes edge P1P2 According to the characteristics of distance d, while P1A and 2
AP ,P1P2 divided into segments, including P1A length is d. Obviously, on line P1A pixels and its characteristic value following points not P1P2 straight line, so it has the characteristics of the pixel value changes. The AP2pixels and its characteristic value following the point on the line segment inP1P2straight line, so have the same eigenvalue.
According to the theorem 2, obviously has the following corollary.
Corollary 3, set the eigenvalue of the polygon edge pixels in order form s cycle sequences, s characteristic value by approximately equal to the change in the transformation of the frequency is equal to the number of polygon vertical.
Parts Measurement Algorithm Steps
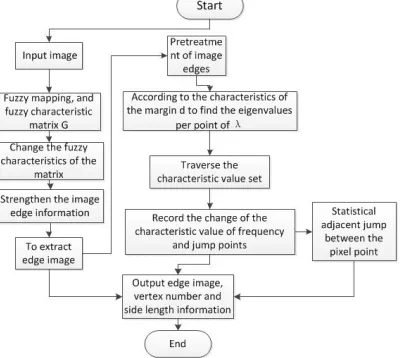
[image:5.612.208.408.184.363.2]According to the theorem and inference, the processing parts size detection system, build a edge pixels based on fuzzy theory and the characteristic value of geometry detection algorithm, the process is shown in figure 5.
Figure 5. The procedure flow charts.
A)input images of the need to deal with, through to the original image fuzzy mapping, and get a fuzzy characteristic matrix G; B) to the appropriate nonlinear characteristic matrix transformation and inverse transformation processing, change the fuzzy matrix, fuzzy enhancement image information, weaken the edge information; C) in the end, "min" or the "Max" operator was used to extract the edge; D) will be closed with complete edge geometry, according to the graphics and image gray-scale differences identified graphic edge, constitute the edge pixel edge; E) preachment edge, along the edge of the graphics inside traversal collection edge, delete redundant edge pixels, ensure each edge pixel in ongoing diagram and only two adjacent pixels, edge 'get set; F) traverses the edge pixel set edge margin d, according to the given characteristics, the characteristic value of each of these points, constitute the eigenvalue of the circulation order collection eigenvalue; G) traversal eigenvalue collection eigenvalue, according to the characters of the theorem and inference calculation edge pixel value transform position and number, and each time the distance transform continuous; H) if there are n transformation, and each transformation characteristics of distance equals margin continuously, can judge the graphics for the n side, the first pixel of each transformation is the vertical, all vertex of orderly collection, transform the total number of the polygon number of edges and vertical, continuous two change points as the distance between the length of the corresponding image pixels; I) if there are n transformation, and constant distance is not equal to at least one transform characteristics of margin, then this graphics for polygon with arc segment, n is the number of straight line and arc while and, the first pixel of each transformation for vertex or arc segment starting point.
Algorithm Simulation Results
Figure 6. Test sample image.
Figure 7. Algorithm processing results.
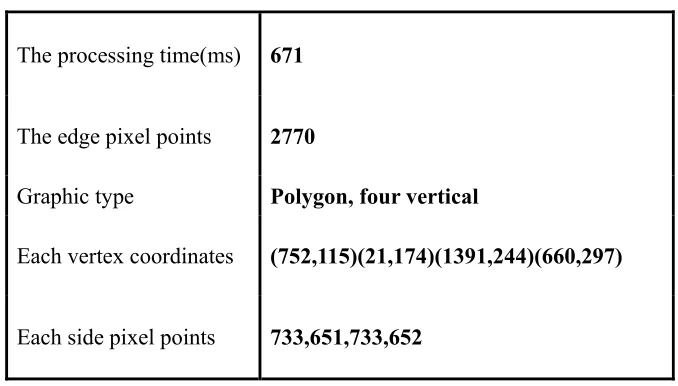
[image:6.612.222.393.65.143.2]After alignment with actual measurement, can be easy to see that the error of the processing method of this paper can achieve within 1 pixel, specific processing accuracy depends on the photographic equipment to the distance of the object being measured physical parameters, such as, even so, the accuracy can reach the level of + / - 0.1 mm, usually can achieve most of the industrial product testing requirements.
Table 1. Algorithm identification results.
The processing time(ms) 671
The edge pixel points 2770
Graphic type Polygon, four vertical
Each vertex coordinates (752,115)(21,174)(1391,244)(660,297)
Each side pixel points 733,651,733,652
Conclusions
[image:6.612.136.475.392.585.2]Acknowledgement
Surported project: Guangxi technology cooperation and exchange projects (NO.GUI 1346011-10).
References
[1] Jia Shengju, Yu Jingtao. The application of the digital close shot photogrammetry in the industrial. The digital close shot photogrammetry in the industrial test, The Application of Surveying and Mapping Sinica, 2002, 31: 61 ~ 65.
[2] Miao ShiDi Pei-li Qiao. Mechanical parts size measurement based on computer vision research [D]. Harbin, Harbin Institute of Technology, College of Computer Science and Technology. 2006. [3] Pal S.K., R.A. King. Image enhancement using fuzzy sets. The Electronics Letters, 1980 (10): 376-378.
[4] Pal. S.K., R.A. King. Image enhancement using smoothing with fuzzy sets. The IEEE Trans on Systems, Man, and Cybernetics, 1981, 11 (7): 494-501.
[5] Pal. S.K., R.A. King On edge detection of X - ray images using fuzzy sets. IEEE Trans Pat Anal and Machine Intel, 1983, 5 (1): 69-77.