http://dx.doi.org/10.4236/fns.2015.65056
Estimating Aluminum Leaching into Meat
Baked with Aluminum Foil Using
Gravimetric and UV-Vis
Spectrophotometric Method
Layla A. Al Juhaiman
Chemistry Department, Faculty of Science, King Saud University, Riyadh, Kingdom of Saudi Arabia Email: ljuhiman@ksu.edu.sa
Received 15 February 2015; accepted 6 April 2015; published 10 April 2015
Copyright © 2015 by author and Scientific Research Publishing Inc.
This work is licensed under the Creative Commons Attribution International License (CC BY). http://creativecommons.org/licenses/by/4.0/
Abstract
Baking meat by wrapping them in Aluminum (Al) foil is common in many countries. The excessive use of Al foil in baking and the disagreement about using Al foils were the motivation to do this study especially after the 2007 WHO/FDA Report. In this investigation, a gravimetric and a UV-Vis spectrophotometric method are used to estimate Aluminum (Al) leaching into meat baked by wrapping in Al foil. Three kinds of meat were used fish, cow stakes and chicken. The importance of Al exposure area was neglected by many studies. Five factors affecting Al leaching into meat are studied (baking temperature, baking time, additives, Al exposure area and weight of meat). The effect of cooking times (20, 40, 60 minutes) at 180˚C and cooking temperatures (160˚C, 180˚C, 200˚C) at 60 minutes on the amount of Al leaching were evaluated. It was found that Al leaching into meat increased with increasing temperature, baking time, additives and Al exposure area. Moreover, Al exposure area was more effective than the weight of the meat. The Al leaching was
highest in fish and lowest in chicken. Comparing the present results with the Provisional Tole r-ance Weekly Intake of Al approved by WHO/FDA, it shows that Al leaching into meat baked by wrapping in Al foil may add considerable doses into the diet. Continuous monitoring of Al foil used
for baking meat is recommended.
Keywords
Al Foil, Al Leaching into Meat, Weight Loss, UV-Vis Method, Provisional Tolerable Weekly Intake
1. Introduction
and leaching from Al cook wares. The neurotoxic potential of Al is undisputed nowadays. It can be toxic when injected directly into animals[1] or accidentally to humans as in the case of dialysis [2]. Aluminum had also been associated with various disorders (dialysis encephalopathy and bone disorder) due to its accumulation in brain, bones, and liver [3] [4]. Aluminum was regarded a neurotoxin agent since 1980 [2]. There are a few stu-dies in the Middle East which relate the daily habits of Al consumption with Al toxicity. An earlier study corre-lated Aluminum in blood serum for elementary school girls with the daily habits [5]. Later on, another study tried to find a solution against Aluminum Chloride Induced Toxicity in the kidney and liver of White Albino Rats usingCamel’s Milk [6].
There is some disagreement about using Al cook wares in cooking. Some studies regard them hazardous and do not recommend using them especially in acidic food [7]-[9]. Other studies regard using Al utensil and Al foils safe for cooking [4] [10]-[12]. The old Provisional Tolerance Weekly Intake (PTWI) of Al from WHO/ FDA in 1989 was 7 mg/Kg body weight. In 2007, the PTWIwas changed to 1 mg/Kg body weight[13] which reflectedtheneurotoxic potential of Al.
There are several analytical techniques to evaluate low-level metals such as flame atomic absorption spectro-metry (FAA), Atomic Absorption spectrospectro-metry (AAS) and inductively coupled plasma-optical emission spec-trometry (ICP-OES). However, these are expensive instruments and they require high operational costs. UV-Vis spectrophotometric method is a well-established analytical technique that provides low cost, simplicity and wide range of applications for Al3+ determinations in food and water with high precision. It is well known that Al dissolution is highly dependent on temperature, pH and the presence of complexing agents. Using Eriochrome Cyanine R (EC) for analysis of Al3+ ions and some trace elements is not a new method. It was introduced for trace analysis of dissolved Al3+ ions and other cations in 1969 by Garg et al. from the University of Allahabad in India [14]. EC behaves like a bidentate univalent ligand forming a chelate with several metal ions like Al3+. Us-ing UV-Vis and EC for analysis of Al3+ ions was later updated by some researchers [15] [16].
It is a common practice in many countries to bake fish, shrimp, and chicken and meat stakes by wrapping them in Al foil. Even many cooking books and cooking programs use this practice because of the most important characteristics of aluminum foil that is its ease of handling, ability to transmit heat and its impermeability to gasses. The excessive use of Al foil in baking and the disagreement about using Al foils motivated me to do this study especially after the 2007 WHO/FDA Report. The purpose of this investigation is to estimate the amount of Al leaching from fish, chicken and meat baked in Al foil using a cheap weight loss (WL) and UV-Vis spectro-photometric method. Then compare the results with PTWI from WHO/FDA.
2. Materials and Methods
2.1. Materials
1) Fish fillet (Hamour), chicken (from breast) and cow stakes (from the leg) were purchased from the local market and used immediately. These kinds of meat contain minimum amount of fat. For each experiment a piece of meat of about 20 ± 0.20 g was used.
2) Al foil was purchased from the local market (from Classic Company) with a thickness of 0.40 mm. The al-loying elements in Al foil was evaluated using Atomic Absorption instrumentfrom Shimadzu (A.A. 6701F). The samples of Al foil were cut into square tray (10.0 cm× 10.0 cm) with a height of 2.0 cm to wrap com-pletely the piece of meat. The surface area was 280 ± 2 cm2.
3) HNO3 70% (from Sigma-Aldrich) was used to clean all glass wares and to digest the meat. 4) Pure sea salt (from Sasa Company, Saudi Arabia) and fresh lemon juice were used as additives. 5) Standard Al solution (1000 ppm) (Merck, Germany).
6) Eriochrome Cyanine R (EC) (Merck, Germany). A 5 mmol/L Eriochrome Cyanine R stock solution was prepared in DI water.
7) The surfactant cetyltrimethylammonium bromide (CTAB) with a molecular weight of 364.45 was provided from BDH Company. It was prepared by dissolving the appropriate amount in DI water to make 50 mL of 1 mmol/L.
8) Acetone for washing and drying the Al samples. 9) A sensitive balance (Mettler Toledo ± 0.0001 g).
10)An electrical oven (Shanghai Experimental Factory) was used for the experiments. 11)Hot Plate (Gallen Kamp).
13)UV-Vis (LKB. Biochrom England).
2.2. Methods
2.2.1. Weight Loss Method
Al foil sample was treated in the following way prior to each experiment. It was washed with acetone using an ultrasonic cleaner (from Cole Palmer) for one minute before drying. After that the Al foil sample was weighed in the sensitive balance. Then the Al foil sample was shaped like a square tray where the piece of meat was wrapped during the experiment with minimum overlapping. The exposed area was 280 ± 2 cm2 Samples of cow stake, chicken breast and fish (Hamour fillet) were weighed to about 20 ± 0.20 g. A blank experiment was done without using the Al foil to check the level of Al in meat.The meat samples were wrapped in the Al foil and in-troduced in the hot oven in a Pyrex tray at the desired temperature and the specified time. After the leaching ex-periments, the Al foils was washed generously with distilled water then acetone to remove the entire leaching product. The juices of the meat and the water used for washing Al foil were collected and the acetone was eva-porated. The dry Al foil sample was weighed again to determine the weight loss. All WL experiments were per-formed in two-three experiments.
2.2.2. UV-Vis Spectrophotometric Method Method
After WL experiment, the meat was placed in a beaker and digested by adding the required amount of 70% HNO3 to dissolve all the tissue. The remaining solution from the meat juice and the water of washing the Al foil was mixed with the digested meat solution. Then the solution was heated using a heating mantel till about 20 mL of the solution remained followed by cooling to room temperature. The cooled solution was filtered through Whatman filter paper (No. 41) and transferred quantitatively to a 100 mL volumetric flask and diluted with DI Water. The amount of Al in real samples using UV-Vis spectrophotometric methodwas found according to Si-riangkhawut et al. method[16]. To build up the analytical curve, the appropriate volume of each Al sample was added to 25 mL volumetric flasks. To each flask, 1.5 mL of 0.4 mmol/L EC, 0.5 mL of 1 mmol/L CTAB and 5 mL of 1.0 M acetate buffer pH 5 and a known volume of the Al solution was added, in the same sequence. The mixture was shaken well to promote the reaction then the volume was completed to the mark with DI water. The absorbance of the final solution was measured against a blank solution containing only the reagents. Standard Al solutions were prepared (10 - 100 ppm) and the previous procedure was repeated. The values of λmax and tmax were determined. The effect of baking time, temperature, additives, weight of meat and Al exposure area were investigated.
3. Results and Discussion
3.1. Weight Loss Method
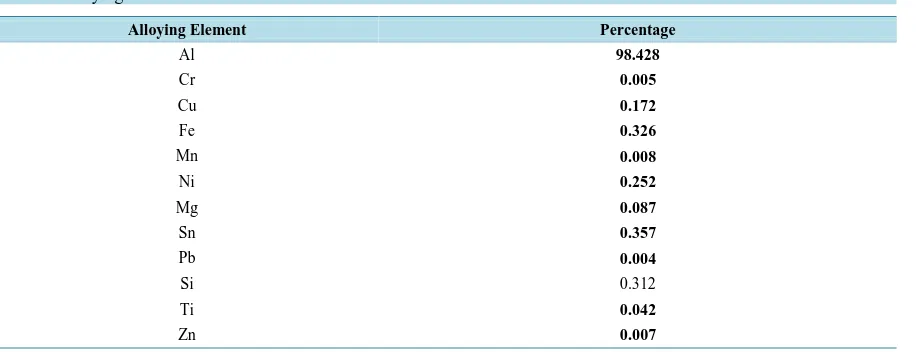
[image:3.595.90.548.547.723.2]Using Atomic Absorption method, the analysis of the alloying elements in Al foil is shown in Table 1. The per-centage of Al is98.428%and the highest alloying elements are Sn, Fe, Si (about 0.3% each).
Table 1.Alloying elements of Al foils.
Percentage Alloying Element
98.428 Al
0.005 Cr
0.172 Cu
0.326 Fe
0.008 Mn
0.252 Ni
0.087 Mg
0.357 Sn
0.004 Pb
0.312 Si
0.042 Ti
Although WLis an old technique, it is used to simulate Al leaching used in cooking. WL is a cost effective, quick and environmentally friendly method. Al leaching from WL method is calculated using the following corrosion weight (CR) equation:
W CR
A t
∆ =
× (1)
where ∆w is the weight loss or the leaching amounts of Al foil (mg); A is the exposed surface area (A = 280 cm2) and t is the immersion time (hour).
3.1.1. Effect of Baking Time
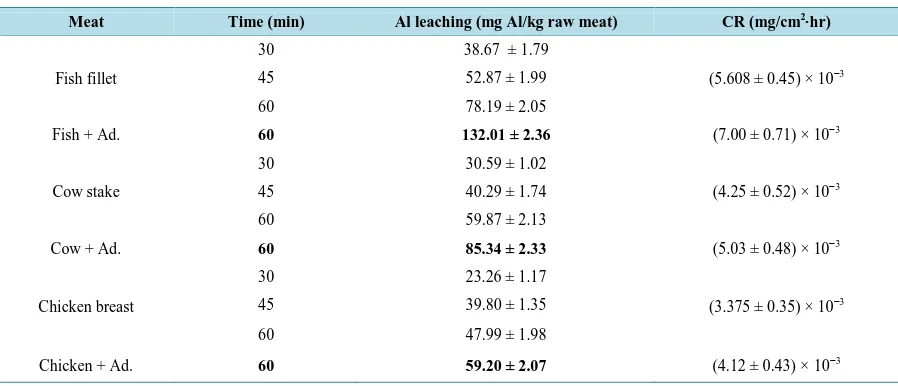
The baking time was changed from 30 - 60 minutes at a temperature of 180˚C. The corrosion rate (CR) of the three types of meat (fish, cow stakes and chicken) w/without additives is listed in Table 2. W is the average weight of the raw meat of two-three experiments.
The weight of Al leaching (mg Al/kg raw meat)increased with increasing baking time at constant temperature (180˚C). Moreover from these results the order of Al leaching into meat appears to be:
Fish > Cow > chicken
This order is similar to the order of Al leaching in meat extract found in an earlier investigation [9]where fish is higher than red meat, whereas chicken showed the lowest leaching. The third column in Table 2 shows the Al leaching per unit weight of raw meat. The amino acids in meat have high susceptibility to react with A3+ to form
Aluminium complexes are shown by many studies [9] [17]. The present data are in agreement with a previous study for Turhan[12]. As an example, Turhan got 38.27 ± 2.73 mg Al/ kg dry meat at 200˚C after 40 minutes [12]. In the present study at 180˚C and after 45 minutes of baking, I got 40.29 ± mg Al/kg raw meat. Using chicken breast, Turhan obtained 43.19 ± 1.28 mg Al/kg dry meats at 200˚C after 40 minutes whereas I obtained
39.80 ± 1.35 mg Al/kg raw meatsat 180˚C and after 45 minutes of baking.
However, the present results are about 100 fold more than the results of Ranau et al.[11]. Comparing the re-sult of fish fillet baked without any ingredient for 30 minutes at 180˚C, I got 38.67 ±1.79 mg Al/kg raw fish. On the other hand, Ranau et al. [11] results for Cod fillet at 200˚C after 25 minutes were 0.295 ± 0.074 mg/kg net wt. The reason for this huge difference in results between the present study and Ranue et al.[11] is not clear.
[image:4.595.89.538.528.721.2]The WL method simulates the amounts of Al leaching into food at conditions close to the real ones. Distilled water was used in this study but it is expected that Al leaching from Al cook wares using tap water may leach more Al as found from a previous study [9].In real life during cooking, people may add tomato paste, lemon juice, table salt and other spices. The previous table illustrates the effect of adding table salt and lemon juice as additives (Ad.) to the three kinds of meat. It is noticed that the Al leaching increased with the addition of table salt and lemon by 115% - 125%. The aggressive effect of Chloride ion and citric acid in lemon is well docu-mented and were shown by some researchers to leach more Al when using Al utensils [4] [10].
Table 2.Al leaching into meat from weight loss method at different times at 180˚C.
Meat Time (min) Al leaching (mg Al/kg raw meat) CR (mg/cm2∙hr)
Fish fillet
30 38.67 ± 1.79
(5.608 ± 0.45) × 10−3
45 52.87 ± 1.99
60 78.19 ± 2.05
Fish + Ad. 60 132.01 ± 2.36 (7.00 ± 0.71) × 10−3
Cow stake
30 30.59 ± 1.02
(4.25 ± 0.52) × 10−3
45 40.29 ± 1.74
60 59.87 ± 2.13
Cow + Ad. 60 85.34 ± 2.33 (5.03 ± 0.48) × 10−3
Chicken breast
30 23.26 ± 1.17
(3.375 ± 0.35) × 10−3
45 39.80 ± 1.35
60 47.99 ± 1.98
3.1.2. The Effect of Baking Temperature
The effect of baking the meat for one hour while changing the temperature from 160˚C - 220˚C was studied as shown in Table 3. It is noticed that baking the meat wrapped in Al foil for an hour at 220˚C increased the Al leaching (mg/kg net) compared to that in 180˚C by 43% - 49%. The effect of temperature in increasing the rate of reactions is well documented.
Tables 3. The Al leaching of meat after baking for one hour from weight loss method at different temperatures without any additives.
Meat T(˚C) Al leaching (mg/kg net meat)
Fish
160 48.35 ± 1.45
180 78.19 ± 2.05
220 154.04 ± 2.74
Cow
160 32.79 ± 0.98
180 59.87 ± 2.13
220 111.51 ± 3.02
Chicken
160 25.54 ± 1.06
180 47.99 ± 1.98
220 91.23 ± 2.23
3.1.3. The Effect of Al Exposure Area
One of the advantages of WL method is showing the importance of the exposure area (A) which is an important factor neglected by many researchers. To accomplish this, the Al leaching of the same weight of meat (20 g ± 0.20 g) was determined at 180˚C after increasing the exposure area from 280 cm2 to 328 cm2 (a box of dimen-sions 10 × 12 × 2). The Al leaching was found to be 70.402 mg/kg net meat (area = 328 cm2) instead of 59.87 mg/kg net meat (area = 280 cm2)which shows the importance of the exposure area. Moreover another experi-ment was done to detect the Al leaching when the same weight of meat (20 g ± 0.20 g) was placed in a Pyrex tray covered with Al foil but without touching the meat which is a usual procedure in cooking. The inside face of Al foil turned black but the amount of Al leaching into meat was below the detection limit of the balance (four digits).
3.2. UV-Vis Spectrophotometric Method
The digested meat solutions from WL experiments were used for UV-Vis Spectrophotometric method. The for-mation of Al-EC complexes was time consuming and required a control of pH and temperature [16]. It was found that using a method of Cloud Point Extraction the extraction of Al3+ was quantitative in the range of pH 2.5 - 8.0 [15]. The precision and accuracy of the proposed method was evaluated with real samples and the lim-its of detection and quantification were 0.0020 - 0.0126 ppm [16]. The maximum wavelength (λmax) differs
de-pending on the method of preparation of the EC solution ranging from 540 nm for Garg et al. (1969) [14] to 595 nm for Hejri et al. [15]to 584 nm forSiriangkhawut et al. [16].
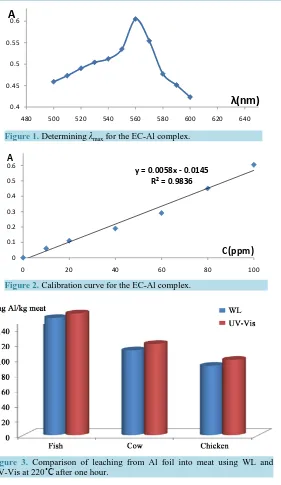
The values of λmax weredetermined for the EC-Al complex in the range 500 - 600 nm and the maximum wave
length was found at 568 nm as shown in Figure 1. It is well known that Al dissolution is highly dependent on the temperature, pH and the presence of the complexing agents. An experiment was done with small pieces of fish, cow meat and chicken before baking in Al foil and the concentration of Al was below the detection limit. This means that the amount of Al estimated in this study was due mainly to leaching from Al foil only. After determiningλmax it was important to find the best time for the experiment to ensure that the EC-Al complex is completely formed. The absorbance was measured every 2 minutes and it was found that the maximum absorb-ance was after 15 minutes. Using UV-Vis at λmax of 568 nm after 15 minutes of formation of EC-Al complex, the calibration curve of the present data was obtained as shown inFigure 2. The results after one hour and at the temperature of 220˚C were only used.
Figure 1.Determining λmax for the EC-Al complex.
Figure 2. Calibration curve for theEC-Al complex.
Figure 3. Comparison of leaching from Al foil into meat using WL and UV-Vis at 220˚C after one hour.
picted. A good consistency was observed between the data from WL and UV-Vis with the results of UV-Vis slightly higher by 4% - 6%. This difference may be due to the small area of Al foil which was not in complete contact with the meat.
3.3. Comparison of Al
Leaching
with PTWI
In 1989, the joint WHO/FAO Expert committee on food additives has established the Provisional Tolerance Weekly Intake (PTWI) of 7 mg of Al/kg body weight of adult. Due to the increased awareness about Aluminum toxicity, this value was withdrawn and changed into 1 mg of Al/kg body weight in 2007 [13]. A study of the av-erage Al concentration in daily diet showed that under normal circumstances the avav-erage dietary intake of Al (without water) is about 6 - 15 mg/day [4]. Some researchers recognized the risk of Al in the daily diet [18] [19].
The value of PTWI for a child weighing 30 kg will be 30 mg/week or 4.29 mg/day. FromTable 1 and Table 2, the amount of Al leaching from the different types of meat baked in Al foil for an hour ranged from 0.97 - 3.08
0.4 0.45 0.5 0.55 0.6
480 500 520 540 560 580 600 620 640
λ(nm)
A
y = 0.0058x - 0.0145 R² = 0.9836
0 0.1 0.2 0.3 0.4 0.5 0.6
0 20 40 60 80 100
C(ppm)
mg for baking 20 gram of meat. Comparing the PTWI for a child weighing 30 kg with the average amount of Al leaching into meat in the present data showed that Al leaching constitutes a large amount of the allowed daily intake.Some previous studies did not recognize the risk of Al leaching from baking meat in Al foil [11] [12]. However, based on the present results, using Al foil may leach significant amounts of Al into the food, which raises the amounts of Al to high levels and may be dangerous to children, the elderly and people with kidney problems.
4. Conclusion
Weight loss method allows us to estimate Al leaching into meat baked by wrapping in Al foil. WL and UV-Vis Spectroscopy give comparable results. Using Al foil leaches significant amounts of Al into the meat, which raises the amounts of Al to levels close to the Provisional Tolerance Weekly Intake (PTWI). Continuous moni-toring of Al foil used for baking meat is recommended.
Acknowledgements
This research project was supported by a grant from the “Research Center of the Female Scientific and Medical Colleges” Deanship of Scientific Research, King Saud University. Part of the work is performed by Amal Abu Mustafa (as a college student) which is greatly valued. The author declares that there is no conflict of interest.
References
[1] Slanina, P. and Falkeborn, Y. (1984) Aluminum Concentrations in the Brain and bone of Rats Fed by Citric Acid. Food and Chemical Toxicology, 22, 391-397. http://dx.doi.org/10.1016/0278-6915(84)90369-7
[2] Gitelman, H. (1989) Aluminum and Health. Marcel Dekker Inc., New York.
[3] Winship, K. (1993) Toxicity of Aluminum: A Historical Review, Part 1. Adverse Drug Reactions Toxicology Review,
11, 123-141.
[4] Soni, M.G., White, S.M., Flamm, W.G. and Burdock, G.A. (2001) Safety Evaluation of Dietary Aluminum. Regulatory Toxicology and Pharmacology, 33, 66-79. http://dx.doi.org/10.1006/rtph.2000.1441
[5] Al-Saleh, I. and Shinwari, N. (1996) Aluminum in Saudi Children. Biometals, 9, 385-392.
http://dx.doi.org/10.1007/BF00140608
[6] Al-Hashem, F. (2009) Camel’s Milk Protects against Aluminum Chloride-Induced Toxicity in the Liver and Kidney of White Albino Rats. American Journal of Biochemistry and Biotechnology, 5, 98-108.
http://dx.doi.org/10.3844/ajbbsp.2009.98.108
[7] Fimreite, N., Hansen, O.Ø. and Pettersen, H.C. (1997) Aluminum Concentrations in Selected Foods Prepared in Alu-minum Cookware and Its Implications for Human Health. Bulletin of Environmental Contamination and Toxicology,
58, 1-7. http://dx.doi.org/10.1007/s001289900292
[8] Ščančar, J., Stibilj, V. and Miačič, R. (2004) Determination of Aluminum in Slovenian Foodstuffs and Its Leachability from Aluminum Cookware. Food Chemistry, 85, 151-157. http://dx.doi.org/10.1016/j.foodchem.2003.07.028
[9] Al Juhaiman, L.A. (2010) Estimating Aluminum Leaching from Aluminum Cook Wares in Different Meat Extracts and Milk. Journal of Saudi Chemical Society, 14, 131-137. http://dx.doi.org/10.1016/j.jscs.2009.12.020
[10] Verissimo, M.I.S., Oliveira, J. and Gomes, M. (2006) Leaching of Aluminum from Cooking Pans and Food Containers. Sensors and Actuators B, 118, 192-197. http://dx.doi.org/10.1016/j.snb.2006.04.061
[11] Ranau, R., Oehlensclager, J. and Steinhart, H. (2001) Aluminum Levels of Fish Fillet Baked and Grilled in Aluminum Foil. Food Chemistry, 73, 1-6. http://dx.doi.org/10.1016/S0308-8146(00)00318-6
[12] Turhan, S. (2006) Aluminium Contents in Baked Meats Wrapped in Aluminum Foil. Meat Science, 74, 644-647.
http://dx.doi.org/10.1016/j.meatsci.2006.03.031
[13] WHO/FAO (2007) Expert Committee on Safety Evaluation of Certain Food Additives and Contaminants. Food Addi-tives Series 58, WHO, Geneva, 119-207.
[14] Garg, V.C., Shrivastawa, S.C. and Dey, A.K.(1969) Determination of Aluminum and Gallium: Chelate Formation of Trivalent Aluminum and Gallium with Eriocrome Cyanine RC. Mikrochimica Acta, 57, 668-672.
http://dx.doi.org/10.1007/BF01216473
[16] Siriangkhawut, W., Tontrong, S. and Chantiratiku, P. (2013) Quantitation of Aluminum Content in Waters and Soft Drinks by Spectrophotometry Using Eriochrome Cyanine R’ Research. Journal of Pharmaceutical, Biological and Chemical Sciences, 4, 1156-1161.
[17] Yokel, R. (1994) Aluminum Chelating: Chemistry, Clinical, and Experimental Studies. Journal of Toxicology and En-vironmental Health, 41, 131-174. http://dx.doi.org/10.1080/15287399409531834
[18] Neelam, B.M. and Kaladhar, M. (2000) Risk of Increased Aluminum Burden in the Indian Population: Contribution from Aluminum Cookware. Food Chemistry, 70, 57-61. http://dx.doi.org/10.1016/S0308-8146(00)00068-6
[19] Cassel, I. (2007) Aluminum Toxicity: A Misdiagnosed Epidemic (Part 1), Idaho Observer.