© 2017, IRJET | Impact Factor value: 5.181 | ISO 9001:2008 Certified Journal | Page 414
Design and Analysis of Frame of an All-Terrain Vehicle
Dr. V.K. Saini
1, Dushyant Tomer
2and Kshitij Kulshrestha
31
Head of Department, Mechanical Engineering, IMS Engineering College, Ghaziabad, India.
2,3
UG Scholar, Department of Mechanical Engineering, IMS Engineering College, Ghaziabad, India.
---***---Abstract-
This study deals with the design and analysis offrame of an All-Terrain Vehicle (ATV). An ATV is a vehicle that is able to run and perform efficiently on different terrains like rocky, muddy, lose gravel, etc. The development of the frame for an ATV requires several steps that are Material Selection, Cross-section Selection, and Frame design parameters, Analysis Parameters, Iterations, Analysis and Simulation. The above said steps are crucial for a frame to be rigid and optimum to provide maximum safety to the driver of the vehicle along with better performance on-road. In this study the steps are carefully followed and thus an attempt is made to make a frame fit to be manufactured and development of a vehicle that could perform on rough terrains.
Key Words: Roll Cage, Material Selection, ATV, Frame
Design, Terrains, Analysis.
1.INTRODUCTION
An All-Terrain Vehicle as the name suggest is a type of vehicle that is able to run and perform on different terrains. As this type of vehicle is often challenged with off-roads, the force and stress acting on it are very critical and thus puts the driver in danger. As frame is the main supporting structure of a motor vehicle to which all other components are attached is one of the main subsystem and is directly responsible for driver’s safety as well as performance parameters, thus proper study and analysis is required to be done before manufacturing the frame[2]. In
this study an effort is put to design and analyse the frame so that when the vehicle is put to real life condition it performs to its optimum.
Frame of the vehicle can be of different type like backbone frame, ladder frame, monocoque, tubular space frame, etc. [3].
Out of all these tubular space frame is most suitable for an ATV as it provides good safety along with light weightiness, torsional rigidity, and optimum strength. Furthermore the tubular space frame is considered to be the best in terms of all directional safety and impact conditions.
2.MATERIAL AND CROSS-SECTION SELECTION
The widely available AISI grade is considered for the frame design due to its high carbon percentage as well as high yield strength so that it would be cost effective as well as easily available.
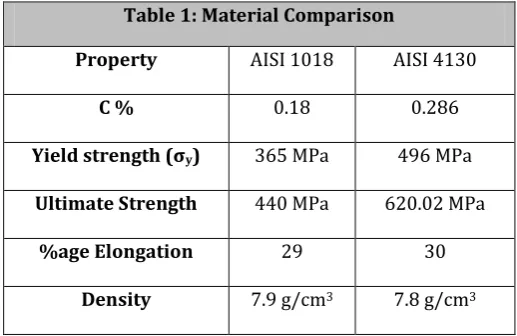
In AISI grade several material are available and most popular are AISI 1018 [2] and AISI 4130. The following is the
[image:1.595.304.563.246.414.2]comparison of the two material selected.
Table 1: Material Comparison
Property AISI 1018 AISI 4130
C % 0.18 0.286
Yield strength (σy) 365 MPa 496 MPa
Ultimate Strength 440 MPa 620.02 MPa
%age Elongation 29 30
Density 7.9 g/cm3 7.8 g/cm3
As the yield strength of the AISI 4130 is much higher than the AISI 1018 and also the density of AISI 4130 is less than AISI 1018 therefore the material chosen is AISI 4130 for better safety and less weighted frame so the total vehicle weight is reduced.
For the cross-section selection the market availability is important criteria if we want to make this frame feasible for manufacturing. The following table depicts the cross-sections of the circular tube selected.
Table 2: Cross-section Selected
Outer Dia. (mm) 25.4
Thickness (mm) 3
Moment of Inertia (mm4) 13478.63
Moment of Inertia (I) is calculated by using equation no. (1)
I = (π/64)*(O.D.4 - I.D.4) (1)
Furthermore the Bending stiffness and Bending Strength is also calculated by using equation no. (2) and (3)
Bending Strength = σy*I/C (2)
[image:1.595.302.565.551.647.2]© 2017, IRJET | Impact Factor value: 5.181 | ISO 9001:2008 Certified Journal | Page 415
Here C is maximum distance of material from the neutral [image:2.595.303.545.266.386.2]axis E is Modulus of Elasticity and for steel tubes the value of E is taken to be 205 GPa.
Table 3: Strength and Stiffness
Bending Moment 526.40 N-m
Bending Stiffness 2763.11 N-m2
Thus the Seamless AISI 4130 circular tubing having cross-section of 25.4 mm of outer diameter and 3 mm thickness is selected for the design of the frame of vehicle.
3.FRAME DESIGN PARAMETERS
For the design parameters, keeping in mind the driver’s safety, a minimum of 3 inch clearance is given to all the roll-cage member from diver’s body. Furthermore the driver’s helmet clearance is kept to be 6 inches so that the driver’s body or head do not come in contact with roll-cage member to suffer any impact in any condition [2].
Second consideration is to keep driver’s comfort therefore ergonomics consideration is an important priority. Driver’s position is kept as comfortable as possible but iterating different sitting positions possible. The back angle is kept slightly slant to back at an angle of 5 degree from vertical position.
By considering the requirements for other subsystem assemblies like suspensions, steering, brakes, engine and transmission, frame is designed so that all the subassemblies could be connected together on the frame. The heavy parts like engine are directly mounted on the frame members. Lateral cross member are provided appropriately so as to counter any torsional force under running condition.
4.ANALYSIS PARAMETRS
For analysis we have to consider the worst impact condition that could occur while the vehicle is running in real life. For those condition we have to test our frame to check whether the frame is safe to sustain those condition.
The value of force to be applied on the frame for these test could be obtained by one of the following methods.
Impulse Method: As we know that force (F) multiplied by time of collision (t) is impulse and is equal to change in momentum of the body.
I.e. Mathematically,
F*t = m*(v-u) (4)
Where m is the expected mass of the vehicle i.e. taken to be 300 kg, u is the maximum velocity of the vehicle which we
take as 60 kmph, and v is final velocity i.e. 0 kmph in critical condition. Here the unknown parameter is the collision time (t), which is obtained by prototype testing.
G-Force Method: This is widely used method when prototype testing is not a feasible solution, in which the force applied is calculated in G-force. The value of G is mass of the vehicle (m) multiplied with g (acceleration due to gravity) [1].
Mathematically,
G = m*g = 300*9.81 = 2943 N (5)
The applied forces in different collisions is as follows [1]:
Table 4: G-force Applied
Front Impact 4 G
Rear Impact 3 G
Side Impact 2 G
Roll-over 1.5 G
5.ANALYSIS AND SIMULATION
For the analysis and simulation we have used the ANSYS 18 Academic. The four impact tests and their respective results are as follows
Front Impact: For the front impact the rear suspension points are fixed and the force of 4G is applied on the front most point of the frame. Meshing is done with a mesh size of 2 mm. Figure-1 shows that total maximum stress in the front impact is 86 MPa.
[image:2.595.308.556.537.741.2]© 2017, IRJET | Impact Factor value: 5.181 | ISO 9001:2008 Certified Journal | Page 416
Figure-2 shows the maximum deformation is of 1.42 mm.Figure-2: Total Deformation in front impact
Rear Impact: For the rear impact the front suspension points are kept to be fixed and force of 3G is applied on the rearmost point.
Figure-3 shows the maximum stress in rear impact is 289 MPa and Figure-4 shows that total deformation in rear impact is 3.36 mm.
Figure-3: Maximum Stress in rear Impact
Figure-4: Total Deformation in rear Impact
Side Impact: For the side impact the suspension points of the other side of the side of impact is kept fixed and the outermost point on the side is applied with the 2G force in this case it is Side Impact Member.
Figure-5 shows us that the maximum stress in side Impact is 462 MPa and Figure-6 shows that the total deformation in side impact is 15.11 mm.
© 2017, IRJET | Impact Factor value: 5.181 | ISO 9001:2008 Certified Journal | Page 417
Figure-6: Total Deformation in Side ImpactRoll Over: For the roll-over condition the bottom suspension points are kept fixed and the point which comes in contact with ground when roll over occurs is applied with the 1.5G.
Figure-7 shows that the Maximum stress in roll-over condition is 405 MPa and Figure-8 Shows that the Total Deformation is Roll-over is 0.8mm.
Figure-7: Maximum Stress in Roll-Over
Figure-8: Total Deformation in Roll-Over
The different test gave us the maximum find the FOS with it, as we know that FOS is the ratio of Yield Strength of material to the Maximum stress occurring.
Mathematically,
FOS = σy
/ (Max. Stress) (6)
The overall Result could be tabulated as follows
Table-5: Results
Impact Condition
Maximum Stress (MPa)
Total Deformation
(mm)
FOS (Calculated)
Front 86 1.42 5.76
Rear 289 3.36 1.71
Side 462 15.11 1.07
Roll-over 405 0.8 1.22
6.CONCLUSION
© 2017, IRJET | Impact Factor value: 5.181 | ISO 9001:2008 Certified Journal | Page 418
Thus it concludes that the frame designed is safe and is ableto perform its requisite functions.
REFRENCES
[1] IOSR Journal of Mechanical and Civil Engineering
(IOSR-JMCE), e-ISSN:2278-1684, p-ISSN:2320-334X PP 49-53.
[2] BAJA-SAEINDIA Rulebook 2017.
[3] Thomas D. Gillespie, Fundamentels of Vehicle Dynamics,
Research Professor Emeritus, University of Michigan Transportation Research Institute (UMTRI).
BIOGRAPHIES
Dr. V.K. Saini is currently working as Professor and Head of Mechanical Engineering Department in the Department at IMS Engineering College, Ghaziabad. His areas of research are Advanced manufacturing, composite materials & welding. He is having 13 year of teaching and 15 years of industrial experience.
Dushyant Tomer is currently pursuing his Bachelor of Technology in the Department of Mechanical Engineering at IMS Engineering College, Ghaziabad. He has a profound knowledge on SolidWorks 2014, ANSYS 18 Academic and PTC CREO.