http://dx.doi.org/10.4236/jsea.2015.84024
Metric Based Testability Estimation Model
for Object Oriented Design: Quality
Perspective
Mahfuzul Huda
1, Yagya Dutt Sharma Arya
1, Mahmoodul Hasan Khan
21Department of Computer Science & Engineering, Invertis University, Bareilly, India 2Department of Computer Science and Engineering, IET, Lucknow, India
Email: [email protected]
Received 5 April 2015; accepted 23 April 2015; published 27 April 2015
Copyright © 2015 by authors and Scientific Research Publishing Inc.
This work is licensed under the Creative Commons Attribution International License (CC BY). http://creativecommons.org/licenses/by/4.0/
Abstract
The quality factor of class diagram is critical because it has significant influence on overall quality of the product, delivered finally. Testability has been recognized as a key factor to software quality. Estimating testability at design stage is a criterion of crucial significance for software designers to make the design more testable. Taking view of this fact, this paper identifies testability factors namely effectiveness and reusability and establishes the correlation among testability, effective-ness and reusability and justifies the correlation with the help of statistical measures. Moreover study developed metric based testability estimation model and developed model has been vali-dated using experimental test. Subsequently, research integrates the empirical validation of the developed model for high level acceptance. Finally a hypothesis test performs by the two stan-dards to test the significance of correlation.
Keywords
Testability, Testability Model, Effectiveness, Reusability, Testability Factors, Design Phase
1. Introduction
into well designed units which may then be implemented separately [4]. One of the major advantage of having object orientation is its support for software reuse, which may be achieved either through the simple reuse of a class in a library or via inheritance [5]. Object oriented paradigm has created new challenges to testing, which has to deal with new problems introduced by the powerful object oriented features such as encapsulation, inhe-ritance, coupling cohesion, polymorphism, and dynamic binding. Especially dealing with instantiations of classes and their collaboration may be very difficult when testing is performed [6]. Testability suggests the test-ing intensity, and gives the degree of difficulty which will be sustained durtest-ing testtest-ing of a particular position to identify a fault [7].
It is an inevitable fact that software testability information is a helpful strategy complementary to testing. Higher test coverage may be completed by making a design more testable for the same quantity of effort, which as a result increases the confidence to the system. It is evident from literature review that there is no known complete and comprehensive model or framework available for estimating the testability of object oriented software taking design phase into consideration [8]-[12]. The model proposed in this paper addresses many is-sues raised by various researchers and practitioners. This model has low-level design metrics well defined in terms of design characteristics. The set of empirically identified and weighted object oriented design properties are used to assess the testability. Rest of the research paper is organized as follows: Section 2 and Section 3 de-scribe software testability and testability at design phase. Section 4 dede-scribes testability factors and key contri-butors. In Section 5, a Metric Based Testability Estimation Model for Object Oriented Design: Quality Perspec-tive has been proposed, design properties have been defined and a brief description of identified metrics has been included. The effectiveness of this model in predicting design testability has been validated against several real world projects in Section 6. It has been concluded that testability predicted by this model shows high corre-lation with evaluators assessments in Section 7 and a hypothesis test based on 2-sample t-test is being performed and confidence interval is being observed by the difference of two standard mean in Section 8. Finally study concluded with some key findings in Section 9 and Section 10.
2. Software Testability
Software testability study has been an essential research direction since 1990s and becomes more pervasive when entering 21st century [13] [14]. According to IEEE standard, the software testability refers to the degree to which a system or part facilitates the performance of tests and the establishment of test criteria to determine whether those test criteria have been met [15]. In ISO 9126 quality model, testability holds a prominent place as part of the reusability characteristic of software quality [16]. In order to minimize the testing effort, an attempt can be made to predict which class is more testable, by looking at two classes [17]. Testability, comprising of certain characteristics of a software system that makes it easier or harder to test and to analyze the test results, is an important factor to achieve an efficient and effective test process. Designing, verifying and measuring highly testable software becomes an important and challenging task for software designers [10]. Much of the research work reveals that maximum efforts have been dedicated with the source code. The determination of testability for an already written code may be too costly because in latter the changes are introduced the more expensive they are [18]. An extensive survey of literature reveals that processes, guidelines, and tools related to software testability are missing [19]. Thus, there appeared to be need for evaluating the testability of software in early stage of development life cycle without the availability of code. Availability of a suitable and adequate measur-ing model at the early stage of development enables early prediction of system testability, therefore, enhances the quality of making necessary changes.
3. Software Testability at Design Phase
testability. Identifying such characteristics and/or patterns would enable one to create representations of soft-ware that evolve into better testable implementations and thus, improve on the time and effort-efficiency during software testing [12]. Improving software testability is clearly a key objective in order to reduce the number of defects that result from poorly designed software [21]. Testable design is more specific then good design be-cause it is explicitly intended to match a particular test context. One proactive strategy that organizations can adopt is to design their software products with testability as one of the key design criteria. Aspects of testability like design effectiveness and reusability behavior are the primary focus of good design and require special treat- ment. No doubt, it is a key to the successful development of quality software. It is also the step that will deter-mine the overall structure, nature, and approach of the resulting software.
4. Testability Factors and Major Contributors
Plenty of work has been carried out in describing the need and importance of incorporating software testability since early 90s. A number of methods of measuring testability have been proposed. Unfortunately, significant achievements made by the researchers in the area have not been widely accepted and are not adopted in practice by industry. It has been found that there is a conflict in considering the factors while estimating software testa-bility in general and at design level exclusively. It has been inferred from the literature survey on testatesta-bility analysis that there is a heavy need of identifying a commonly accepted set of the factors affecting software tes-tability [11] [12] [15] [21]. A significant effort has been prepared to collect a set of software testability factors namely, effectiveness, understandability, simplicity, reusability, self descriptiveness, complexity, traceability and modularity that can affect software testability at design time in development life cycle [3] [5]. Out of these testability factors, some of them have their direct impact in evaluating testability of object oriented software, while other factors have less or negligible impact. An endeavor has been made to identify the testability factors that accurately affect software testability estimation at design phase. “Effectiveness” and “Reusability” are iden-tified the key testability factors that accurately affect software testability Estimation and fulfill the quality crite-ria, particularly effectiveness quality criteria is traceability, understandability, self descriptiveness and Reusabil-ity qualReusabil-ity criteria is complexReusabil-ity, simplicReusabil-ity. Therefore, it comes into view realistic to include effectiveness and reusability for testability Estimation at design phase.
5. Software Testability Model Development
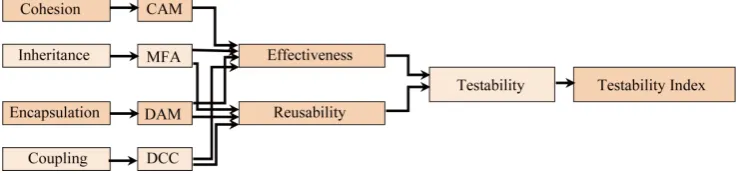
Dromey’s quality model [22] and Testability Quantification Framework [9] have been considered as a basis to develop the Metric Based Testability Estimation Model for Object Oriented Design.Figure 1, shows the corre-lation establishment among Testability, Testability factors, Design Metrics, and describes the estimation process of testability model. This involves subsequent steps:
1. Identification of Testability Factors that influences testability of software. 2. Identification of Object Oriented Design Metrics.
3. A means of linking them.
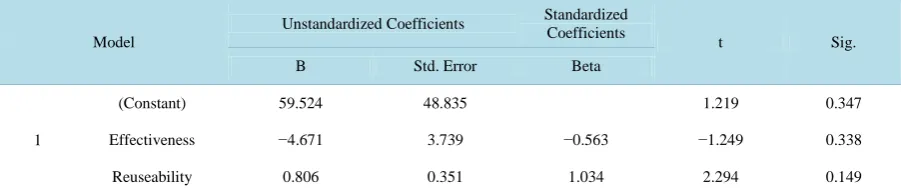
[image:3.595.126.499.618.705.2]The relative significance of individual identified testability factors that have major impact on testability esti-mation at design phase is weighted proportionally. The values of these design metrics can be identified by class diagram metrics. In order to set up a metric based model for Testability estimation, a multiple regression tech-nique has been used to get the coefficients of regression variables and regression intercept, shown inTable 1. Identified testability factors will take part in the role of independent variables while testability will be taken as dependent variable. Estimation of testability is very helpful to get testability index of software design for high
Table 1. Correlation coefficientsa.
Model
Unstandardized Coefficients Standardized Coefficients
t Sig.
B Std. Error Beta
1
(Constant) 59.524 48.835 1.219 0.347
Effectiveness −4.671 3.739 −0.563 −1.249 0.338
Reuseability 0.806 0.351 1.034 2.294 0.149
a. Dependent Variable: Testability.
quality product. Multivariate regression equation is given in Equation(1) which is as follows
0 1 1 2 2 3 3 n n
Y=a ±a X ±a X ±a X ± ± a X (1)
where
Y is dependent variable
X1, X2, X3, Xn are independent (regressor) variables.
a1, a2, a3 an are the regression coefficient of the respective independent variable. a0 is the regression intercept
It has been broadly reviewed and discussed in Section 4; Effectiveness and Reusability are the major factors affecting software testability estimation at design phase. Therefore, these identified major testability factors were addressed well in advance while incorporating testability at design stage. By applying the regression me-thod, study already developed Effectiveness Model [3] and Reusability Model [5] that is given in Equations (2) and (3) respectively. The model of Effectiveness and Reusability forms the strong basis for development of Testability Estimation Model.
Effectiveness 8.783 1.614 * Encapsulation 11.141* Inheritance 0.866 * Coupling= − + − −6.477 * Cohesion (2)
Reusability = −37.111 3.973* Coupling + +32.500 * Inheritance+20.709 * Encapsulation (3)
It was observed that every Object Oriented Design metrics affect quality factor. Design metrics namely Inhe-ritance (MFA: Measure of Functional Abstraction), Encapsulation (DAM: Data Access Metrics), Cohesion (CAM: Cohesion Among Methods) and Coupling (DCC: Direct Class Coupling) are used to address the key testability factors namely Effectiveness and Reusability. These two identified factors are further used to measure testability index of object oriented software at design stage in development life cycle.Figure 1, gives an over-view of the main idea. In order to establish a model for software testability estimation, a multiple regression me- thod discussed in Equation (1) has been applied. Consequently considering, the impact of design metrics namely Inheritance, Coupling, Cohesion and Encapsulation on testability contributors “Effectiveness and Reusability”, following multiple regression model has been formulated that can be used to develop testability model for object oriented software.
Testability=α0±β1 Effectiveness× ±β2 Reusability× (4)
For developing software testability model, the data has been taken from [23], which consist of six commercial software projects with around 10 to 20 number of classes. The values of design metrics namely, Encapsulation Metrics (DAM), Inheritance Metrics (MFA), Coupling Metrics (DCC) and Cohesion Metrics (CAM) and the values of “Effectiveness and Reusability” have been used. Using SPSS, math work software correlation coeffi-cients are calculated and model of testability Estimation is thus formulated as given in Equation (5).
Testability=59.524 4.671 Effectiveness− × +0.806 Reusability× (5)
Table 2.Model summary.
Model R R Square Adjusted R Square Std. Error of the Estimate
1 0.851a 0.725 0.450 10.80129
a. Predictors: (Constant), Reusability, Effectiveness.
6. Validating the Developed Testability Estimation Model
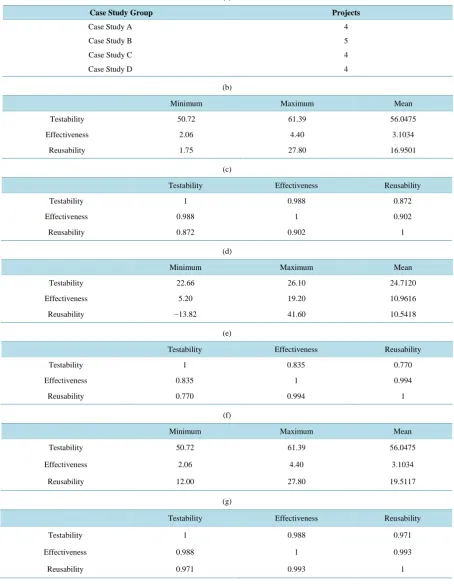
The applications for case studies in validation process for the developed testability model (Equation (5)) have been taken from [24]. We labeled the applications as: Case Study A, Case Study B, Case Study C, and Case Study D. All the Case Studies are application software, developed in C++, shown inTable 3(a).
The descriptive statistics of the outputTable 3(b),Table 3(d),Table 3(f),Table 3(h) for case study A, case study B, case study C, case study D respectively, give the valuable record of statistics that are mean, standard deviation and number of tests including 10 to 20 numbers of classes in each test. The correlation analysis tables namelyTable 3(c): Correlations Analysis for Case Study A,Table 3(e): Correlations Analysis for Case Study B, Table 3(g): Correlations Analysis for Case Study C andTable 3(i): Correlations Analysis for Case Study D, give Pearson correlation analysis between testability and key factors. Table 3(j) concludes the result of the Pearson correlation analysis for testability estimation model, which shows that for all the projects, both Effec-tiveness and Reusability are strongly correlated with Testability. The value of Pearson correlation “r” lies be-tween ±1. Positive value of “r” inTable 3(j): shows positive correlation between the Testability and Effective-ness as well as Testability and Reusability. The values of “r” close to 1 specify high degree of correlation be-tween them inTable 3(j).
7. Empirical Validation of Developed Testability Model
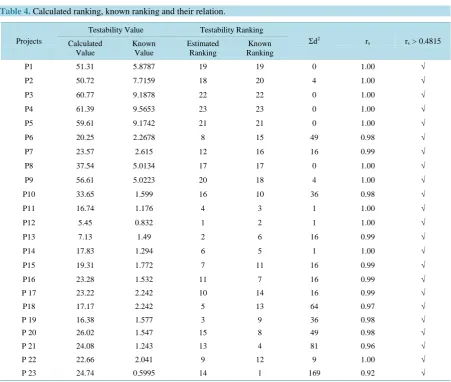
Empirical validation of work proves that how significant developed model, where metrics and model are able to quantify the testability index of object oriented design in design stage. This validation is an essential phase of research to estimate the developed model for appropriate execution and high level acceptability. It is also the fine approach and practice for claiming the model acceptance. To justify claiming for acceptance of developed model, an experimental validation of the developed testability model at design phase has been carried out using tryout data [24]. In order to validate developed model, the value of metrics are available by using above data set for following projects inTable 4. Through experiment, testability index value of the projects has been computed using the developed model, followed by the computation of testability ranking. These computed rankings are then compared with the known ranking given by experts with Charles Speraman’s Rank Coefficient of Correla-tion method.
Table 4, indicates a very important correlation between the calculated ranking and given ranking of testability estimation model, at the 0.01 for a 99% confidence interval.
• rs > 0.4815 means significant results.
• Testability Estimation model had statistically significant rank correlations with 23 of 23 projects.
Charles Speraman’s a Coefficient of Correlation rs was applied to test the significance of correlation between Calculated Values of Testability model and its “Known Values”. The “rs” was calculated using the formula giv-en by Speraman’s Coefficigiv-ent of Correlation
(
)
2
s 2 s
6 d
r 1 1.0 r 1.0
n n 1
= − − ≤ ≤ +
−
∑
(6)where
rs is coefficient of Rank Correlation
d is the difference between calculated index values and known values of reusability.
n is the number of software projects for experiment. (In this research n = 23 software projects). ∑ is notification symbol, significance “The Sum”
The correlation index values between testability obtained by developed model and expert ranking are shown in Table 4. Pairs of these index values with correlation values rs[± 0.4815] are checked in correlation values
Table 3. (a): Case study group and projects; (b): Descriptive statistics for case study A; (c): Correlations analysis for case study A; (d): Descriptive statistics for case study B; (e): Correlations analysis for case study B; (f): Descriptive statistics for case study C; (g): Correlations analysis for case study C; (h): Descriptive statistics for case study D; (i): Correlations analysis for case study D; (j): Correlations analysis summary.
(a)
Case Study Group Projects
Case Study A 4
Case Study B 5
Case Study C 4
Case Study D 4
(b)
Minimum Maximum Mean
Testability 50.72 61.39 56.0475
Effectiveness 2.06 4.40 3.1034
Reusability 1.75 27.80 16.9501
(c)
Testability Effectiveness Reusability
Testability 1 0.988 0.872
Effectiveness 0.988 1 0.902
Reusability 0.872 0.902 1
(d)
Minimum Maximum Mean
Testability 22.66 26.10 24.7120
Effectiveness 5.20 19.20 10.9616
Reusability −13.82 41.60 10.5418
(e)
Testability Effectiveness Reusability
Testability 1 0.835 0.770
Effectiveness 0.835 1 0.994
Reusability 0.770 0.994 1
(f)
Minimum Maximum Mean
Testability 50.72 61.39 56.0475
Effectiveness 2.06 4.40 3.1034
Reusability 12.00 27.80 19.5117
(g)
Testability Effectiveness Reusability
Testability 1 0.988 0.971
Effectiveness 0.988 1 0.993
(h)
Minimum Maximum Mean
Testability 50.72 61.39 56.0475
Effectiveness 2.06 4.40 3.1034
Reusability 1.75 27.80 16.9501
(i)
Testability Effectiveness Reusability
Testability 1 0.782 0.994
Effectiveness 0.782 1 0.820
Reusability 0.994 0.820 1
(j)
Testability × Effectiveness Testability × Reusability
Case Study A 0.988 0.872
Case Study B 0.835 0.770
Case Study C 0.988 0.971
[image:7.595.87.539.339.721.2]Case Study D 0.782 0.994
Table 4.Calculated ranking, known ranking and their relation.
Projects
Testability Value Testability Ranking
Σd2 r
s rs > 0.4815
Calculated Value
Known Value
Estimated Ranking
Known Ranking
P1 51.31 5.8787 19 19 0 1.00 √
P2 50.72 7.7159 18 20 4 1.00 √
P3 60.77 9.1878 22 22 0 1.00 √
P4 61.39 9.5653 23 23 0 1.00 √
P5 59.61 9.1742 21 21 0 1.00 √
P6 20.25 2.2678 8 15 49 0.98 √
P7 23.57 2.615 12 16 16 0.99 √
P8 37.54 5.0134 17 17 0 1.00 √
P9 56.61 5.0223 20 18 4 1.00 √
P10 33.65 1.599 16 10 36 0.98 √
P11 16.74 1.176 4 3 1 1.00 √
P12 5.45 0.832 1 2 1 1.00 √
P13 7.13 1.49 2 6 16 0.99 √
P14 17.83 1.294 6 5 1 1.00 √
P15 19.31 1.772 7 11 16 0.99 √
P16 23.28 1.532 11 7 16 0.99 √
P 17 23.22 2.242 10 14 16 0.99 √
P18 17.17 2.242 5 13 64 0.97 √
P 19 16.38 1.577 3 9 36 0.98 √
P 20 26.02 1.547 15 8 49 0.98 √
P 21 24.08 1.243 13 4 81 0.96 √
P 22 22.66 2.041 9 12 9 1.00 √
can conclude without any loss of generality that Testability Estimation Model, measures are highly reliable and significant at design phase.
8. Hypothesis Testing of Coefficient of Correlation
A practical coefficient of correlation of Effectiveness and Reusability with Testability strongly indicates the higher significance and importance of taking into consideration both the identified key factors (Effectiveness and Reusability) for making an evaluation of software testability at design phase. Moreover to justify the result, a test to compute the statistical importance of the correlation coefficient obtained possibly will be appropriate. A null hypothesis testing is applied to test the significance of Correlation Coefficient (r) using the given Equation (7):
2 r n 2 t
1 r − =
− (7) With n − 2 degree of freedom, a coefficient of correlation is evaluated as statistically important when the t value equals or exceeds the t critical value in the t distribution critical values.
H0 (T^E): Testability and Effectiveness are not highly correlated.
H0 (T^R): Testability and Reusability are not highly correlated.
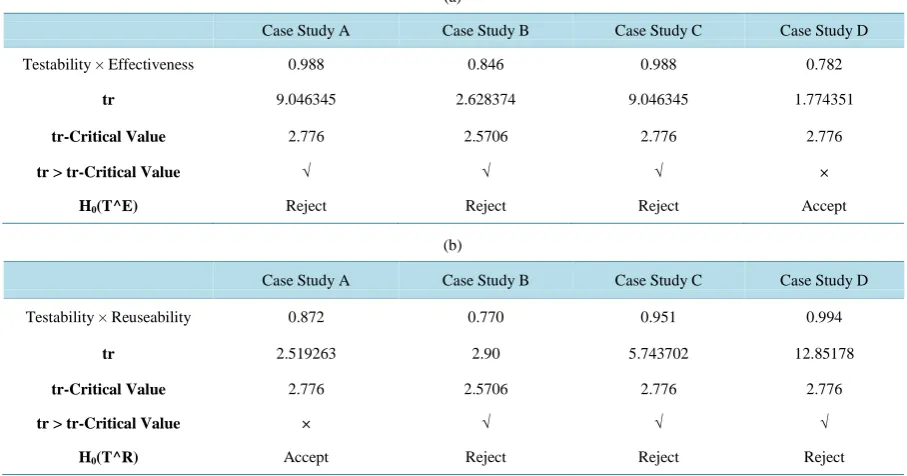
Using 2-tailed test at the 0.05 for a 95% confidence interval with different degrees of freedom, it is clear from Table 5(a) andTable 5(b), the null hypothesis is rejected (with the exception of, for Case Study “D” of “Testa-bility and Effectiveness” and Case Study “A” of “Testa“Testa-bility and Reusa“Testa-bility”). As a result, the researcher’s claim of correlating Testability with Effectiveness and Reusability at design phase is Statistically justified.
9. Key Contributions and Findings
This Study developed ‘Metric Based Testability Estimation Model for Object Oriented Design: Quality Perspec-tive’. The Model has been validated using the same set of try-out data. An empirical validation of the developed model is also performed using try-out data. Some of the major findings are as given below:
[image:8.595.86.540.482.720.2]• Software testability has been recognized as a key factor to quality software, addressed in design phase of ob-ject oriented software development to produce quality software.
Table 5. (a): Correlation coefficient test for testability and effectiveness; (b): Correlation coefficient test for testability and reusability.
(a)
Case Study A Case Study B Case Study C Case Study D
Testability × Effectiveness 0.988 0.846 0.988 0.782
tr 9.046345 2.628374 9.046345 1.774351
tr-Critical Value 2.776 2.5706 2.776 2.776
tr > tr-Critical Value √ √ √ ×
H0(T^E) Reject Reject Reject Accept
(b)
Case Study A Case Study B Case Study C Case Study D
Testability × Reuseability 0.872 0.770 0.951 0.994
tr 2.519263 2.90 5.743702 12.85178
tr-Critical Value 2.776 2.5706 2.776 2.776
tr > tr-Critical Value × √ √ √
• Low level measures of each of the testability factors may be obtained.
• Software design constructs are most appropriate and power full for controlling software quality factors in de-sign phase.
• There is a feasibility of establishing correlation between testability and other quality factors in the order to address them in design phase.
• Effectiveness and Reusability are identified as two major factors affecting software testability in designing phase.
• Testability indexing (TI) is possible using the model “Metric Based Testability Estimation Model for Object Oriented Design: Quality Perspective” for Industry project ranking.
• The models may be generalized and used by other researcher for making testability leveling of projects un-dertaken.
10. Conclusion
Software testability key factors namely effectiveness and reusability are identified and their significance on tes-tability Estimation at design phase has been tested and justified. Testes-tability Estimation model for object oriented design has been developed and the statistical inferences are validated for high level model acceptability. The developed model to evaluate testability of object oriented software is extremely consistent and correlated with object oriented design artifacts. Testability Estimation model has been validated theoretically as well as empiri-cally using experimental test. That validation study on this research work proves that developed testability esti-mation model is highly acceptable, more practical in nature and helps the software industry in project ranking.
Acknowledgements
First and foremost, I would like to express my sincere gratitude to my supervisor Prof. Dr. YDS Arya & Co- supervisor Associate Prof. Dr. M H Khan for the continuous support of my PhD study and research, motivation, enthusiasm. Their guidance helped me in all the time of research. Last but not the least; I would like to thank my parent for their patience, understanding and support that drive me to complete my study.
References
[1] Amin, A. and Moradi, S. (2013) A Hybrid Evaluation Framework of CMM and COBIT for Improving the Software Development Quality.
[2] Binder, R.V. (1994) Design for Testability in Object-Oriented Systems. Communications of the ACM, 37, 87-101. http://dx.doi.org/10.1145/182987.184077
[3] Huda, M., Arya, Y.D.S. and Khan, M.H. (2015) Evaluating Effectiveness Factor of Object Oriented Design: A Testa-bility Perspective. International Journal of Software Engineering & Applications (IJSEA), 6, 41-49.
http://dx.doi.org/10.5121/ijsea.2015.6104
[4] Esposito, D. (2008) Design Your Classes for Testability.
http://dotnetslackers.com/articles/nnet/Design-Your-Classes-for-Testability.aspx
[5] Huda, M., Arya, Y.D.S. and Khan, M.H. (2015) Quantifying Reusability of Object Oriented Design: A Testability Perspective. Journal of Software Engineering and Applications, 8, 175-183. http://dx.doi.org/10.4236/jsea.2015.84018 [6] Zheng, W.Q. and Bundell, G. (2008) Contract-Based Software Component Testing with UML Models. International
Symposium on Computer Science and Its Applications (CSA ’08), 978-0-7695, 13-15 October 2008, 83-102.
[7] Zhao, L. (2006) A New Approach for Software Testability Analysis. Proceeding of the 28th International Conference on Software Engineering, Shanghai, 985-988. http://dx.doi.org/10.1145/1134285.1134469
[8] Huda, M., Arya, Y.D.S. and Khan, M.H. (2014) Measuring Testability of Object Oriented Design: A Systematic Re-view. International Journal of Scientific Engineering and Technology (IJSET), 3, 1313-1319.
[9] Huda, M., Arya, Y.D.S. and Khan, M.H. (2015) Testability Quantification Framework of Object Oriented Software: A New Perspective. International Journal of Advanced Research in Computer and Communication Engineering, 4, 298- 302. http://dx.doi.org/10.17148/IJARCCE.2015.4168
[10] Gao, J. and Shih, M.-C. (2005) A Component Testability Model for Verification and Measurement. Proceedings of the
29th Annual International Computer Software and Applications Conference, Edinburgh, 26-28 July 2005, 211-218. http://dx.doi.org/10.1109/COMPSAC.2005.17
British Journal of Applied Science & Technology, 4, 3069-3095.
[12] Fu, J.P. and Lu, M.Y. (2009) Request-Oriented Method of Software Testability Measurement. Proceedings of theITCS
2009 International Conference on Information Technology and Computer Science, Kiev, 25-26 July 2009, 77-80. [13] IEEE Press (1990) IEEE Standard Glossary of Software Engineering Technology. ANSI/IEEE Standard 610.12-1990.
[14] Lo, B.W.N. and Shi, H.F. (1998) A Preliminary Testability Model for Object-Oriented Software. Proceedings of the International Conference on Software Engineering, EducationandPractice, Dunedin, 29-29 January 1998, 330-337. http://dx.doi.org/10.1109/SEEP.1998.707667
[15] Badri, M. and Toure, F. (2012) Empirical Analysis of Object-Oriented Design Metrics for Predicting Unit Testing Ef-fort of Classes. Journal of Software Engineering and Applications, 5, 513-526.
http://dx.doi.org/10.4236/jsea.2012.57060
[16] ISO (2001) ISO/IEC 9126-1: Software Engineering—Product Quality—Part-1: Quality Model. Geneva.
[17] Bach, J. (1999) Heuristics of Software Testability.
[18] Mulo, E. (2007) Design for Testability in Software Systems. Master’s Thesis. http://swerl.tudelft.nl/twiki/pub/Main/ResearchAssignment/RA-Emmanuel-Mulo.pdf
[19] Mouchawrab, S., Briand, L.C. and Labiche, Y. (2005) A Measurement Framework for Object-Oriented Software Tes-tability. Information and Software Technology, 47, 979-997. http://dx.doi.org/10.1016/j.infsof.2005.09.003
[20] Jungmayr, S. (2002) Testability during Design, Softwaretechnik-Trends. Proceedings of the GI Working Group Test,
Analysis and Verification of Software, Potsdam, 20-21 June 2002, 10-11.
[21] Bruntink, M. and Van Deursen, A. (2004) Predicting Class Testability Using Object-Oriented Metrics. Proceedings of theFourth IEEE International Workshop onSource Code Analysis and Manipulation, Chicago, 15-16 September 2004, 136-145.
[22] Dromey, R.G. (1996) Concerning the Chimera (Software Quality). IEEE Software, 13, 33-43. http://dx.doi.org/10.1109/52.476284
[23] Khan, R.A. and Mustafa, K. (2009) Metric Based Testability Model for Object Oriented Design (MTMOOD). ACM SIGSOFT Software Engineering Notes, 34, 1-6.