ISSN Online: 1945-3108 ISSN Print: 1945-3094
A Study about Effects of River Water Quality on
Fish Living in Büyük Menderes Basin, Turkey
Ebru Yilmaz
1, Cengiz Koç
21Department of Aquaculture and Fisheries Engineering, Faculty of Agriculture, Adnan Menderes University, Aydın, Turkey 2Department of City and Regional Planning, Faculty of Architecture, Muğla Sıtkı Koçman University, Muğla, Turkey
Abstract
The measurements for the quality of the water were made at eight stations of Adıgüzel Dam, Yenice Regulator, Sarayköy Bridge, Feslek Regulator, Yenipazar Bridge, Aydın Bridge, Koçarlı Bridge, Söke Regulator located at the Buyuk Men-deres River, Turkey. The study was conducted for the period between 2000-2013 for the months of February, April, June, August, October and December. The re-sults received were analyzed for temperature, pH, EC, Cl−, Na, Ca2+, Mg2+, K+,
2 4
SO −, TDS, TH and SS aquaculture. The results of the analyses revealed that
al-though the water pollution in the river showed variations throughout the year, in fact the samples obtained at various locations displayed high levels of pollutants. The “Regulation on Turkish Water Pollution Control” was made use of in classify-ing the parameters of the water in this study. These parameters were compared with the WHO Guidelines and TS-266. Among the 8 Dams that were included in the study, the best quality of water was measured in the Adıgüzel Dam, which gave the lowest values; and the levels were measured to be higher in the Saraykoy Sta-tion than those of the other dams. There was a severe drought in Menderes Basin in 2007, and therefore the highest annual values were measured for the year 2007. In those years, the levels of the irrigation water decreased as low as 4255 m3/ha.
The SPSS 21 Statistical Analysis Program was made use of in analyzing the data of the study. The One-Way Anova and Tukey Multiple Comparison tests were also used for the analyses of the data as well. The p < 0.05 level was accepted as being significant in the analyses. The distribution of the data was performed by using the Box-plot Graphs. Furthermore, the effects on fish species and the pollution in Büyük Menderes River were also examined in the study.
Keywords
Büyük Menderes River, Water Quality, Fish, Pollution, Turkey
How to cite this paper: Yilmaz, E. and Koç, C. (2016) A Study about Effects of River Water Quality on Fish Living in Büyük Menderes Basin, Turkey. Journal of Water Resource and Protection, 8, 1175-1190. http://dx.doi.org/10.4236/jwarp.2016.812091
Received: October 14, 2016 Accepted: November 18, 2016 Published: November 21, 2016
Copyright © 2016 by authors and Scientific Research Publishing Inc. This work is licensed under the Creative Commons Attribution International License (CC BY 4.0).
http://creativecommons.org/licenses/by/4.0/
1. Introduction
Water pollution results from adverse changes in physical, chemical, bacteriological, ra-dioactive and ecological features of water sources. Water pollution is a quality change which not only disturb economical stability and but also restrict usage as a result of anthropogenic impacts. FAO is defined as mixing some substances that is harmful and hazardous to living resources and human health, injuring water quality into the water
[1][2].
Water quality is a very significant issue of critical importance in various nations and especially Turkey there is cause for concern. Naturally, it is expected that freshwater supplies will dwindle in the near future and thus this requires careful examination and monitoring. By monitoring the water quality, it’s possible to understand the effect of pollution and it will assist to manage aquatic resources and to protect aquatic fauna [3].
Urbanization, tourism, industry, agriculture and other similar human activities on Earth have great impacts on the basin of the Büyük Menderes River. There are also some obstacles that prevent the migration of the fish and also decrease the quality of water. In the past, the river was a precious source of water for drinking for the people living around, and for fishing. Nowadays, on the other hand, it is not possible to be used for irrigation due to the low quality and the influences of the abovementioned factors.
In Turkey, there are many regulations that are being constantly updated as related to water and the effects of pollution on this source. One of these principal regulations is the “Regulation for Control of Water Pollution” printed in official gazette of the Re-public of Turkey on the date of 12/31/2004. This regulation is mainly concerned with the fundamental principles to prevent contamination of water resources and their safe usage. The water resources include both freshwater and groundwater resources. Fur-thermore, the Turkish Standard TS 266 regulates the water use for human consump-tion. The examined parameters have been compared with TS 266 and WHO guidelines. Aim of this research focuses on analyzing the influences of the pollutant materials on water quality parameters as well as fish diversity in the Büyük Menderes River Basin. The key chemical parameters of temperature, pH, EC, Cl−, Na, Ca2+, Mg2+, K+, 2
4
SO −,
TDS, TH and SS were monitored in the Büyük Menderes River between 2000 and 2013. The fish populations in years 2003 and 2013 were compared (Table 1) [4][5].
2. Materials and Method
2.1. Study Area
Table 1. The variety of fish types caught from past to present from the Büyük Menderes River [4] [5].
Fish Species Before 2003 2003 2013
Silurus glanis X
Anguilla anguilla
Nemachilus angorae X
Cyprinus carpio X
Capoeta capoeta bergamae
Barbus capito pectoralis X
Barbus plebejus escherichi X
Leuciscus cephalus X
Chondrostoma holmwoodi Meandrensis
Acanthobrama mirabilis X
Aphanius anatoliae anatoliae
Gambusia affinis X
Cobitis turcica X X
Hemigrammocapoeta kemali X
Gobio gobio X X
Barbus tauricus esherichi X X
Esox lucius X X
Carassius gibelio X
Squalius fellowesii X X
Squalius carinus X X
Alburnoides cf. Smyrnae X X
Alburnus cf. X X
Ladigesocypris mermere X X
Vimba mirabilis X X
Barbus pergamonensis X X
Luciobarbus kottelati X X
Pseudorasbora parva X
Rhodeus amarus X X
Pseudophoxinus maeandricus X X
Pseudophoxinus maeandri X X
Tinca tinca X X
Gobio maeandricus X X
Esox lucius X X
Aphanius fasciatus X X
Cobitis cf simplicispina X X
Gambusia holbrooki X X
Atherina boyeri X X
Knipowitschia caucasica X X
Lepomis gibbosus X X
Oxynoemacheilus cf. Cinicus X X
Oxynoemacheilus germencicus X X
Syngnathus abaster X X
Liza ramada X X
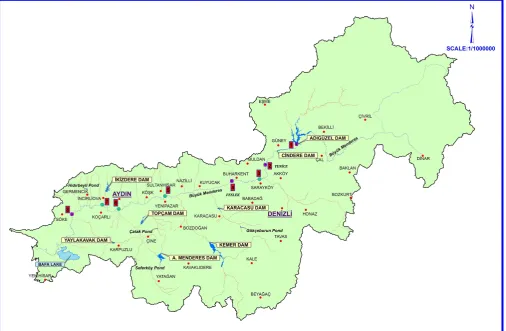
Işıklı Lake, Bafa Lake, and the Büyük Menderes River Delta. It is also a very important river basin in terms of biodiversity, being subject to the effects of both the Mediterra-nean and continental climates. The locations of the eight stations selected for this study are shown in Figure 1. The stations were chosen deliberately to identify the degrada-tion of the quality of the water as a result of the urban polludegrada-tion observed in the area. Station 1 is the Adıgüzel Dam. In this dam, there is a certain problem detected in the form of mutations in the genetic structure of the fish and this problem results from the industrial residues which contain leather and textile as well as waste materials coming from Uşak. Station 2 is constituted by the Yenice Regulator. It is 32 km away from the Adıgüzel Dam where pollution stems from domestic waste and pesticides. Station 3 is the Sarayköy Bridge which is influenced by the wastes coming from the Denizli-Sarayköy sewage system, the geothermal plant nearby, and a textile factory. Station 4 is the Feslek Regulator. The Büyük Menderes River is polluted by domestic wastes and pesticide packages coming from the nearby residential and industrial areas. Station 5 is the Ye-nipazar Bridge which is polluted by the water coming from the Akçay tributary in the Yenipazar Bridge. Station 6 is the Aydın Bridge which is affected mainly by untreated wastewater coming from the industrial zones and municipal sewage treatment plants nearby. Station 7 is the Koçarlı Bridge which merges with the Menderes following the
Cine and İkizdere streams. Station 8 is the Söke Regulator, stations of which are pol-luted by the domestic wastes and pesticide packages coming from the nearby areas.
2.2. Data Analysis
The quality of the water was measured in 8 stations which are the Adıgüzel Dam, the Yenice Regulator, the Sarayköy Bridge, the Feslek Regulator, the Yenipazar Bridge, the Aydın Bridge, the Koçarlı Bridge, the Söke Regulator. The temperature, pH and con-ductivity values were measured in the stations. The samples to be used for the mea-surements were brought to the laboratories as soon as possible to start the analyses. A Mercury Thermometer with 0.1˚C sensitivity was used in the measurements. The Orion pH Meter (Model SA 720) was used to measure the pH. The Jenway conductometer was used to measure the electrical conductivity. The argentometric method was used to measure the chloride; flame photometry was used to measure the sodium and potas-sium; the Perkin Elmer automatic absorption Spectrophotometer equipment was used to measure the calcium and magnesium; the calorimetric method was used to measure the sulfate; Total dissolved solid (TDS) was measured by TDS meter (Model: HM Digi-tal); Total water hardness (TH) as CaCO3; Suspended Solids (SS) dried at 103˚C -
105˚C. In order to analyze the results, the international algorithmic processes were im-plemented [6]. Analysis of the water samples was conducted at government facilities of SHW Quality Control Laboratory. The measurements were made between the years 2000 and 2013, in the months of February, April, and then June, August, October as well as December. All of the water samples were analyzed for temperature, pH, EC, Cl−,
Na, Ca2+, Mg2+, K+, 2 4
SO−, TDS, TH and SS. The SPSS 21 Statistical Analysis Program
was used for the data analyses. The One-Way Anova and the Tukey Multiple Compari-son tests were applied to the data. The difference between the groups was p < 0.05. The distribution of the data was shown by using the Box-Plot Graphs.
3. Results and Discussion
The water parameter measurement (the temperature, pH, EC, Cl−, Na, Ca2+, Mg2+, K+, 2
4
SO −, TDS, TH and SS) between the years 2000 and 2013 are given. The results were
[image:5.595.195.554.565.683.2]given in Tables 2-4.
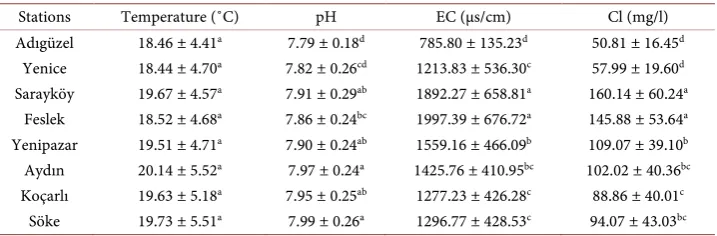
Table 2. Results of chemical analyses of water samples taken from Büyük Menderes River.
Stations Temperature (˚C) pH EC (μs/cm) Cl (mg/l)
Adıgüzel 18.46 ± 4.41a 7.79 ± 0.18d 785.80 ± 135.23d 50.81 ± 16.45d Yenice 18.44 ± 4.70a 7.82 ± 0.26cd 1213.83 ± 536.30c 57.99 ± 19.60d Sarayköy 19.67 ± 4.57a 7.91 ± 0.29ab 1892.27 ± 658.81a 160.14 ± 60.24a
Feslek 18.52 ± 4.68a 7.86 ± 0.24bc 1997.39 ± 676.72a 145.88 ± 53.64a Yenipazar 19.51 ± 4.71a 7.90 ± 0.24ab 1559.16 ± 466.09b 109.07 ± 39.10b Aydın 20.14 ± 5.52a 7.97 ± 0.24a 1425.76 ± 410.95bc 102.02 ± 40.36bc Koçarlı 19.63 ± 5.18a 7.95 ± 0.25ab 1277.23 ± 426.28c 88.86 ± 40.01c
Table 3. Results of chemical analyses of water samples taken from Büyük Menderes River.
Stations Na (mg/) Ca2+ (mg/l) Mg2+ (mg/l) K+ (mg/l) Adıgüzel 93.97 ± 61.83b 75.90 ± 25.24e 38.65 ± 9.59f 6.20 ± 1.27c
Yenice 75.26 ± 36.50b 85.62 ± 27.79de 59.44 ± 33.77e 7.64 ± 2.18b Sarayköy 133.40 ± 68.85a 149.02 ± 51.90a 94.30 ± 41.86bc 8.73 ± 3.67b Feslek 153.30 ± 73.76a 145.05 ± 46.58a 109.87 ± 45.58a 10.85 ± 3.77a Yenipazar 91.57 ± 37.45b 120.43 ± 42.76b 99.51 ± 26.20ab 8.59 ± 3.46b Aydın 96.46 ± 43.27b 104.09 ± 33.95bc 84.16 ± 26.09cd 8.77 ± 3.38b Koçarlı 85.43 ± 43.04b 96.46 ± 32.32cd 71.21 ± 25.20de 8.62 ± 3.62b Söke 90.24 ± 46.51b 90.39 ± 29.67cd 71.87 ± 25.47de 8.30 ± 3.67b Values are mean ± SEM. The differences between the amount expressed with different exponential characters in the same column are statistically significant (p < 0.05).
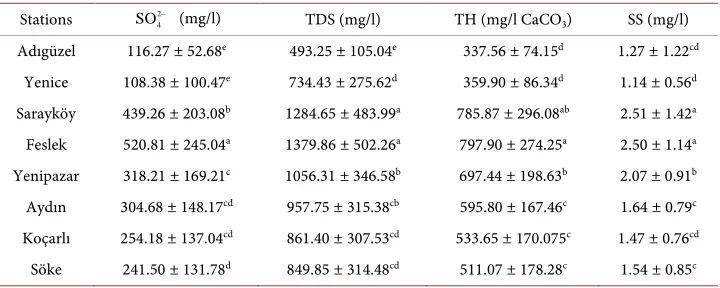
Table 4. Results of chemical analyses of water samples taken from Büyük Menderes River.
Stations 2
4
SO− (mg/l) TDS (mg/l) TH (mg/l CaCO3) SS (mg/l) Adıgüzel 116.27 ± 52.68e 493.25 ± 105.04e 337.56 ± 74.15d 1.27 ± 1.22cd
Yenice 108.38 ± 100.47e 734.43 ± 275.62d 359.90 ± 86.34d 1.14 ± 0.56d Sarayköy 439.26 ± 203.08b 1284.65 ± 483.99a 785.87 ± 296.08ab 2.51 ± 1.42a Feslek 520.81 ± 245.04a 1379.86 ± 502.26a 797.90 ± 274.25a 2.50 ± 1.14a Yenipazar 318.21 ± 169.21c 1056.31 ± 346.58b 697.44 ± 198.63b 2.07 ± 0.91b Aydın 304.68 ± 148.17cd 957.75 ± 315.38cb 595.80 ± 167.46c 1.64 ± 0.79c Koçarlı 254.18 ± 137.04cd 861.40 ± 307.53cd 533.65 ± 170.075c 1.47 ± 0.76cd Söke 241.50 ± 131.78d 849.85 ± 314.48cd 511.07 ± 178.28c 1.54 ± 0.85c Values are mean ± SEM. The differences between the amount expressed with different exponential characters in the same column are statistically significant (p < 0.05).
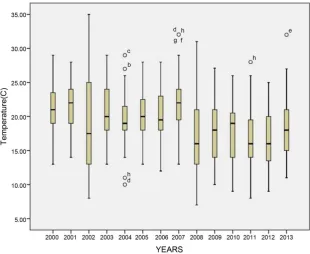
3.1. Temperature
The temperature value was the lowest in the Yenice Regulator (18.44 ± 4.70a mg/l) and
the highest in the Aydın Bridge (20.14 ± 5.52a mg/l), which is given in Table 2. No
sig-nificant differences were observed in the annual temperature values of the 8 stations (p > 0.05). The temperature was the lowest (16.62 ± 4.48f mg/l) in 2012 and the highest
(22.07 ± 4.79a mg/l) in 2007. The difference between the years for which the study was
conducted was found to be statistically significant (p < 0.05) (Figure 2). In terms of water temperature, The Büyük Menderes water can be classified as “class I” according to the TWPCR.
3.2. pH
The pH value was measured as the lowest in the Adıgüzel Dam (7.79 ± 0.18d) and as the
highest in the Söke Regulator (7.99 ± 0.26a), which is given in Table 2. In all of the 8
stations, significant differences were determined in the annual pH levels (p < 0.05). The pH was measured as the lowest (7.73 ± 0.24e) in 2003, and measured as the highest
[image:6.595.194.554.286.430.2]differ-ences were found to be statistically significant (p < 0.05) (see Figure 3). In terms of pH, the water of Büyük Menderes river can be classified as “class I” according to the TWPCR. Therefore, pH value in all the years is compatible with the values proposed by TS 266 and WHO guidelines.
Figure 2. Change graphics of ˚C values in Büyük Menderes River during 2000-2013.
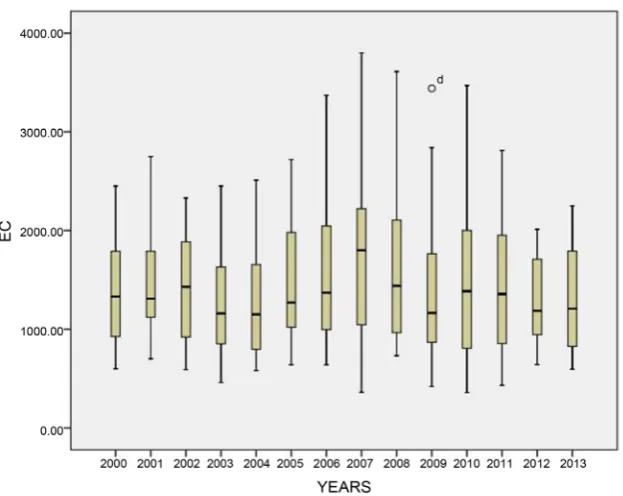
[image:7.595.219.531.423.679.2]3.3. Electrical Conductivity (EC)
The EC value was measured as the lowest in the Adıgüzel Dam (785.80 ± 135.23d
μs/cm) and measured as the highest in the Feslek Regulator (1997.39 ± 676.72a μs/cm),
which is given in Table 2. In all of the 8 stations, significant differences were deter-mined in the annual Electrical Conductivity (EC) levels (p < 0.05). The Electrical Con-ductivity (EC) level was measured as the lowest (1249.14 ± 508.22c μs/cm) in 2004, and
it was measured as the highest (1718.66 ± 772.67a μs/cm) in 2007. The differences
be-tween all the years were statistically significant level (p < 0.05) (Figure 4). The electrical conductivity (EC) is usually used for indicating the total concentration of charged ionic species in water [7]. EC value in all the years is compatible with the value proposed by TS 266 and WHO guidelines.
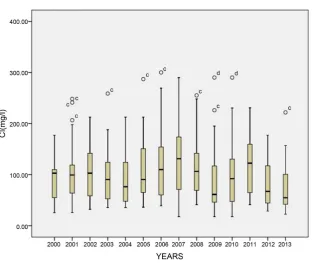
3.4. Chloride (Cl
−)
The Chloride was measured as the lowest in the Adıgüzel Dam (50.81 ± 16.45d mg/l)
and it was measured as the highest in the Sarayköy Bridge (160.14 ± 60.24a mg/l), which
is given in Table 2. The differences were observed to be significant in all of the 8 sta-tions (p < 0.05). The Chloride was measured as the lowest (72.85 ± 44.10e mg/l) in 2013
and it was measured as the highest (130.20 ± 66.44a mg/l) in 2007. The annual
differ-ences were found to be statistically significant (p < 0.05) (Figure 5). Water quality at Adıgüzel Dam was I. class in terms of COD values while Sarayköy Bridge was II. Class. Chloride value in all the years is compatible with the value proposed by TS 266 and WHO guidelines. For freshwater fish, however, the concentration of chloride should not exceed 860 mg/L [8]. All Cl− values recorded in sampling stations in Büyük
[image:8.595.219.531.441.689.2]Men-deres River were below the maximum permissible level for protection of aquatic life.
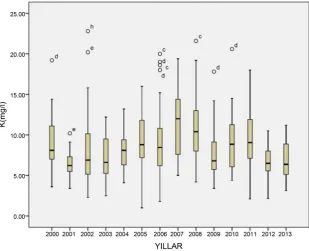
Figure 5. Change graphics of Cl− values in Büyük Menderes River during 2000-2013.
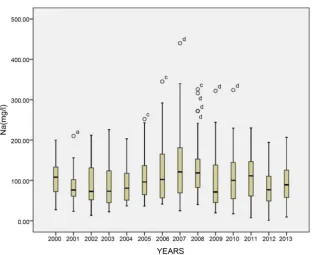
3.5. Minerals (Sodium, Calcium, Magnesium, and Potassium)
The Sodium was measured as the lowest in the Yenice regulator (75.26 ± 36.50b mg/l)
and it was measured as the highest in the Feslek Regulator (153.30 ± 73.76a mg/l),
which is given in Table 3. In all of the 8 stations, significant differences were deter-mined in the annual pH levels (p < 0.05). The Sodium was measured as the lowest (83.08 ± 36.44d mg/l) in 2001 and it was measured as the highest (139.85 ± 87.51a mg/l)
in 2007. The annual differences were found to be statistically significant (p < 0.05) (Figure 6). In terms of sodium, the water of Büyük Menderes river can be classified as “class I” according to the TWPCR. Sodium value in all the years is compatible with the value proposed by TS 266 and WHO guidelines. The natural range of sodium ions in water and soil is so low, their existence can show river pollution caused by human ac-tivities [9].
In total hardness Ca and Mg are the most important two elements. They are impor-tant for skeleton structure of both aquatic and terrestrial organisms. Also, Mg has an important function in the blood of the human and animals. Water hardness is very important quality criteria for fisheries and drinking [10].
The Calcium levels were measured as the lowest at Adıgüzel Dam (75.90 ± 25.24e
mg/l) and they were measured as the highest at Sarayköy Bridge (149.02 ± 51.90a mg/l),
which is given in Table 3. In all of the 8 stations, significant differences were deter-mined in the annual pH levels (p < 0.05). The Calcium was measured as the lowest (96.81 ± 37.68a mg/l) in 2012 and it was measured as the highest (119.42 ± 49.50a mg/l)
Figure 6. Change graphics of Na values in Büyük Menderes River during 2000-2013.
Figure 7. Change graphics of Ca2+ values in Büyük Menderes River during 2000-2013.
In fisheries, 400 mg/L calcium values are accepted as suitable [11]. Calcium value in all the years is compatible with the value proposed by TS 266 and WHO guidelines. The higher value of calcium registered during the study period may be due to the influx of industrial waste and sewage to the river water.
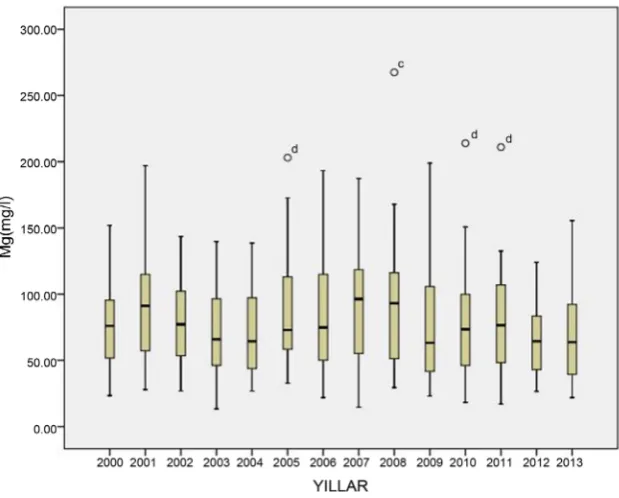
[image:10.595.217.531.348.601.2]and it was measured as the highest in the Feslek regulator (109.87 ± 45.58a mg/l), which
is given in Table 3. In all of the 8 stations, significant differences were determined in the annual pH levels (p < 0.05). The Magnesium was measured as the lowest (65.58 ± 27.38d mg/l) in 2012 and it was measured as the highest (92.74 ± 41.32a mg/l) in the
year 2007. The difference per annum was found to be statistically significant (p < 0.05)
(Figure 8). Furthermore, it was highlighted that the amount of magnesium which is
found in 95% of water with 14 mg/l magnesium. In addition, it is probable that 100 mg/l - 400 mg/l of poisoned magnesium was found in fresh water. In retrospect, fresh water fish which are found in 1000 mg/l magnesium can also be found salty water which includes sodium and calcium [12].
Büyük Menderes River is poor in potassium and plankton growth is so low. The Po-tassium levels were measured as the lowest in the Adıguzel Dam (6.20 ± 1.27c mg/l) and
they were measured as the highest in the Feslek Regulator (10.85 ± 3.77a mg/l), which is
given in Table 3. In all of the 8 stations, significant differences were determined in the annual pH levels (p < 0.05). The Potassium was measured as the lowest (6.31 ± 1.51e
mg/l) in 2001 and it was measured as the highest (11.48 ± 4.09a mg/l) in 2007. The
an-nual differences were found to be statistically significant (p < 0.05) (Figure 9). In terms of potassium, the water of Buyuk Menderes river can be categorized as “class I” as per the regulations in TWPCR.
3.6. Sulphate (
2 4SO
−)
The Sulphate ( 2 4
SO −) values (Table 4) were measured as the lowest in the Yenice
Regu-lator (108.38 ± 100.47e mg/l) and they were measured as the highest in the Feslek
[image:11.595.219.529.444.693.2]Regula-tor (520.81 ± 245.04a mg/l). In all of the 8 stations, significant differences were determined
in the annual Sulphate ( 2 4
SO −) levels (p < 0.05). The Sulphate ( 2 4
SO −) values were
measured as the lowest (166.07 ± 143.77d mg/l) in 2003 and they were measured as the
highest (378.21 ± 265.45a mg/l) in 2007. The differences for all the study years were
[image:12.595.219.529.143.394.2]found to be statistically significant (p < 0.05) (Figure 10). Sulphur is present in natural
Figure 9. Change graphics of K+ values in Büyük Menderes River during 2000-2013.
Figure 10. Change graphics of 2
4
SO− values in Büyük Menderes River during 2000-
[image:12.595.218.531.420.675.2]waters as sulphate. Water quality at Yenice Regulator was I. class in terms of sulphate values while Feslek Regulator was IV. Class. In this region, increase in sulphate origi-nates from land with gypsum.
3.7. Total Suspended Solids (TDS)
TDS was measured as the lowest in the Adıgüzel Dam (493.25 ± 105.07e mg/l) and it
was measured as the highest in the Feslek Regulator (1379.86 ± 502.267a mg/l), which is
given in Table 4. In all of the 8 stations, significant differences were determined in the annual pH levels (p < 0.05). TDS was measured as the lowest (797.50 ± 323.745d mg/l)
in 2004 and it was measured as the highest (1239.58 ± 584.13a mg/l) in 2007. The
an-nual differences were found to be statistically significant (p < 0.05) (Figure 11). Water quality at Adıgüzel Dam was I. class in terms of TDS values while Feslek Regulator was II. class. Klein (1992) has reported that the excess amount of TDS in water disturbed ecological balance and cause suffocation of aquatic life.
3.8. Total Hardness (TH)
TH was measured as the lowest in the Adıgüzel Dam (337.56 ± 74.15d mg/l) and it was
measured as the highest in the Feslek Regulator (797.90 ± 274.25a mg/l), which is given
in Table 4. In all of the 8 stations, significant differences were determined in the annual pH levels (p < 0.05). TH was measured as the lowest (490.69 ± 234.90e mg/l) in 2013
and it was measured as the highest (655.52 ± 280.59a mg/l) in 2008. The yearly
[image:13.595.219.529.429.678.2]differ-ence was found to be statistically significant (p < 0.05) (Figure 12). Water quality was found to be Class I grade at the Adıgüzel Dam for the case of TDS values while Feslek
Figure 12. Change graphics of TH values in Büyük Menderes River during 2000-2013.
Regulator was found to be Class II grade.
3.9. SS (Suspended Solids)
Sophisticated concentrations of suspended solids can assist as carriers of toxics, which readily cling to suspended elements [13]. SS was measured as the lowest in the Yenice Regulator (1.14 ± 0.56d mg/l) and it was measured as the highest in the Feslek Regulator
(2.51 ± 1.42a mg/l), which is given in Table 4. In all of the 8 stations, significant
differ-ences were determined in the annual pH levels (p < 0.05). SS was measured as the low-est (1.17 ± 0.89e mg/l) in 2009 and it was measured as the highest (2.62 ± 1.10a mg/l) in
2000. The annual differences were found to be statistically significant (p < 0.05) (Figure 13). Therefore, SS value in all the years is compatible with the values proposed by TS 266 and WHO guidelines.
Figure 13. Change graphics of SS values in Büyük Menderes River during 2000-2013.
quality as compared to class III and thus it shouldn’t be utilized in any circumstance. The studied parameters are also compared with TS 266 and WHO guidelines [14][15].
3.10. Effect of Pollution on Fish
Knipowitschiacaucasica, Hemigrammocapoetakemali, Pseudophoxinusmaeandri,
Go-biomaeandricus, Esoxlucius, Gambusiaholbrooki, Tincatinca,
Oxynoemacheilusger-mencicus, Oxynoemacheilus cf. Cinicus, Cobitiscfsimplicispina,
Chondrostomamean-drense, Luciobarbuskottelati, Capoetacapoetabergamae, Ladigesocyprismermere and
Alburnoides cf. Smyrnaeare endemic species and have little tolerance to pollution in
water. The Buyuk Menderes River does not have many of these species.
Carassiusgibe-lio, Pseudorasboraparva and Lepomisgibbosus, which are endangered species, may
to-lerate pollution more than the abovementioned species. In this context, Carassiusgibe-lio is found plenty in this particular river (Table 1).
4. Conclusion
Furthermore, all activities in the basin must be organized and coordinated so that there is no overlap and also to create efficiency. Naturally, the pollution sources will need to be contained and an efficient control process will need to be implemented to ensure that this containment takes place in a proper manner. The parameters of water quality as well as biological indicators may be analyzed to identify the quality of the water in the river. The microscopic algae, zooplanktons, macro-invertebrates, and the macrophytes may be analyzed for this purpose. Only then can we obtain long-term results and pre-vent the negative influences of the pollution in water.
References
[1] Yanık, T. and Atamanalp, M. (2001) Introduction to Water Pollution in Aquaculture. Atatürk University Publications of Agricultural Faculty, Erzurum.
[2] Sönmez, A.Y., Hisar, O., Karataş, M., Arslan, G. and Aras, M.S. (2008) Water Information. Nobel Publication and Distribution, Ankara.
[3] Strobl, R.O. and Robillard, P.D. (2008) Network Design for Water Quality Monitoring of Surface Freshwaters: A Review. Journal of Environmental Management, 4, 639-648. https:/doi.org/10.1016/j.jenvman.2007.03.001
[4] Yegen, V., Balik, S., Bilcen, E., Sari, H.M., Uysal, R. and Yagci, A. (2008) Fish Species in Denizli City Rivers and Their Distribution in the Region. Journal of Fisheries Sciences, 2, 301-311.
[5] Güclü, S.S., Küçük, F., Ertan, Ö.O. and Güclü, Z. (2013) The Fish Fauna of the Büyük Menderes River (Turkey): Taxonomic and Zoogeographic Features. Turkish Journal of Fisheries and Aquatic Sciences, 13, 685-698.https:/doi.org/10.4194/1303-2712-v13_4_14 [6] APHA (2012) American Public Health Association, Standard Methods for the Examination
of Water and Wastewater. Washington DC.
[7] Rahman, A.K.M.L., Islam, M., Hossain, M.Z. and Ahsan, M.A. (2012) Study of the Seasonal Variations in Turag River Water Quality Parameters. African Journal of Pure and Applied Chemistry, 6, 144-148.
[8] USEPA (2006) Environmental Protection Agency of Ground Water and Drinking Water Standards and Risk Management Division. Distribution System Indicators of Drinking Water Quality. Pennsylvania Ave., NW Washington DC.
[9] Yilmaz, E. and Koc, C. (2014) Research on Water Quality of Lake Bafa in Turkey. En- vironmental Engineering and Management Journal, 13, 153-162.
[10] Cetinkaya, O. (2003) Water Quality. Yuzuncu Yıl University, Agricultural Faculty, Van, Turkey.
[11] Emre, Y. and Kürüm, V. (2007) Trout Breeding in Ponds and Cages. 2nd Edition, Posta Publishing, Istanbul.
[12] Klein, L. (1992) River Pollution: An Introductory Textbook. John Willey and Sons, New York.
[13] Ahmed, K., Das, M., Islam, M.M., Akter, M.S., Islam, S. and Al-Mansur, M.A. (2011) Physico-Chemical Properties of Tannery and Textile Effluents and Surface Water of River Buriganga and Karnatoli, Bangladesh. World Applied Sciences Journal, 12, 152-159. [14] Turkish Standars Institute (TSE) (2005) Water İntended for Human Consumption. TS 266,
Ankara. (İn Turkish)
Submit or recommend next manuscript to SCIRP and we will provide best service for you:
Accepting pre-submission inquiries through Email, Facebook, LinkedIn, Twitter, etc. A wide selection of journals (inclusive of 9 subjects, more than 200 journals)
Providing 24-hour high-quality service User-friendly online submission system Fair and swift peer-review system
Efficient typesetting and proofreading procedure
Display of the result of downloads and visits, as well as the number of cited articles Maximum dissemination of your research work
Submit your manuscript at: http://papersubmission.scirp.org/
![Table 1. The variety of fish types caught from past to present from the Büyük Menderes River [4] [5]](https://thumb-us.123doks.com/thumbv2/123dok_us/7816593.731003/3.595.190.552.86.707/table-variety-types-caught-present-buyuk-menderes-river.webp)