http://www.scirp.org/journal/fns ISSN Online: 2157-9458
ISSN Print: 2157-944X
Developing a Questionnaire for Prediction of
High Salt Intake Based on Salt Usage Behavior:
Analysis from Dietary Habits and
Urinary Sodium Excretion in Japan
Chika Horikawa1, Nobuko Murayama1, Eri Tochikura2, Emi Ishida2, Miyo Kojima2, Sumie Isobe2, Kazue Suzuki2, Kyoko Fueta3, Miyoko Kira4, Mizue Sasaya5, Misato Koide6, Asako Oyanagi7, Rika Yonekura8, Yae Iriyama9, Yumi Nakajima10, Chiho Hatano2, Junichi Horii2
1Department of Health and Nutrition, Faculty of Human Life Studies, University of Niigata Prefecture, Niigata, Japan 2Niigata Prefectural Government, Niigata, Japan
3Yuzawa Town Office, Yuzawa-machi, Japan 4Sado City Office, Sado, Japan
5Health and Sanitation Department, Public Health and Sanitation Center, City of Niigata, Niigata, Japan 6Gosen City Office, Gosen, Japan
7Sanjo City Office, Sanjo, Japan 8Mitsuke City Office, Mitsuke, Japan
9Department of Health and Nutrition, Faculty of Health Sciences, Niigata University of Health and Welfare, Niigata, Japan 10Murakami City Office, Murakami, Japan
Abstract
Salt reduction policies have been implemented throughout the world as well as in Japan. However, most of the current questionnaires for estimating salt intake are apt to be based on empirical evidence. This study was aimed to develop and validate a questionnaire for predicting high salt intake based on salt usage using dietary beha-viors that affect salt intake in cooperation with Niigata prefecture, Japan. The study was comprised of 760 participants aged 21 - 79 years (Men%: 49%) living in Niigata. Participants completed a questionnaire about dietary behaviors potentially relevant to salt intake. Second morning voiding urine for estimating dietary salt intake per day was collected on the same day. The relationship of estimated dietary salt intake to answers on the questionnaire was examined using analysis of covariance for age, gender, body mass index, and whether taking medication or not. Ten items on the questionnaire revealed an association with dietary salt intake per day: making oneself gorge on a meal, having ≥2 different staples per meal, having a 1-dish meal, number of simmered dishes per day, variety of pickled vegetables per day, having salt-cured fish eggs per day, quantity of soup consumed when eating noodles, preference for strong-tasting meals, frequency of eating out, and frequency of alcohol consumption.
How to cite this paper: Horikawa, C., et al.
(2017) Developing a Questionnaire for Pre- diction of High Salt Intake Based on Salt Usage Behavior: Analysis from Dietary Habits and Urinary Sodium Excretion in Japan. Food and Nutrition Sciences, 8, 1- 18.
http://dx.doi.org/10.4236/fns.2017.81001
Received: August 15, 2016 Accepted: December 6, 2016 Published: December 9, 2016
Copyright © 2017 by authors and Scientific Research Publishing Inc. This work is licensed under the Creative Commons Attribution International License (CC BY 4.0).
The current study identified 10 dietary behaviors that enabled the development of a salt intake questionnaire for identifying specific dietary behaviors for assessing re-gions and/or individuals when attempting to encourage salt reduction.
Keywords
Salt Intake, Dietary Behavior, Second Morning Voiding Urine, Urinary Sodium, Japanese
1. Introduction
There is conclusive evidence on the adverse effects of excessive dietary sodium con-sumption on blood pressure, and multiple observational studies showed clear correla-tions of sodium consumption with cardiovascular disease as well as a range of other conditions including gastric cancer, osteoporosis, cataracts, kidney stones, and diabetes [1]. Reduction in dietary salt intake is encouraged throughout the world. The World Health Organization aimed to achieve a target salt intake of less than 5 g/day and a mean reduction in salt intake of 30% by the worldwide population by 2025 [2]. Many individual countries are engaged in salt reduction policies [3]. In Japan, which faces the issue of high dietary salt intake compared with Western countries, the target for dietary salt intake was reduced from 9.0 to 8.0 g/day in men and from 7.5 to 7.0 g/day in women since the Dietary Reference Intakes for Japanese (2015) was issued [4].
Providing support for strengthening the dietary goal for salt intake is required for national salt reduction policies centered on enlightenment about traditional salty foods and cooking methods for salt reduction. The Japanese mean dietary salt intake was re-duced 3.0 g/day in 24 years; that is from 13.7 g/day in 1981 to 10.7 g/day in 2004 [5] [6]. On the other hand, the reduction rate of salt intake in the recent decade has been gra-dual: to 10.2 g/day in 2013 [7]. To reduce salt intake by Japanese to less than 10.0 g/day is unrealistic if there is not a sufficient salt restriction policy to enable regions and/or individuals to put knowledge about salty foods and cooking methods into practical ac-tion to reduce salt intake. Working relaac-tionships with public health nutriac-tionists and other professionals in prefectural and municipal governments, and university research-ers have been established in Niigata Prefecture since 2013, making it a particularly ad-vanced prefecture engaged in salt reduction in Japan. Surveys and analyses are ongoing to improve the efficacy of salt restriction policies, appropriate measures are planned through the Plan-Do-Check-Act cycle, and an effective program for salt restriction pol-icies is being developed [8].
the cooperation of Niigata prefecture, Japan, the aim of this study was to develop and validate a salt intake questionnaire that can allow the prediction of high salt intake based on salt usage in relation to dietary behavior.
2. Methods
The study was comprised of 760 participants, aged 21 - 79 years, living in Niigata Pre-fecture, Japan, and lead by a working group in Niigata prefecture that provided data analysis and made policy recommendations to create a nutrition policy and evaluation system. The protocol for the study, which is in accordance with the Declaration of Hel-sinki and the Ethical Guidelines for Clinical/Epidemiological Studies of the Japanese Ministry of Health Labor and Welfare, received ethical approval from the institutional review boards of all of the participating institutes. Written informed consent was ob-tained from all participants enrolled. The survey for participants was carried out in 2014, and within one day, participants completed a questionnaire regarding dietary ha-bits potentially relevant to salt intake and underwent collection of second morning voiding urine (SMU) and other assessments.
All participants completed the questionnaire on dietary behavior potentially relevant to salt intake. Construction of the questionnaire was based on the frequency of eating salty and other foods, and behaviors and attitudes related to salt intake cited from an empirical perspective gained from interviews with registered dietitians associated with public administrations or medical services. Content of the resultant questionnaire and possible responses are shown in Table 2.
SMU for estimating dietary salt intake per day was collected from participants. Esti-mated sodium excretion from SMU was validated with that of 24-h urinary (24HU) ex-cretion and the obtained formulas for 24-h urinary sodium exex-cretion (24HUNaV) were reported as follows [12]: 1) PRCr (mg/day) of men = 15.12 × weight (kg) + 7.39 × height (cm) − 12.63 × age (year) − 79.90, and PRCr (mg/day) of women = 8.58 × weight (kg) + 5.09 × height (cm) − 4.72 × age (year) − 74.95; and 2) estimated 24HUNaV (mEq/day) = 16.3 × (SMUNa/SMUCr × PRCr) 0.5; where PRCr = predicted value of 24HUCr, SMUNa = Na concentration in the SMU and SMUCr = creatinine concentra-tion in the SMU. There were reported high significant correlaconcentra-tions between the values estimated by 24HUNaV and Na measured by 24 h urine specimens for a 3-5 day period (r = 0.728, p < 0.001). Estimated 24HUNaV was calculated to reflect dietary salt intake by the following formula: dietary salt intake (g/day) = 24HUNaV (mg/day)/1000 × 2.54. A physical examination that included height, weight, and blood pressure measurements was conducted. A questionnaire was also used to determine smoking status and medi-cations used for hypertension, hyperglycemia, or hyperlipidemia.
3. Results
3.1. Characteristics of Participants
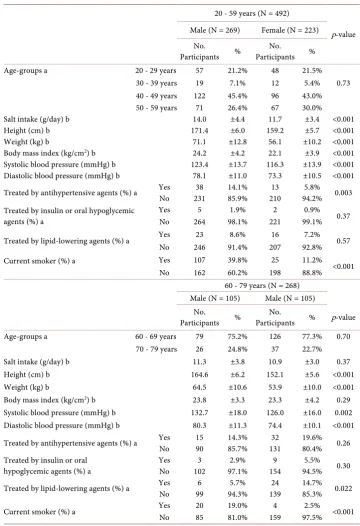
[image:4.595.192.553.195.722.2]Table 1 shows the characteristics of the 760 participants according to age and gender. Mean daily salt intake was 14.0 and 11.7 g in men and women, respectively, aged from 20 to 59 years (p < 0.001), and 11.3 and 10.9 g in men and women, respectively, aged 60
Table 1. Characteristics of participants who completed a questionnaire on dietary habits poten-tially relevant to salt intake and who underwent collection of spot urine.
20 - 59 years (N = 492)
p-value Male (N = 269) Female (N = 223)
No.
Participants %
No.
Participants % Age-groups a 20 - 29 years 57 21.2% 48 21.5%
30 - 39 years 19 7.1% 12 5.4% 0.73 40 - 49 years 122 45.4% 96 43.0% 50 - 59 years 71 26.4% 67 30.0% Salt intake (g/day) b 14.0 ±4.4 11.7 ±3.4 <0.001 Height (cm) b 171.4 ±6.0 159.2 ±5.7 <0.001 Weight (kg) b 71.1 ±12.8 56.1 ±10.2 <0.001 Body mass index (kg/cm2) b 24.2 ±4.2 22.1 ±3.9 <0.001
Systolic blood pressure (mmHg) b 123.4 ±13.7 116.3 ±13.9 <0.001 Diastolic blood pressure (mmHg) b 78.1 ±11.0 73.3 ±10.5 <0.001 Treated by antihypertensive agents (%) a Yes No 231 38 14.1% 85.9% 210 13 94.2% 5.8% 0.003
Treated by insulin or oral hypoglycemic agents (%) a
Yes 5 1.9% 2 0.9% 0.37 No 264 98.1% 221 99.1%
Treated by lipid-lowering agents (%) a Yes 23 8.6% 16 7.2% 0.57 No 246 91.4% 207 92.8% Current smoker (%) a Yes 107 39.8% 25 11.2%
<0.001 No 162 60.2% 198 88.8%
60 - 79 years (N = 268) Male (N = 105) Male (N = 105)
No.
Participants % Participants No. % p-value Age-groups a 60 - 69 years 79 75.2% 126 77.3% 0.70
70 - 79 years 26 24.8% 37 22.7% Salt intake (g/day) b 11.3 ±3.8 10.9 ±3.0 0.37 Height (cm) b 164.6 ±6.2 152.1 ±5.6 <0.001 Weight (kg) b 64.5 ±10.6 53.9 ±10.0 <0.001 Body mass index (kg/cm2) b 23.8 ±3.3 23.3 ±4.2 0.29
Systolic blood pressure (mmHg) b 132.7 ±18.0 126.0 ±16.0 0.002 Diastolic blood pressure (mmHg) b 80.3 ±11.3 74.4 ±10.1 <0.001
Treated by antihypertensive agents (%) a Yes 15 14.3% 32 19.6% 0.26 No 90 85.7% 131 80.4% Treated by insulin or oral
hypoglycemic agents (%) a Yes No 102 3 97.1% 2.9% 154 9 94.5% 5.5% 0.30 Treated by lipid-lowering agents (%) a Yes 6 5.7% 24 14.7% 0.022
No 99 94.3% 139 85.3% Current smoker (%) a Yes 20 19.0% 4 2.5% <0.001
to 79 years (p = 0.37). BMI, systolic blood pressure, and diastolic blood pressure in men were significantly higher than in women regardless of age. The prevalence of men treated by antihypertensive agents was significantly higher than women aged 20 to 59 years, but the prevalence was not significantly different between men and women aged 60 to 79 years (p = 0.003 and p = 0.26, respectively). Among participants aged 60 to 79 years, the percentage of women treated by lipid-lowering agents was higher than that of men (p = 0.022). There were no significant differences between men and women in the prevalence of participants using insulin or oral hypoglycemic agents at any age.
3.2. Dietary Salt Intake and Responses to the Questionnaire
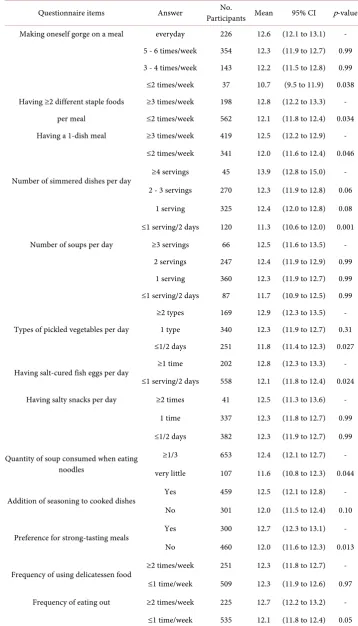
Table 2 shows dietary salt intake according to the responses to the questionnaire on di-etary behaviors potentially relevant to salt intake. Ten items on the questionnaire showed an association with dietary salt intake per day: making oneself gorge on a meal (everyday vs. ≤2 times/week: 12.6 and 10.7 g, p = 0.038), having ≥2 different staple foods per meal (≥ 3 vs. ≤2 times/week: 12.8 and 12.1 g, p = 0.034), having a 1-dish meal (≥3 vs. ≤2 times/week: 12.5 and 12.0 g, p = 0.046), number of simmered dishes per day (≥4 servings vs. ≤1 serving/2 days: 13.9 and 11.3 g, p = 0.001), types of pickled vegeta-bles per day (≥2 types vs. ≤1 type/2 days: 12.9 and 11.8 g, p = 0.027), having salt-cured fish eggs per day (≥1 time vs. ≤1 serving/2 days: 12.8 and 12.1 g, p = 0.024), quantity of soup consumed when eating noodles (≥1/3 vs. very little: 12.4 and 11.6 g, p = 0.044), preference for strong-tasting meals (yes vs. no: 12.7 and 12.0 g, p = 0.013), frequency of eating out (≥2 vs. ≤1 time/week: 12.7 and 12.1 g, p = 0.05), and frequency of alcohol consumption (daily, occasionally, and very infrequently: 13.1, 12.1, and 11.9 g, p = 0.018 (daily vs. occasionally) and 0.001 (daily vs. very infrequently), respectively).
3.3. Dietary Salt Intake and Responses to the Questionnaire by Age
Table 2. Dietary salt intake and responses to the questionnaire on dietary habits potentially rele-vant to salt intake.
Questionnaire items Answer Participants Mean No. 95% CI p-value
Making oneself gorge on a meal everyday 226 12.6 (12.1 to 13.1) - 5 - 6 times/week 354 12.3 (11.9 to 12.7) 0.99 3 - 4 times/week 143 12.2 (11.5 to 12.8) 0.99 ≤2 times/week 37 10.7 (9.5 to 11.9) 0.038 Having ≥2 different staple foods ≥3 times/week 198 12.8 (12.2 to 13.3) -
per meal ≤2 times/week 562 12.1 (11.8 to 12.4) 0.034 Having a 1-dish meal ≥3 times/week 419 12.5 (12.2 to 12.9) -
≤2 times/week 341 12.0 (11.6 to 12.4) 0.046
Number of simmered dishes per day ≥4 servings 45 13.9 (12.8 to 15.0) - 2 - 3 servings 270 12.3 (11.9 to 12.8) 0.06
1 serving 325 12.4 (12.0 to 12.8) 0.08
≤1 serving/2 days 120 11.3 (10.6 to 12.0) 0.001 Number of soups per day ≥3 servings 66 12.5 (11.6 to 13.5) -
2 servings 247 12.4 (11.9 to 12.9) 0.99 1 serving 360 12.3 (11.9 to 12.7) 0.99 ≤1 serving/2 days 87 11.7 (10.9 to 12.5) 0.99
Types of pickled vegetables per day
≥2 types 169 12.9 (12.3 to 13.5) - 1 type 340 12.3 (11.9 to 12.7) 0.31 ≤1/2 days 251 11.8 (11.4 to 12.3) 0.027
Having salt-cured fish eggs per day ≥1 time 202 12.8 (12.3 to 13.3) - ≤1 serving/2 days 558 12.1 (11.8 to 12.4) 0.024
Having salty snacks per day ≥2 times 41 12.5 (11.3 to 13.6) -
1 time 337 12.3 (11.8 to 12.7) 0.99
≤1/2 days 382 12.3 (11.9 to 12.7) 0.99
Quantity of soup consumed when eating noodles
≥1/3 653 12.4 (12.1 to 12.7) -
very little 107 11.6 (10.8 to 12.3) 0.044
Addition of seasoning to cooked dishes Yes 459 12.5 (12.1 to 12.8) - No 301 12.0 (11.5 to 12.4) 0.10
Preference for strong-tasting meals Yes 300 12.7 (12.3 to 13.1) - No 460 12.0 (11.6 to 12.3) 0.013
Frequency of using delicatessen food ≥2 times/week 251 12.3 (11.8 to 12.7) - ≤1 time/week 509 12.3 (11.9 to 12.6) 0.97
Frequency of eating out ≥2 times/week 225 12.7 (12.2 to 13.2) -
Continued
Whether trying to reduce salt intake trying actively 90 11.6 (10.8 to 12.4) - trying a little 308 12.4 (12.0 to 12.8) 0.50
not trying much 243 12.3 (11.8 to 12.8) 0.99
not trying at all 119 12.4 (11.7 to 13.1) 0.99
Use of dashi flavor, broth, or stock and the natural taste of food
trying actively 132 12.1 (11.5 to 12.8) -
trying a little 271 12.1 (11.7 to 12.6) 0.99
not trying much 233 12.7 (12.2 to 13.2) 0.93
not trying at all 124 11.9 (11.2 to 12.6) 0.99
Whether trying to have a meal consisting of a staple food,
main dish, and side dishes
trying actively 142 12.2 (11.5 to 12.8) -
trying a little 218 12.4 (11.9 to 12.9) 0.99
not trying much 303 12.3 (11.9 to 12.8) 0.99
not trying at all 97 12.1 (11.3 to 12.8) 0.99
Frequency of alcohol consumption daily 198 13.1 (12.6 to 13.7) - occasionally 216 12.1 (11.6 to 12.6) 0.018
≤1 serving/2 days 346 11.9 (11.5 to 12.3) 0.001
[image:7.595.198.553.432.735.2]Analyses were conducted by analysis of covariance for age, gender, BMI, and whether taking medicine or not (antihypertensive agents, insulin or oral hypoglycemic agents, or lipid-lowering agents).
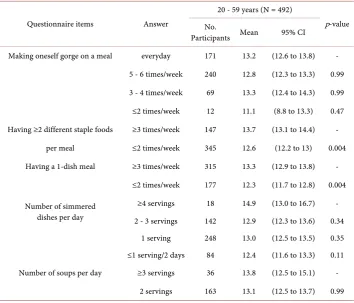
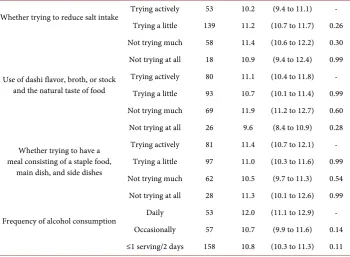
Table 3. Dietary salt intake and responses to the questionnaire on dietary habits potentially rele-vant to salt intake according to age.
Questionnaire items Answer
20 - 59 years (N = 492)
p-value No.
Participants Mean 95% CI
Making oneself gorge on a meal everyday 171 13.2 (12.6 to 13.8) -
5 - 6 times/week 240 12.8 (12.3 to 13.3) 0.99
3 - 4 times/week 69 13.3 (12.4 to 14.3) 0.99
≤2 times/week 12 11.1 (8.8 to 13.3) 0.47
Having ≥2 different staple foods ≥3 times/week 147 13.7 (13.1 to 14.4) -
per meal ≤2 times/week 345 12.6 (12.2 to 13) 0.004
Having a 1-dish meal ≥3 times/week 315 13.3 (12.9 to 13.8) -
≤2 times/week 177 12.3 (11.7 to 12.8) 0.004
Number of simmered dishes per day
≥4 servings 18 14.9 (13.0 to 16.7) - 2 - 3 servings 142 12.9 (12.3 to 13.6) 0.34
1 serving 248 13.0 (12.5 to 13.5) 0.35 ≤1 serving/2 days 84 12.4 (11.6 to 13.3) 0.11
Number of soups per day ≥3 servings 36 13.8 (12.5 to 15.1) -
Continued
1 serving 236 12.9 (12.4 to 13.4) 0.99
≤1 serving/2 days 57 12.1 (11.0 to 13.1) 0.23
Types of pickled vegetables per day
≥2 types 64 13.3 (12.3 to 14.2) -
1 type 220 13.1 (12.6 to 13.6) 0.99
≤1/2 days 208 12.7 (12.1 to 13.2) 0.90
Having salt-cured fish eggs per day
≥1 time 131 13.6 (13.0 to 14.3) -
≤1 serving/2 days 361 12.7 (12.3 to 13.1) 0.022
Having salty snacks per day ≥2 times 11 13.7 (11.4 to 16.1) -
1 time 232 12.8 (12.3 to 13.3) 0.99
≤1/2 days 249 13.1 (12.6 to 13.6) 0.99
Quantity of soup consumed when eating noodles
≥1/3 455 13.1 (12.7 to 13.4) -
Very little 37 11.3 (10.0 to 12.6) 0.011
Addition of seasoning to cooked dishes
Yes 355 13.0 (12.6 to 13.5) -
No 137 12.7 (12.0 to 13.4) 0.39
Preference for strong-tasting meals
Yes 215 13.3 (12.8 to 13.8) -
No 277 12.7 (12.2 to 13.1) 0.09
Frequency of using delicatessen food
≥2 times/week 199 13.2 (12.6 to 13.7) -
≤1 time/week 293 12.8 (12.4 to 13.3) 0.33
Frequency of eating out ≥2 times/week 190 13.6 (13.0 to 14.2) -
≤1 time/week 302 12.6 (12.1 to 13.0) 0.005
Whether trying to reduce salt intake Trying actively 37 12.8 (11.5 to 14.1) - Trying a little 169 13.1 (12.5 to 13.7) 0.42
Not trying much 185 12.8 (12.3 to 13.4) 0.36
Not trying at all 101 13.0 (12.2 to 13.8) 0.99
Use of dashi flavor, broth, or stock and the natural taste of food
Trying actively 52 12.7 (11.7 to 13.8) -
Trying a little 178 12.8 (12.2 to 13.4) 0.99
Not trying much 164 13.2 (12.6 to 13.8) 0.99
Not trying at all 98 12.9 (12.1 to 13.7) 0.99
Whether trying to have a meal con-sisting of a staple food, main dish,
and side dishes
Trying actively 61 12.3 (11.3 to 13.3) -
Trying a little 121 13.2 (12.5 to 13.9) 0.99
Not trying much 241 13.1 (12.6 to 13.6) 0.99
Not trying at all 69 12.7 (11.7 to 13.6) 0.99
Frequency of alcohol consumption
Daily 145 13.5 (12.9 to 14.2) -
Occasionally 159 12.9 (12.3 to 13.5) 0.46
Continued
60 - 79 years (N = 268)
Questionnaire items Answer Participants No. Mean 95% CI p-value
Making oneself gorge on a meal Everyday 55 11.5 (10.6 to 12.3) - 5 - 6 times/week 114 11.4 (10.8 to 12.0) 0.99
3 - 4 times/week 74 10.4 (9.7 to 11.2) 0.43
≤2 times/week 25 10.1 (8.8 to 11.3) 0.43
Having ≥2 different staple foods ≥3 times/week 51 10.5 (9.6 to 11.4) -
per meal ≤2 times/week 217 11.2 (10.7 to 11.6) 0.21
Having a 1-dish meal ≥3 times/week 104 10.6 (10.0 to 11.3) -
≤2 times/week 164 11.3 (10.8 to 11.8) 0.11
Number of simmered dishes per day
≥4 servings 27 12.2 (11.0 to 13.5) -
2 - 3 servings 128 11.3 (10.7 to 11.8) 0.91
1 serving 77 11.1 (10.4 to 11.8) 0.71
≤1 serving/2 days 36 9.2 (8.1 to 10.2) 0.002
Number of soups per day ≥3 servings 30 10.8 (9.6 to 12.0) -
2 servings 84 11.2 (10.5 to 11.9) 0.99
1 serving 124 11.0 (10.4 to 11.5) 0.99
≤1 serving/2 days 30 11.0 (9.8 to 12.2) 0.99
Types of pickled vegetables per day
≥2 types 105 11.9 (11.3 to 12.5) -
1 type 120 10.6 (10.1 to 11.2) 0.011 ≤1/2 days 43 10.0 (9.1 to 11.0) 0.006
Having salt-cured fish eggs per day
≥1 time 71 11.2 (10.4 to 11.9) - ≤1 serving/2 days 197 11.0 (10.5 to 11.4) 0.65
Having salty snacks per day ≥2 times 30 11.2 (10.0 to 12.3) -
1 time 105 11.3 (10.7 to 12) 0.99 ≤1/2 days 133 10.8 (10.2 to 11.3) 0.99
Quantity of soup consumed when eating noodles
≥1/3 198 11.1 (10.6 to 11.5) - Very little 70 10.9 (10.1 to 11.7) 0.66
Addition of seasoning to cooked dishes
Yes 104 11.2 (10.5 to 11.8) - No 164 10.9 (10.4 to 11.5) 0.59
Preference for strong-tasting meals
Yes 85 11.7 (11.0 to 12.4) - No 183 10.7 (10.2 to 11.2) 0.020
Frequency of using delicatessen food
≥2 times/week 52 10.0 (9.2 to 10.9) -
≤1 time/week 216 11.3 (10.8 to 11.7) 0.016
Continued
Whether trying to reduce salt intake Trying actively 53 10.2 (9.4 to 11.1) - Trying a little 139 11.2 (10.7 to 11.7) 0.26 Not trying much 58 11.4 (10.6 to 12.2) 0.30 Not trying at all 18 10.9 (9.4 to 12.4) 0.99
Use of dashi flavor, broth, or stock and the natural taste of food
Trying actively 80 11.1 (10.4 to 11.8) - Trying a little 93 10.7 (10.1 to 11.4) 0.99 Not trying much 69 11.9 (11.2 to 12.7) 0.60 Not trying at all 26 9.6 (8.4 to 10.9) 0.28
Whether trying to have a meal consisting of a staple food,
main dish, and side dishes
Trying actively 81 11.4 (10.7 to 12.1) - Trying a little 97 11.0 (10.3 to 11.6) 0.99 Not trying much 62 10.5 (9.7 to 11.3) 0.54 Not trying at all 28 11.3 (10.1 to 12.6) 0.99
Frequency of alcohol consumption Daily 53 12.0 (11.1 to 12.9) - Occasionally 57 10.7 (9.9 to 11.6) 0.14 ≤1 serving/2 days 158 10.8 (10.3 to 11.3) 0.11
Analyses were conducted by analysis of covariance for age, gender, BMI, and whether taking medicine or not (antihypertensive agents, insulin or oral hypoglycemic agents, or lipid-lowering agents).
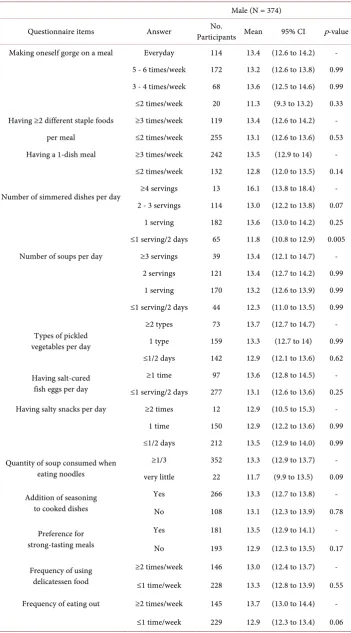
[image:10.595.199.550.87.344.2]3.4. Dietary Salt Intake and Responses to the Questionnaire by Gender
Table 4 shows the dietary salt intake and responses to the questionnaire according to gender. In 4 of the 10 items described above, the fewer times the participants of both genders engaged in the following dietary behaviors the lower their salt intake: making oneself gorge on a meal, having a 1-dish meal, types of pickled vegetables per day, and frequency of eating out. Significant correlations between dietary behavior and lower di-etary salt intake remained in male participants in 2 of 10 items: number of simmered dishes per day (≥4 servings vs. ≤1 serving/2 days: 16.1 and 11.8 g, p = 0.005) and fre-quency of alcohol consumption (daily vs. ≤1 serving/2 days: 14.1 and 12.4 g, p = 0.005). Among female participants significant associations remained in the following 4 of the 10 items: having two or more different staple foods per serving (≥3 vs. ≤2 times/week: 12.2 and 11.2 g, p = 0.011), having salt-cured fish eggs per day (≥1 time vs. ≤1 serving/2 days: 12.0 and 11.1 g, p = 0.023), quantity of soup consumed when eating noodles (≥1/3 vs. very little: 11.6 and 10.7 g, p = 0.038), and preference for strong-tasting meals (yes vs. no: 11.9 and 11.1 g, p = 0.021). Among female participants there was also a signifi-cant difference in dietary salt intake according to whether or not seasoning was added to cooked dishes (11.8 and 11.0 g, p = 0.014).
4. Discussion
Table 4. Dietary salt intake and responses to the questionnaire on dietary habits potentially rele-vant to salt intake according to gender.
Male (N = 374)
Questionnaire items Answer Participants Mean No. 95% CI p-value
Making oneself gorge on a meal Everyday 114 13.4 (12.6 to 14.2) - 5 - 6 times/week 172 13.2 (12.6 to 13.8) 0.99 3 - 4 times/week 68 13.6 (12.5 to 14.6) 0.99 ≤2 times/week 20 11.3 (9.3 to 13.2) 0.33 Having ≥2 different staple foods ≥3 times/week 119 13.4 (12.6 to 14.2) -
per meal ≤2 times/week 255 13.1 (12.6 to 13.6) 0.53 Having a 1-dish meal ≥3 times/week 242 13.5 (12.9 to 14) -
≤2 times/week 132 12.8 (12.0 to 13.5) 0.14
Number of simmered dishes per day ≥4 servings 13 16.1 (13.8 to 18.4) - 2 - 3 servings 114 13.0 (12.2 to 13.8) 0.07
1 serving 182 13.6 (13.0 to 14.2) 0.25 ≤1 serving/2 days 65 11.8 (10.8 to 12.9) 0.005 Number of soups per day ≥3 servings 39 13.4 (12.1 to 14.7) -
2 servings 121 13.4 (12.7 to 14.2) 0.99 1 serving 170 13.2 (12.6 to 13.9) 0.99 ≤1 serving/2 days 44 12.3 (11.0 to 13.5) 0.99
Types of pickled vegetables per day
≥2 types 73 13.7 (12.7 to 14.7) - 1 type 159 13.3 (12.7 to 14) 0.99 ≤1/2 days 142 12.9 (12.1 to 13.6) 0.62
Having salt-cured fish eggs per day
≥1 time 97 13.6 (12.8 to 14.5) - ≤1 serving/2 days 277 13.1 (12.6 to 13.6) 0.25 Having salty snacks per day ≥2 times 12 12.9 (10.5 to 15.3) -
1 time 150 12.9 (12.2 to 13.6) 0.99 ≤1/2 days 212 13.5 (12.9 to 14.0) 0.99
Quantity of soup consumed when eating noodles
≥1/3 352 13.3 (12.9 to 13.7) - very little 22 11.7 (9.9 to 13.5) 0.09
Addition of seasoning to cooked dishes
Yes 266 13.3 (12.7 to 13.8) - No 108 13.1 (12.3 to 13.9) 0.78
Preference for strong-tasting meals
Yes 181 13.5 (12.9 to 14.1) -
No 193 12.9 (12.3 to 13.5) 0.17
Frequency of using delicatessen food
≥2 times/week 146 13.0 (12.4 to 13.7) -
≤1 time/week 228 13.3 (12.8 to 13.9) 0.55
Frequency of eating out ≥2 times/week 145 13.7 (13.0 to 14.4) -
Continued
Whether trying to reduce salt intake
Trying actively 32 13.1 (11.5 to 14.6) - Trying a little 129 13.6 (12.9 to 14.4) 0.99 Not trying much 134 12.9 (12.1 to 13.6) 0.99 Not trying at all 79 13.2 (12.2 to 14.1) 0.99
Use of dashi flavor, broth, or stock and the natural taste of food
Trying actively 53 13.6 (12.4 to 14.7) - Trying a little 122 13.0 (12.2 to 13.8) 0.99 Not trying much 116 13.7 (12.9 to 14.5) 0.99 Not trying at all 83 12.6 (11.7 to 13.5) 0.99
Whether trying to have a meal consisting of a staple food,
main dish, and side dishes
Trying actively 48 12.6 (11.3 to 13.8) - Trying a little 101 13.7 (12.9 to 14.5) 0.78 Not trying much 163 13.3 (12.6 to 13.9) 0.99 Not trying at all 62 12.8 (11.7 to 13.8) 0.99
Frequency of alcohol consumption Daily 148 14.1 (13.4 to 14.7) - Occasionally 112 12.9 (12.1 to 13.7) 0.09 ≤1 serving/2 days 114 12.4 (11.6 to 13.2) 0.005
Female (N = 386)
Questionnaire items Answer Participants No. Mean 95% CI p-value
Making oneself gorge on a meal Everyday 112 11.7 (11.1 to 12.3) - 5 - 6 times/week 182 11.5 (11.0 to 11.9) 0.99 3 - 4 times/week 75 10.9 (10.1 to 11.6) 0.51 ≤2 times/week 17 10.4 (8.9 to 12.0) 0.78
Having ≥2 different staple foods ≥3 times/week 79 12.2 (11.5 to 12.9) -
per meal ≤2 times/week 307 11.2 (10.8 to 11.5) 0.011
Having a 1-dish meal ≥3 times/week 177 11.6 (11.1 to 12.1) -
≤2 times/week 209 11.2 (10.7 to 11.6) 0.18
Number of simmered dishes per day ≥4 servings 32 12.1 (11 to 13.3) - 2 - 3 servings 156 11.6 (11.1 to 12.1) 0.99
1 serving 143 11.1 (10.6 to 11.7) 0.69
≤1 serving/2 days 55 11.0 (10.1 to 11.8) 0.71
Number of soups per day ≥3 servings 27 11.8 (10.6 to 13) -
2 servings 126 11.4 (10.8 to 11.9) 0.99
1 serving 190 11.3 (10.9 to 11.8) 0.99
≤1 serving/2 days 43 11.2 (10.2 to 12.2) 0.99
Types of pickled vegetables per day
≥2 types 96 12.0 (11.3 to 12.7) -
1 type 181 11.3 (10.8 to 11.8) 0.26
Continued
Having salt-cured fish eggs per day ≥1 time 105 12.0 (11.4 to 12.6) - ≤1 serving/2 days 281 11.1 (10.8 to 11.5) 0.023 Having salty snacks per day ≥2 times 29 11.6 (10.4 to 12.8) -
1 time 187 11.6 (11.1 to 12.1) 0.99 ≤1/2 days 170 11.1 (10.6 to 11.6) 0.99
Quantity of soup consumed when eating noodles
≥1/3 301 11.6 (11.2 to 11.9) - Very little 85 10.7 (10 to 11.4) 0.038
Addition of seasoning to cooked dishes
Yes 193 11.8 (11.3 to 12.3) - No 193 11.0 (10.5 to 11.4) 0.014
Preference for strong-tasting meals Yes 119 11.9 (11.4 to 12.5) - No 267 11.1 (10.7 to 11.5) 0.021
Frequency of using delicatessen food ≥2 times/week 105 11.6 (11.0 to 12.2) ≤1 time/week 281 11.3 (10.9 to 11.7) 0.424 Frequency of eating out ≥2 times/week 80 11.7 (11.0 to 12.5) -
≤1 time/week 306 11.3 (10.9 to 11.6) 0.29
Whether trying to reduce salt intake Trying actively 58 10.5 (9.6 to 11.3) - Trying a little 179 11.3 (10.9 to 11.8) 0.44 Not trying much 109 11.9 (11.2 to 12.5) 0.05 Not trying at all 40 11.6 (10.5 to 12.6) 0.63
Use of dashi flavor, broth, or stock and the natural taste of food
Trying actively 79 10.8 (10.0 to 11.5) - Trying a little 149 11.3 (10.8 to 11.8) 0.99 Not trying much 117 11.9 (11.3 to 12.5) 0.11 Not trying at all 41 11.2 (10.3 to 12.2) 0.99
Whether trying to have a meal consisting of a staple food,
main dish, and side dishes
Trying actively 94 11.4 (10.7 to 12.1) - Trying a little 117 11.2 (10.6 to 11.8) 0.99 Not trying much 140 11.4 (10.9 to 12.0) 0.99 Not trying at all 35 11.5 (10.5 to 12.6) 0.99
Frequency of alcohol consumption Daily 50 12.2 (11.3 to 13.2) - Occasionally 104 11.3 (10.7 to 11.9) 0.28 ≤1 serving/2 days 232 11.2 (10.8 to 11.6) 0.14
Analyses were conducted by analysis of covariance for age, BMI, and whether taking medicine or not (antihy-pertensive agents, insulin or oral hypoglycemic agents, or lipid-lowering agents).
With the cooperation of Niigata prefecture, the current study revealed that 10 dietary habits were associated with dietary salt intake. These 10 items were within a question-naire for identification of high salt intake by assessing dietary behavior to improve strategies for salt reduction based on evidence.
vege-tables per day, having salt-cured fish eggs per day, quantity of soup consumed when eating noodles, preference for strong-tasting meals, frequency of eating out, and fre-quency of alcohol consumption. These items were based on an empirical perspective from interviews with registered dietitians having broad experience in health and nutri-tion policies. Thus, it can be said that the results of our study support current salt re-striction policies.
On the other hand, several items on the questionnaire showed no significant correla-tion between dietary salt intake and dietary habits. For example, there were no signifi-cant differences in dietary salt intake according to the number of times soup was con-sumed per day. Soup, especially miso (fermented soybean paste) soup, was originally an essential part of one’s meals in Japan and is a basic form of traditional Japanese cuisine [13] [14]. Dietary salt restriction policies for the past dozen years or so in Japan have focused on the reduction of the frequency of soup intake as one of the most important targets [8]. The number of times soup is consumed per day was consequently reduced, and our results surveyed in 2014 also showed that more than half of the participants had soup only once or less per day (Table 2). Based on the current study, further action is needed not only to reduce the frequency of soup intake but also to assess the actual salt content in soup and to provide education to reduce the salt concentration in soups.
Additionally, dietary attitudes were not associated with dietary salt intake, such as whether trying to reduce salt intake; use of dashi flavor, broth, or stock and the natural taste of food; and whether trying to have a meal consisting of a staple food, main dish, and side dishes. This finding reflects that knowledge and motivation for reducing salt intake are not effectively connected with concrete actions for salt reduction. It can be said that on the basis of our results, identification of regions and/or individuals with dietary behaviors related to high salt intake and appropriate education within those re-gions and of individuals is needed for further effective implementation of salt restric-tion policies.
When participants were divided into groups comprised of 20 to 59 year olds and 60 to 79 year olds, several items had different correlations with dietary salt intake accord-ing to the age group. High dietary salt intake was significantly related to the high fre-quency of having ≥2 different staple foods per meal, having a 1-dish meal, having salt-cured fish eggs, quantity of soup consumed when eating noodles, and frequency of eating out only in participants aged from 20 to 59 years, and in participants aged 60 to 79 years only, high frequency of simmered dishes, consuming many types of pickled vegetables per day and preferring strong-tasting meals were correlated with high dieta-ry salt intake.
and 20- to 59-year-old Japanese consume less than half the pickled vegetables con-sumed by those 60 to 79 years of age (7.1 and 14.7 g/day) [7]. Conversely, as for pro- cessed seafood products, the intake amount was increased from 9.8 g/day to 28.8 g/day over 64 years [7] [15], due to improvement of processing techniques for seafood [16]. These changes in dietary patterns in Japan may affect the strength of correlations be-tween dietary salt intake and consumption of salt-cured fish eggs and pickled vegetables according to the age group.
In addition, traditional Japanese cuisine like “ichiju san-sai (staple food, 1 main-dish, 2 side-dishes, and 1 soup)” has diminished with the times [13], and the tendency has been toward the spreading fast food industry [8] [17], observed by the increase in frequency of eating out, and the lack of cooking skills and nutrition knowledge by young adults [18] [19]. According to the annual report 2013 from the cabinet office, the percentage of Japa-nese having the staple food, main dish and side dish assortment almost every day is the lowest in their 20s (men: 25.7%, women: 51.0%), and the highest in their 70 s (men: 77.6%, women: 81.2%), and the prevalence of Japanese 20- to 59-year-olds eating out at least three times a week is over twice as much as that of 60-year-olds and above (9.5% vs. 3.3%) [18]. Therefore, it can be speculated that only participants aged from 20 to 59 years had a relationship between high dietary salt intake and having a 1-dish meal, including noodles because 1-dish meals are easy to cook and are provided by fast food industries, and the correlation between high dietary salt intake and high frequency of simmered dishes was shown only in participants aged from 60 to 79 years. The insufficient nutrition knowledge in young people may also be related to the high frequency of having ≥2 dif-ferent staple foods per meal, and tendency of inappropriate self-related dietary beha-viors; however, preference for strong-tasting meals is not related.
As mentioned above, creating salt restriction education that is responsive to the cha-racteristics of each generation is needed for acceptance by any generation. Further-more, to meet the needs of the prevailing food-service and food manufacturing indus-tries in modern society, it is necessary to establish government-led strategies to lessen the amount of salt in the environment, such as the Consensus Action on Salt & Health in the United Kingdom [20], which has been working to reach a consensus with the food industry and Government for reducing the amount of salt in processed foods [21].
program for salt reduction.
The present study had several limitations. First, the participants were all residents of Niigata prefecture. It is reported that many countries have regional differences in die-tary habits and nutritional intake [7] [23] [24] [25] including salt intake in Japan [26]. Additional research in other prefectures is of importance for nationwide salt reduction policies. Second, this study included only participants aged 20 years or older. A proper lifestyle, which includes proper dietary habits, is the basis for healthy status in child-hood and tends to persist throughout life [27] [28]. Further studies involving minors are required in the future. Another limitation is that estimated dietary salt intake was obtained from SMU [29]. However, estimated sodium excretion from SMU was vali-dated with that of 24-h urinary excretion with highly significant correlations (r = 0.728, p < 0.001) [12] and has reported use in a number of epidemiological studies [30] [31].
5. Conclusion
In conclusion, we clarified 10 items related to dietary behavior that were associated with dietary salt intake in cooperation with Niigata prefecture, Japan. These items may be used for developing an evidenced-based questionnaire that would indicate specific dietary behaviors that could achieve a reduction in salt intake and that could assess salt intake regionally and/or in individuals. Based on our current findings, identification of and education in regions and/or individuals with dietary habits related to high salt in-take, and further discussion and cooperation among public health nutritionists and other professionals in the government as well as university researchers are needed for practicing the Plan-Do-Check-Act cycle, which has a scientific basis, and development of an effective program for dietary salt reduction.
Acknowledgements
Study concept and design: Chika Horikawa, Nobuko Murayama.
Creation of questionnaire: EriTochikura, Emi Ishida, Miyo Kojima, SumieIsobe, Ka-zue Suzuki, Kyoko Fueta, Miyoko Kira, MiKa-zueSasaya, Misato Koide, AsakoOyanagi, Rika Yonekura.
Acquisition of data: Kyoko Fueta, Miyoko Kira, YaeIriyama, Yumi Nakajima. Analysis of data: Chika Horikawa, Nobuko Murayama.
Interpretation of data: Chika Horikawa, Nobuko Murayama, EriTochikura, Emi Ishida, Miyo Kojima, SumieIsobe, Kazue Suzuki, Kyoko Fueta, Miyoko Kira, MizueSa-saya, Misato Koide, AsakoOyanagi, Rika Yonekura, ChihoHatano, Junichi Horii.
Drafting of the manuscript: Chika Horikawa, Nobuko Murayama.
Critical revision of the manuscript for important intellectual content: ChihoHatano, Junichi Horii.
the data analysis. The authors declare that there is no conflict of interest associated with this manuscript.
References
[1] World Health Organization (2007) Reducing Salt Intake in Populations—Report of a WHO Forum and Technical Meeting. WHO Document Production Services, Geneva.
[2] World Health Organization (2013) Global Action Plan for the Prevention and Control of NCDs 2013-2020. WHO Document Production Services, Geneva.
[3] He, F.J. and MacGregor, G.A. (2009) A Comprehensive Review on Salt and Health and Current Experience of Worldwide Salt Reduction Programmes. Journal of Human
Hyper-tension, 23, 363-384. https://doi.org/10.1038/jhh.2008.144
[4] Ministry of Health, Labour and Welfare, Japan (2015) Overview of Dietary Reference In-takes for Japanese (2015).
http://www.mhlw.go.jp/file/06-Seisakujouhou-10900000-Kenkoukyoku/Overview.pdf
[5] Ministry of Health and Welfare, Japan (1983) The National Nutrition Survey in Japan, 1981. Ministry of Health and Welfare, Tokyo.
[6] National Institute of Health and Nutrition, Japan (2004) Outline of the National Health and Nutrition Survey Japan. http://www0.nih.go.jp/eiken/english/research/pdf/nhns2004.pdf [7] Ministry of Health, Labor and Welfare, Japan (2013) The National Health and Nutrition
Survey in Japan. http://www.mhlw.go.jp/bunya/kenkou/eiyou/dl/h25-houkoku.pdf [8] Murayama, N. (2015) Advocacy Activities at the Local Government Level: Establishing
So-dium Restriction Policies through Data Analysis and Plan-Do-Check-Act in Cooperation with Local Government. Japanese Journal of Health Education and Promotion, 23, 231-236. [9] Charlton, K.E., Steyn, K., Levitt, N.S., Jonathan, D., Zulu, J.V. and Nel, J.H. (2008)
Devel-opment and Validation of a Short Questionnaire to Assess Sodium Intake. Public Health
Nutrition, 11, 83-94. https://doi.org/10.1017/S1368980007000146
[10] Claro, R.M., Linders, H., Ricardo, C.Z., Legetic, B. and Campbell, N.R. (2012) Consumer Attitudes, Knowledge, and Behavior Related To Salt Consumption in Sentinel Countries of the Americas. Revista Panamericana de Salud Pública, 32, 265-273.
https://doi.org/10.1590/S1020-49892012001000004
[11] Lee, J.Y., Cho, D.S. and Kim, H.J. (2012) The Effect of Salt Usage Behavior on Sodium In-take and Excretion among Korean Women. Nutrition Research and Practice, 6, 232-237.
https://doi.org/10.4162/nrp.2012.6.3.232
[12] Kawasaki, T., Itoh, K., Uezono, K. and Sasaki, H. (1993) A Simple Method for Estimating 24 h Urinary Sodium and Potassium Excretion from Second Morning Voiding Urine Spe-cimen in Adults. Clinical and Experimental Pharmacology and Physiology, 20, 7-14.
https://doi.org/10.1111/j.1440-1681.1993.tb01496.x
[13] Kumakura, I. (2014) Washoku Joins UNESCO’s Intangible Cultural Heritage List. Food
Culture, 24, 3-5.
[14] Goto, K., Ominami, C., Song, C., Murayama, N. and Wolff, C. (2014) Globalization, Loca-lization and Food Culture: Perceived Roles of Social and Cultural Capitals in Healthy Child Feeding Practices in Japan. Global Health Promotion, 21, 50-58.
https://doi.org/10.1177/1757975913511133
[15] Ministry of Health and Welfare (1951) The National Nutrition Survey in Japan, 1951. Min-istry of Health and Welfare, Tokyo.
[16] Ministry of Health and Welfare (1958) The National Nutrition Survey in Japan, 1958. Min-istry of Health and Welfare, Tokyo.
Press, Stanford.
[18] Cabinet Office (2013) Shokuiku Promotion Policies: FY2012 (White Paper on Shokuiku). Shobi Printing Co., Government of Japan, Tokyo.
[19] Kishida, E., Masuzawa, Y., Shibuya, K., Kubo, K., Horikoshi, M., Nakanishi, Y., Naruse, A. and Hosotani, K. (2002) Questionnaire for Food and Nutrition Education Program Taking Account of the Learners’ Viewpoint-Leaming of Basic Cooking Focused on Younger Gen-eration and Middle-Aged Men. Journal of Home Economics of Japan, 53, 79-88.
[20] University of London (1999) Consensus Action on Salt and Health.
http://www.actiononsalt.org.uk/index.html
[21] He, F.J., Pombo-Rodrigues, S. and MacGregor, G.A. (2014) Salt Reduction in England from 2003 to 2011: Its Relationship to Blood Pressure, Stroke and Ischaemic Heart Disease Mor-tality. BMJ Open, 4, e004549. https://doi.org/10.1136/bmjopen-2013-004549
[22] Omori, K. (2003) Relationships between Knowledge, Cooking Technique, Self-Efficacy and Behavior for Healthy Eating among Japanese Senior High School Students. Journal of
Home Economics of Japan, 54, 993-1005.
[23] Hajjar, I. and Kotchen, T. (2003) Regional Variations of Blood Pressure in the United States Are Associated with Regional Variations in Dietary Intakes: The NHANES-III Data.
Jour-nal of nutrition, 133, 211-214.
[24] Perrin, A.E., Dallongeville, J., Ducimetière, P., Ruidavets, J.B., Schlienger, J.L., Arveiler, D. and Simon, C. (2005) Interactions between Traditional Regional Determinants and Socio- Economic Status on Dietary Patterns in a Sample of French Men. British Journal of Nutri-tion, 93, 109-114. https://doi.org/10.1079/BJN20041280
[25] Jelinić, J.D., Pucarin-Cvetković, J., Nola, I.A., Senta, A., Milosević, M., and Kern, J. (2009) Regional Differences in Dietary Habits of Adult Croatian Population. Collegium
Antropo-logicum, 33, 31-34.
[26] Tomonari, T., Fukuda, M., Miura, T., Mizuno, M., Wakamatsu, T.Y., Ichikawa, T., Miyagi, S., Shirasawa, Y., Ito, A., Yoshida, A., Omori, T. and Kimura, G. (2011) Is Salt Intake an Independent Risk Factor of Stroke Mortality? Demographic Analysis by Regions in Japan.
Journal of the American Society of Hypertension, 5, 456-462.
https://doi.org/10.1016/j.jash.2011.07.004
[27] Mikkila, V., Rasanen, L., Raitakari, T., Pietinen, P. and Viikari, J. (2005) Consistent Dietary Patterns Identified from Childhood to Adulthood: The Cardiovascular Risk in Young Finns Study. British Journal of Nutrition, 93, 923-931. https://doi.org/10.1079/BJN20051418
[28] McGowan, L., Cooke, L.J., Gardner, B., Beeken, R.J., Croker, H. and Wardle, J. (2013) Healthy Feeding Habits: Efficacy Results from a Cluster-Randomized, Controlled Explora-tory Trial of a Novel, Habit-Based Intervention with Parents. American Journal of Clinical
Nutrition, 98, 769-777. https://doi.org/10.3945/ajcn.112.052159
[29] McLean, R.M. (2014) Measuring Population sodium Intake: A Review of Methods.
Nu-trients, 6, 4651-4662. https://doi.org/10.3390/nu6114651
[30] O’Donnell, M.J., Yusuf, S., Mente, A., Gao, P., Mann, J.F., Teo, K., McQueen, M., Sleight, P., Sharma, A.M., Dans, A., Probstfield, J. and Schmieder, R.E. (2011) Urinary Sodium and Potassium Excretion and Risk of Cardiovascular Events. JAMA, 306, 2229-2238.
https://doi.org/10.1001/jama.2011.1729
[31] Mente, A., O’Donnell, M.J., Rangarajan, S., McQueen, M.J., Poirier, P., Wielgosz, A., Mor-rison, H., Li, W., Wang, X., Di, C., Mony, P., Devanath, A., Rosengren, A., Oguz, A., Za-tonska, K., Yusufali, A.H., Lopez-Jaramillo, P., Avezum, A., Ismail, N., Lanas, F., Puoane, T., Diaz, R., Kelishadi, R., Iqbal, R., Yusuf, R., Chifamba, J., Khatib, R., Teo, K., Yusuf, S. and PURE Investigators (2014) Association of Urinary Sodium and Potassium Excretion with Blood Pressure. New England Journal of Medicine, 371, 601-611.
Submit or recommend next manuscript to SCIRP and we will provide best service for you:
Accepting pre-submission inquiries through Email, Facebook, LinkedIn, Twitter, etc. A wide selection of journals (inclusive of 9 subjects, more than 200 journals)
Providing 24-hour high-quality service User-friendly online submission system Fair and swift peer-review system
Efficient typesetting and proofreading procedure
Display of the result of downloads and visits, as well as the number of cited articles Maximum dissemination of your research work
Submit your manuscript at: http://papersubmission.scirp.org/