Munich Personal RePEc Archive
An Introduction to the Natural Disaster
Vulnerability Evaluation Modeling
(NDVE-Modeling): Theory and
Application
Ruiz Estrada, M.A. and Park, D
University of Malaya
15 September 2011
Online at
https://mpra.ub.uni-muenchen.de/40561/
1
An Introduction to the Natural Disaster Vulnerability Evaluation
Modeling (NDVE-Modeling): Theory and Application
Keywords:
Natural disaster, Japan
JEL Code:
Q54,O40
Co-Author Corresponding Author
Dr. PARK Donghyun, Dr. Mario Arturo RUIZ Estrada, Principal Economist, Associate Professor and Researcher, Asian Development Bank (ADB), Faculty of Economics and Administration, 6 ADB Avenue, Mandaluyong City, Metro Manila, University of Malaya,
Philippines 1550. Kuala Lumpur 50603, [Tel] (63)26325825 [Tel] (60) 37967-3728 [Fax] (63) 26362342 [H/P] (60) 126850293
[E-mail] dpark@adb.org [E-mail] marioruiz@um.edu.my
2 Abstract
3
1. Introduction
The natural disasters can have a potentially large effect on economic growth but measuring
their economic impact is subject to a great deal of uncertainty. They impose both direct and
indirect costs, and those costs change and evolve over time. Natural disasters adversely affect
economic activity in the short run through a number of channels. For example, the Northeast
Japan earthquake and tsunami of March 2011 severely curtailed manufacturing output by
destroying power stations, production facilities, and transportation and other infrastructure.
Beyond the very short term, however, the negative economic impact of natural disasters tends to
fade. For example, in the Kobe earthquake of January 1995, the government’s reconstruction
spending spearheaded a robust recovery in private investment and consumption. As a result,
macroeconomic indicators recovered very quickly after an initial drop.
Given the potentially large effects of natural disasters on economic growth, it is important for
policymakers to have reasonably accurate estimates of those effects. However, this is difficult
given the high uncertainty surrounding the measurement of those effects. The motivation for this
paper comes from the large numbers of natural disasters which seem to be inflicting damage on
the world economy with growing frequency. Developing countries in particular are more
vulnerable to natural disasters due to weaker infrastructure and lack of anticipatory measures.
Developing Asia in particular accounted for 61% of global fatalities and 90% of all persons
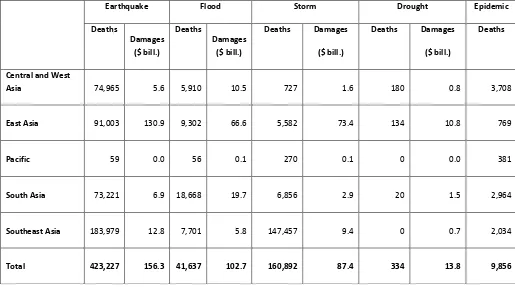
affected globally by natural disasters between 1970 and 2008. According to Table 1 shows the
fatalities and estimated damages from various types of natural disasters in developing Asia
between 2000 and 2010. The estimated damages imply a sizable negative economic impact on
the region.
4
The central objective of our paper is to set forth a model – the natural disasters vulnerability
evaluation modeling (NDVE-Modeling) – to evaluate the impact of natural disasters on GDP growth. The model is based on three basic indicators - (i) the natural disasters vulnerability
propensity rate (Ω); (ii) the natural disaster devastation magnitude rate (Π); and (iii) economic
desgrowth rate (δ). We look at different types of natural disasters that occurred around the world
between 1959 and 2011. To illustrate and illuminate the NDVE-Modeling, we apply it to assess the economic impact of the Northeast Japan earthquake and tsunamiwhich devastated Japan in
March 2011. For comparative purposes, we also apply the model to an earlier earthquake in
Japan which affected the Kobe region in January 1995. We hope that the NDVE-Modeling will contribute toward a more systematic and accurate measurement of the economic impact of
natural disasters.
2. The Natural Disasters Vulnerability Evaluation Modeling (NDVE-Modeling)
The natural disasters vulnerability evaluation modeling (NDVE-Modeling) assumes that any country is vulnerable to get a natural disaster anytime and anywhere. Hence, our world is in a
state of constant chaos. When this model is referring to a natural disaster, we are referring to any
event beyond human control that can generate a massive destruction anytime anywhere without
any advance warning. The quantification and monitoring of natural disasters is inherently
difficult, and we cannot evaluate and predict them with any degree of accuracy. In addition, this
NDVE-Modeling is useful for demonstrating how the GDP growth rate is directly connected to natural disasters events.
In the context of the NDVE-Modeling, we like to propose three new indicators - the natural disasters vulnerability propensity rate (Ω), natural disaster devastation magnitude rate (Π) and
the economic desgrowth rate (δ). These three indicators aim to simultaneously show the different
5
disasters vulnerability propensity rate (Ω), natural disaster devastation magnitude rate (Π) and
the economic desgrowth rate (δ) are based on the collection of historical data from different
natural disasters that have been suffered by any country, natural disasters are defined according
to certain intervals of time and the magnitude of destruction on material resources
(infrastructure) and non-material resources (human lives).
According to our model the analysis of any natural disasters from an economic point of view
need to take into account the production reduction (capital) and human capital mobility (labor)
simultaneously. In this part of this model we introduce a new concept is called “Economic Desgrowth (δ)”(Ruiz Estrada, 2011b). The economic desgrowth rate (δ) is defined as a leakage of economic growth due to any natural disaster. The main objective of the economic desgrowth
rate (δ) is to observe the final impact of any natural disaster on the final GDP growth rate
behavior over a certain period of time. The basic data used by the natural disasters vulnerability
evaluation modeling (NDVE-Modeling) is based on the uses of sixteen different possible natural disasters events. These include earthquake (β1); tsunami (β2); floods (β3); volcano eruption (β4);
typhoon (β5); fire pollution (β6); snow avalanches (β7); landslide (β8); blizzards (β9); cyclonic
storms (β10); Tornadoes (β11); epidemics (β12); droughts (β13); hailstorms (β14); sandstorm (β15);
and hurricane (β16) respectively. The quantification of each possible natural event is based on the
uses of intervals of probability between zero and one (see Expression 1).
ƒ(Xn+1) exist [0,1] X є Ω (1)
P(Xn+1) =
Σ
R+ є Xn6
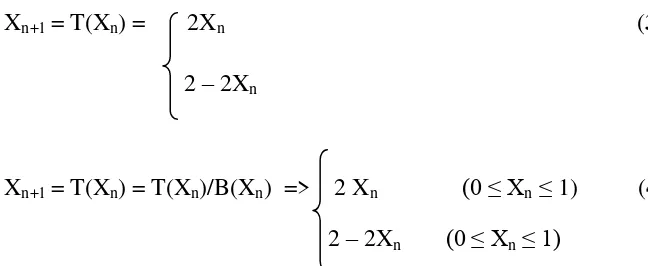
According to the NDVE-Modeling, we assume an irregular oscillation into different natural disasters events all the time. We do so by applying the simple rule of irregular series (Xn) as a
function of n according to James Gleick (1988) (see Expression 2).
Xn+1 = ƒ(Xn) (2)
It means that our world is going to be in permanent chaos under high risk to of a natural disasters
event anytime. The NDVE-Modeling allows for different magnitudes of destruction. Therefore, we have a large number of irregular series (Nagashima & Baba, 1992) under expression 3 and 4:
Xn+1 = T(Xn) = 2Xn (3)
2 – 2Xn
Xn+1 = T(Xn) = T(Xn)/B(Xn) => 2 Xn (0 ≤ Xn≤ 1) (4)
2 – 2Xn (0 ≤ Xn≤ 1)
The application of Xn+1 random intervals makes it possible for the NDVE-Modeling to analyze
unexpected results from different natural disasters events which cannot be predicted and
monitored with the traditional methods of linear and non-liner mathematical modeling. This is
because we assume at the very outset that our world is in a state of constant chaos. At the same
time, we are looking to include the Lorenz transformation assumptions (Lorenz, 1993) to
facilitate the analysis of our final result in this specific model.
a. The Natural Disaster Vulnerability Propensity Rate (Ω)
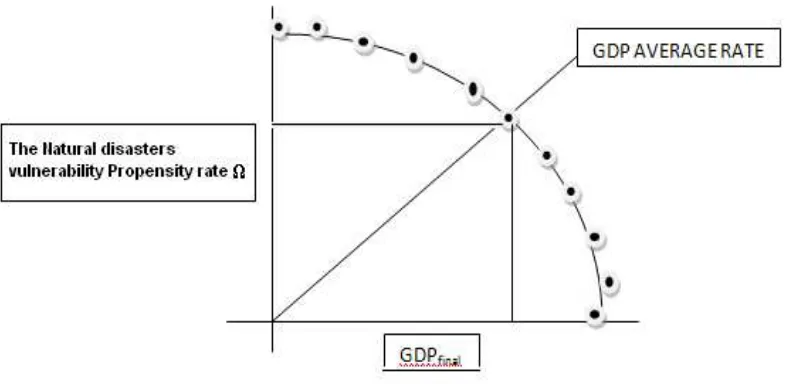
Initially, we need to assume that the construction of the natural disasters vulnerability
propensity rate (Ω) is directly connected to the GDP growth rate behavior (see Expression 5 and
Figure 1). We would also like to keep all the variables in the natural disasters vulnerability
[image:7.612.193.517.269.402.2]7
GDPn+1 = ƒ(Ωn) (5)
Ω є [0,1] (6)
Subsequently, the construction of the natural disasters vulnerability propensity rate (Ω) is based
on the application of expression 7. The final total of the natural disasters vulnerability propensity
rate (Ω) is always equal to 100%. Therefore, we apply a constant (k) of 6.25 to normalize the final result to 100%.
Ω= Σ[k(β1)+ k(β2)+ k(β3)+ k(β4)+ k(β5)+ k(β6)+ k(β7)+ k(β8)+ k(β9) + k(β10) + k(β11) +
k(β12)+ k(β13) + k(β14) + k(β15) + k(β16)] (7)
where βi represent the probability of any possible natural disaster event in a specific period of
time (t) according to 0 ≤βit ≤ 1. The natural disasters vulnerability propensity rate (Ω) includes a
total of sixteen possible natural disasters events (variables) that are following by earthquake (β1);
tsunami (β2); floods (β3); volcano eruption (β4); typhoon (β5); fire pollution (β6); snow
avalanches (β7); landslide (β8); blizzards (β9); cyclonic storms (β10); Tornadoes (β11); epidemics
(β12); droughts (β13); hailstorms (β14); sandstorm (β15); hurricane (β16) respectively. Hence, we
can simplify expression 6 by using expression 8.
∞ t
Ω= Σ βi(T/βi)K (8) i=0
Thus βi = {if βi є 0 ≤ βit ≤ 1} applies a constant of k= 6.25 (see Table 2). The evaluation of the
natural disasters vulnerability propensity rate (Ω) is based on three different levels of vulnerability:
Level 1: High vulnerability (red color alert): 1 - 0.75
Level 2: Average vulnerability (orange color alert): 0.74 – 0.34
8
However, in Figure 1 and Figure 2, it is possible to observe diminishing returns between the
GDP growth rate and the natural disaster vulnerability propensity rate (Ω). We can have three
possible scenarios of analysis in this relationship between GDP growth rate and the natural
disaster vulnerability propensity rate (Ω). First scenario, if the natural disaster vulnerability
propensity rate (Ω) is very high then the GDP growth rate became low. Second scenario, if the
natural disaster vulnerability propensity rate (Ω) is very low then the GDP growth rate became
high. Finally, the last scenario is when the natural disaster vulnerability propensity rate (Ω)
intercepts the GDP growth rate at a certain level and reaches some kind of an equilibrium. We
define this type of equilibrium as “Equilibrium Mediation”, The equilibrium mediation never keeps static but constantly keeps changing. Hence, we suggest the application of the Omnia
Mobilis assumption (Ruiz Estrada, 2010a) to keep the equilibrium mediation in the long run. It
changes according to changes in the natural disaster vulnerability propensity rate (Ω).
[INSERT FIGURE 1 AND FIGURE 2]
b. The Natural Disaster Devastation Magnitude (Π)
To calculate the natural disaster devastation magnitude rate (Π), we need to apply expression 9.
Π (Φ,Ψ) = [Φk(x+1)] + [ΨL(x+1)] (9)
9 c. The Economic Desgrowth (δ)
In the first instance, the measure of the economic desgrowth (δ) is based on the application of
partial derivatives in each possible natural disaster event probability between the present time
(this year) and the past time (last year) (see Expression 10).
Δβi = δβit+1 / δβit ≥ n where n = {-∞…,-1, 0, 1,…∞+} (10)
(β1)t+1/(β1)t (β2)t+1/(β2)t (β3)t+1/(β3)t (β1)t+4/(β1)t
-ΔΩ= (β5)t+1/(β5)t (β6)t+1/(β6)t (β7)t+1/(β7)t (β8)t+1/(β8)t
(β9)t+1/(β9)t (β10)t+1/(β10)t (β11)t+1/(β11)t (β12)t+1/(β12)t
(β13)t+1/(β13)t (β14)t+1/(β14)t (β15)t+1/(β15)t (β16)t+1/(β16)t (11)
Second, to measure the negative natural disaster vulnerability propensity matrix (–ΔΩ), we need
to find the determinant of a four by four matrix under the sixteen different possible natural
disasters events in our model (see Expression 11). Finally, the measurement of the economic
desgrowth (δ) is on the product of multiplying the negative natural disaster vulnerability
propensity matrix (–ΔΩ) and the present GDP growth rate (ΔGDP) (see Expression 12).
δ= ΔGDP x -ΔΩ (12)
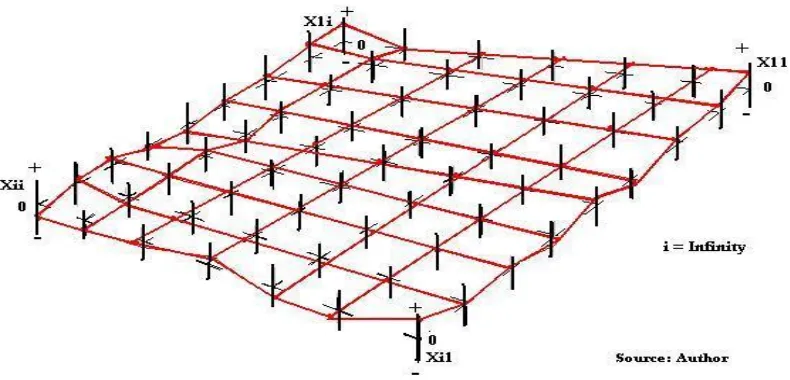
d. The Natural Disasters Vulnerability Surface (NDV-Surface)
The construction of the NDVE-Surface is based on the negative natural disaster vulnerability propensity rate (–ΔΩ) matrix results and the mega-surface coordinate space (see Expression 13
and Figure 3). The negative natural disaster vulnerability propensity rate (–ΔΩ) matrix is a four
by four matrix that contains the individual results of all sixteen variables (taken from Table 1).
10
vulnerability propensity matrix (–ΔΩ) to build a symmetric surface. When the negative natural
disaster vulnerability propensity rate (–ΔΩ) has strictly the same number of rows as the number
of columns, then the negative natural disaster vulnerability propensity rate (–ΔΩ) can always be
perfectly symmetric.
X1 X5 X9 X13
–ΔΩ = X2 X6 X10 X14 (13)
X3 X7 X11 X15
X4 X8 X12 X16
The final analysis of the NDV-Surface depends on any changes that this surface can experience in a fixed period of time.
[INSERT FIGURE 3]
3. The Natural Disasters Vulnerability Evaluation Modeling (NDV-Modeling):
Japanese case
Applying the NDVE-Modeling to the Japanese economy will give us a much better idea of how the model works. Before we do so, it is useful to have a look at general data about Japan such as
the contribution of each region to the final GDP of Japan and the geographical distribution of
Japanese industry. In terms of the geographical distribution of Japanese GDP, we find that
Hokkaido contributes around 8% of GDP. Honshu and Tohoku region contributes 18% and
Kanto and Chubu region contribute 39%, the highest share. The region with the second highest
contribution to Japan’s GDP is Kinki and Shikoku region with 28%. Therefore, the major
contributors to Japanese GDP are the Kanto and Chubu region and Kinki and Shikoku region,
which collectively account for 67% of Japanese output. Finally, the region of Kyushu region and
11
and Kinki and Shikoku also account for about 70% of Japanese industrial output, with the
remaining industrial output divided among the other regions. (see Figure 5)
[INSERT FIGURE 4 AND 5]
4. The Natural Disaster Vulnerability Propensity Rate (Ω)
In this section, we first examine the natural disaster vulnerability propensity rate for countries
around the world and then we take a closer look at Japan’s natural disaster vulnerability
propensity rate.
a. The World WideNatural Disaster Vulnerability Propensity Rate (Ω)
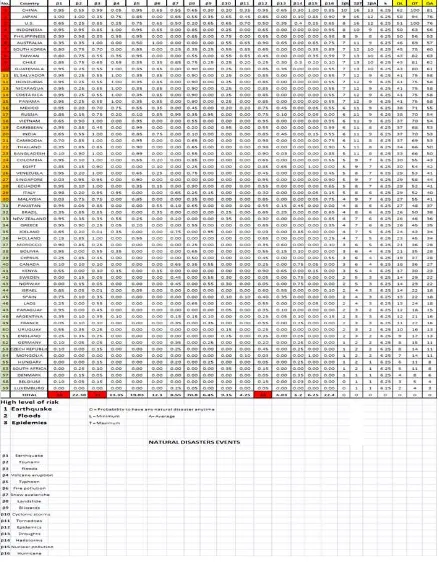
Table 2 shows the natural disaster vulnerability propensity rate (Ω) in 59 countries around the
world. The 59 countries show a wide range of probability of natural disaster event based on their
historical data. We use three different colors to classify countries according to their natural
disaster vulnerability propensity rate (Ω). Firstly, the red color represents high vulnerability, the
orange color represents medium vulnerability and the yellow color represents low vulnerability.
We can observe in Table 2 that the ten countries with the highest risk of natural disasters are
China; Japan; U.S.; Indonesia; Philippines; Australia; South Korea; Taiwan; Chile; Guatemala.
Figure 9 shows the natural disaster vulnerability surface for 5 countries – Japan, US, China,
Luxembourg and Guatemala. Therefore, Japan is among the top ten countries with the highest
natural disaster vulnerability propensity rate (Ω), to be more specific second highest according to
the list. On the other hand, countries such as Mongolia, Hungary, South Africa, Denmark,
Belgium and Luxemburg have the lowest natural disaster vulnerability propensity rate (Ω). This
means that according to historical data, they face lower risk of natural disaster than the other
12
[INSERT TABLE 2 AND FIGURE 9]
b. The Japanese Natural Disaster Vulnerability Propensity Rate (Ω)
In the case of Japan, we find large differences between the maximum and minimum of natural
disaster vulnerability propensity rate (Ω). According to historical data of natural disasters,
Hokkaido has the lowest vulnerability, with a minimum of only 0.01 and maximum of 0.15. In
the rest of Japan, the natural disaster vulnerability propensity rates are higher. More specifically,
vulnerability rate ranges from 0.25 to 0.75) in Honshu and Tohoku, 0.30 to 0.85 in Kanto and
Chubu region, from 0.25 to 0.95 in Kinki and Shikoku region, and from 0.20 to 0.85 in Kyushu
and Nansei region. (see Table 6).
[INSERT FIGURE 6]
In addition, we would like to compare the natural disaster devastation magnitude rate (Π)
between Kobe earthquake of 1995 and the Northeast Japan earthquake of 2011. We like to
estimate and compare the magnitude of the impact of those natural disasters on Japan.
According to our results the devastation resulting from the 1995 Kobe earthquake was
quite limited at 1.7%. But the devastation caused by the 2011 Northeast Japan earthquake
and tsunami was much larger at 35% according to our computations below. In Figure 7, we
can observe more clearly from a graphical perspective that the Northeast Japan earthquake
and tsunami caused a much larger devastation several times than the Kobe earthquake.
13 Kobe Earthquake of 1995:
Π1995 = 552 Km2/378,000 Km2 + 7,000/128.000,000
(0.0015) (0.000055) = 0.017 * 100% = -1.7%
Northeast JapanEarthquake and Tsunami of 2011:
Π2011 = 132,000 Km2/378,000 Km2 + 20,000/128.000,000
(0.35) (0.00016) = 0.35 * 100% = -35%
Natural disaster devastation magnitude rate of Kobe earthquake Π(1995) = 1.70%
Natural disaster devastation magnitude rate of Northeast Japan earthquake and Tsunami in 2011 Π(2011) = 35.00%
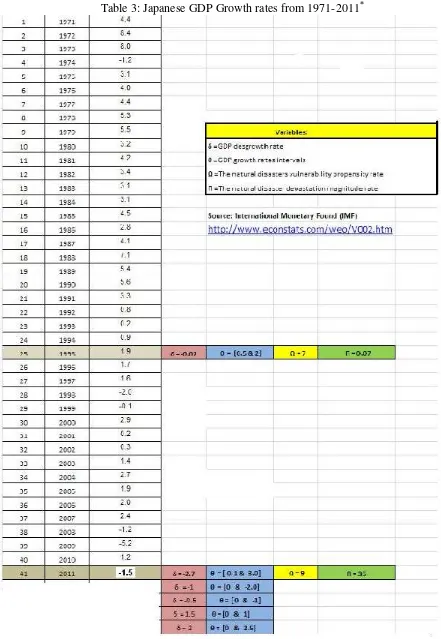
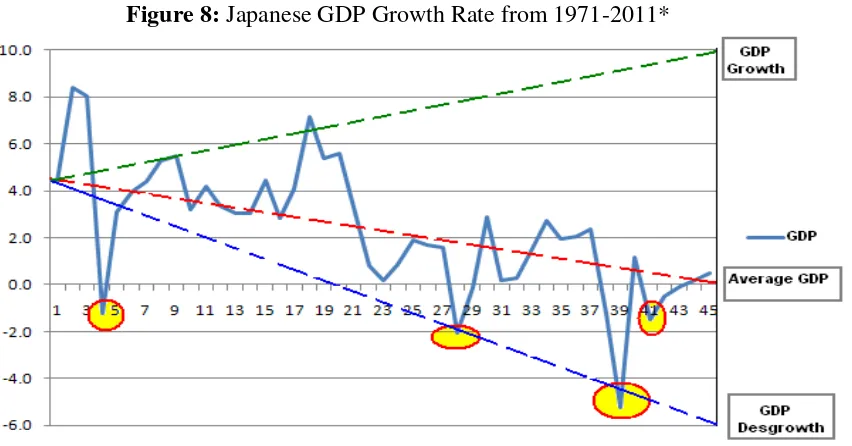
5. The Economic Desgrowth (δ)
Finally, to measure the impact of the earthquakes and tsunamis on economic growth, we
use the new concept of “Economic Desgrowth (δ)” introduced by Ruiz Estrada (2011b). According to the concept of economic desgrowth, we try to discover possible leakages that
can adversely affect GDP performance. Basically, this new concept assumes that in the
process of the GDP formation, leakages may arise due to different factors, in our case
natural disasters. According to our estimates, the economic desgrowth caused by the Kobe
earthquake is an impact of -0.02% on Japan’s GDP. Our estimates indicate that the
economic desgrowth caused by the Northeast Japan earthquake and tsunami of 2011 has
been much larger, at 2.7% in 2011. Therefore, economic growth is going to be between
-1.5% and 0% in 2011 according to our final results in table 3 and Figure 8.
14
6. Concluding Observations and Policy Implications
Natural disasters can have a significant negative impact on economic performance but measuring this impact with any degree of certainty is inherently challenging. In this paper, we propose a new model for evaluating the impact of natural disasters on economic performance. The natural disaster vulnerability evaluation modeling (NDVE-Modeling) is based on three indicators - (i) the natural disasters vulnerability propensity rate (Ω); (ii) the natural disaster devastation magnitude rate (Π); and (iii) economic desgrowth rate (δ). The
underlying intuition is that the economic impact of natural disasters depend on a country’s
vulnerability to natural disasters and the devastation caused by natural disasters, which jointly determine the leakage from economic growth and hence the impact on growth. We hope that our model will contribute to a better understanding of measuring the economic impact of natural disasters. The application of our model to two natural disasters in Japan – the Kobe earthquake of January 1995 and the Northeast Japan earthquake and tsunami of March 2011 – indicates that Northeast Japan will have a bigger impact on the Japanese economy than Kobe. The effects of the Northeast Japan earthquake and tsunami together are still being felt – for example, in the continuing power shortages – and it is too early to make a definitive assessment. Nevertheless, the immediate implication for Japanese policymakers is that they may need to stronger measures to support growth than they did in 1995. At a broader level, our results confirm that natural disasters can have a significant economic impact even in advanced countries with good infrastructure and high level of preparedness. The inescapable policy implication for developing countries, which tend to suffer the bulk of natural disasters, is that investing in anticipatory measures such as rigorous building codes, early warning systems and emergency response plans may yield sizable benefits in the medium and long term.
15
Bibliographic References
Gleick, J. (1988). Chaos: making a New Sciences, New York: Penguin Books Press. Lorenz, E. (1993). The Essence of Chaos, Washington: University of Washington Press. Nagashima, H. And Baba, Y. (1992). Introduction to Chaos, Tokyo: Baifukan Co. Ltd. Japan. Ruiz Estrada, M.A. (2011a). Policy Modeling: Definition, Classification and Evaluation. Journal of Policy Modeling. 33(3):523-536.
Ruiz Estrada, M.A. (2011b). The Economic Desgrowth. SSRN-Working Papers.
http://papers.ssrn.com/sol3/papers.cfm?abstract_id=1857277
Electronic References
Fire and Disasters Management Agency (FDMA) (2011). General reports. http://www.fdma.go.jp/en/
(accessed April, 2011)
Japan External Trade and Organization (JETRO) (2011a). White Book from 1999 to 2010.
http://www.jetro.go.jp/en/reports/white_paper/ (accessed April, 2011)
Japan External Trade and Organization (JETRO) (2011b). Japan International Trade in goods monthly. http://www.jetro.go.jp/en/reports/statistics/ (accessed April, 2011)
Japan External Trade and Organization (JETRO) (2011c). International trade and Investment.
http://www.jetro.go.jp/en/reports/white_paper/ (accessed April, 2011)
Japan External Trade and Organization (JETRO) (2011d). Foreign Direct Investment.
http://www.jetro.go.jp/en/reports/white_paper/ (accessed April, 2011)
Japan External Trade and Organization (JETRO) (2011e).Guidebook for export to Japan.
http://www.jetro.go.jp/en/reports/market/ (accessed April, 2011)
Japan External Trade and Organization (JETRO) (2011f). Survey and Reports in International trade.
http://www.jetro.go.jp/en/reports/survey/trade/ (accessed April, 2011)
Japan External Trade and Organization (JETRO) (2011g). Survey and Reports in FDI.
http://www.jetro.go.jp/en/reports/survey/fdi/ (accessed April, 2011)
Japan External Trade and Organization (JETRO) (2011h).Toward Reconstructions and Recovery.
http://www.jetro.go.jp/en/earthquake/ (accessed April, 2011)
International Monetary Found (IMF) (2011). Database. www.econstats.com/weo/v002.htm (accessed April, 2011)
16
http://www.meti.go.jp/english/earthquake/recovery/index.html (accessed April, 2011)
Ministry of Economy, Trade and Industry (METI) (2011b). White papers and reports.
http://www.meti.go.jp/english/report/index.html (accessed April, 2011)
Ministry of Economy, Trade and Industry (METI) (2011c). Analysis of all Industrial activities in Japan.
http://www.meti.go.jp/english/statistics/bunseki/index.html (accessed April, 2011)
Ministry of Economy, Trade and Industry (METI) (2011d). Inter-Regional Input-Output Table by Region. http://www.meti.go.jp/english/statistics/tyo/tiikiio/index.html (accessed April, 2011)
Ministry of Economy, Trade and Industry (METI) (2011e). Current Survey of Production.
http://www.meti.go.jp/english/statistics/tyo/seidou/index.html (accessed April, 2011)
The International Disasters Database (EM-DAT-CRED). Database. http://www.emdat.be/database
17
18
Table 1: Major Natural Disasters in Developing Asia, 2000-2010
Earthquake Flood Storm Drought Epidemic
Deaths Damages ($ bill.) Deaths Damages ($ bill.)
Deaths Damages
($ bill.)
Deaths Damages
($ bill.)
Deaths
Central and West Asia
74,965 5.6
5,910 10.5
727 1.6 180 0.8
3,708
East Asia
91,003 130.9
9,302 66.6
5,582 73.4 134 10.8
769
Pacific
59 0.0
56 0.1
270 0.1 0 0.0
381
South Asia
73,221 6.9
18,668 19.7
6,856 2.9 20 1.5
2,964
Southeast Asia
183,979 12.8
7,701 5.8
147,457 9.4 0 0.7
2,034
Total
423,227 156.3
41,637 102.7
160,892 87.4 334 13.8
9,856
Note: East Asia excludes Japan and Macao, China.
19
Table 2: Probability of Natural Disasters Events According to Historical Data from 1959 to 2011
Source: EM-DAT, the International Disaster Databases, Centre for Research on the Epidemiology of Disasters. (accessed April 2011).
20
21
[image:22.612.101.499.130.322.2]Figure 1: The Relationship between the Natural Disasters Vulnerability Propensity Rate (Ω) and the GDP Growth Rates
22
Figure 4: Contribution of each Japanese Region on the Final GDP (1999-2010)
Region
1 Hokkaido region 8%
2 Honshu region and Tohoku region 18%
3 Kanto region and Chubu region 39%
4 Kinki region and Shikoku region 28%
5 Kyushu region and Nansei region 7%
Total
100% Source: JETRO and METI
(accessed April 2011).
[image:23.612.104.499.98.288.2]23
Figure 5: Concentration of Japanese Industrial Input-Output (1999-2011)
Region
1 Hokkaido region 2%
2 Honshu region and Tohoku region 12%
3 Kanto region and Chubu region 45%
4 Kinki region and Shikoku region 35%
5 Kyushu region and Nansei region 6%
Total
100%
24
Figure 6: The Natural Disaster Vulnerability Propensity Rate by Region (Japan) 1959-2011
Region
Min. Max.
Hokkaido region 0.01 0.15
Honshu and Tohoku region 0.25 0.75
Kanto and Chubu region 0.30 0.85
Kinki and Shikoku region 0.25 0.95
Kyushu and Nansei 0.20 0.85
25
Figure 7: Natural Disaster Devastation Magnitude Rate between Kobe earthquake (1995) and Tsunami (2011)
Natural disaster devastation magnitude rate of Kobe earthquake
(Π1995) 1.70%
Natural disaster devastation magnitude rate of tsunami in 2011
(Π2011) 35.00%
Note: Final results from authors model
Figure 8: Japanese GDP Growth Rate from 1971-2011*
[image:26.612.107.533.422.645.2]26