Munich Personal RePEc Archive
Early warning indicator of economic
vulnerability
Wong, Shirly Siew-Ling and Puah, Chin-Hong and Abu
Mansor, Shazali and Liew, Venus Khim-Sen
Department of Economics, Faculty of Economics and Business,
Universiti Malaysia Sarawak
2012
Online at
https://mpra.ub.uni-muenchen.de/39944/
Early Warning Indicator of Economic Vulnerability
Shirly Siew-Ling Wong1, Chin-Hong Puah2, Shazali Abu Mansor3and
Venus Khim-Sen Liew4
Department of Economics, Faculty of Economics and Business, Universiti Malaysia Sarawak, 94300 Kota Samarahan, Sarawak, Malaysia.
1
shirlywong87@hotmail.com,2chpuah@feb.unimas.my,3mshazali@feb.unimas.my,
4
ksliew@feb.unimas.my.
Abstract
The initiative to capture the information content behind the rise and fall of the
business cycle has popularized the study of leading indicators. Many of the
foreign experiences shared by economically advanced countries reveal that the
leading indicator approach works well as a short-term forecasting tool. Thus,
exploring an indicator-based forecasting tool for business cycle analysis and
economic risk monitoring would provide insight into the Malaysian economy as
well as that of other emerging countries. By extending the ideology of indicator
construction from the US National Bureau of Economic Research (NBER), the
present study demonstrated the strong potential of the leading indicator approach
to be a good gauge of the business cycle movement in addition to being a
practical and functional early warning indicator for economic vulnerability
prediction.
Keywords: Business Cycle, Composite Leading Indicator, Early Warning Indicator
1.0 INTRODUCTION
Malaysia stands well-off as one of the emerging countries while making significant
headway toward a globalized and liberalized world, and its economy is unsurprisingly
open to historic external influences and, consequently, conveys immense risk and
uncertainty to the domestic market. Since economic risk and uncertainty are intrinsic and
ever present, attempts to stop their inbursts are not feasible in reality. However, failure to
foresee their arrival and make all attempts to minimize their potential danger may
significantly depress the health of the economy. Also, the adverse impact and the cost of
economic contraction, if not properly addressed and minimized, will likely deepen and
spillover to other neighboring markets. In this regard, the Asian financial crisis of
1997-1998 and the sub-prime mortgage crisis of 2008-2009, on top of other unpleasant
economic phenomena, have provided a down-to-earth lesson to the world, especially to
those countries with the most seriously affected economies.
The harshness of the past crises, especially the two mentioned above, has created
awareness among all countries of the importance of enhancing economic risk
management. As a result, cyclical analysis in the tradition of Mitchell and Burns (1938)
andBurns and Mitchell (1946)has been expanding rapidly with the aim of shedding light
on the underlying facts behind economy-wide fluctuations. Studies of this nature are
commonly referred to as business cycle forecasting, and indicator approaches
commenced by the US National Bureau of Economic Research (NBER) have been in the
forefront of business cycle forecasting for decades. The popularity and credibility of the
foreshadow the changing economic scenario in the near future due to its inherent leading
nature against the business cycle.1
In a real economic setting, it makes great sense to interpret the implicit facts behind the
movement of a set of leading economic indicators to obtain insightful information on the
current performance of the economy in addition to permitting notable projections
regarding the future economic direction. Phillips (1998) agreed that monitoring the
economic variables that tend to be sensitive to cyclical changes no matter what their
causes is a viable forecasting approach to predicting recessions and expansions. In this
instance, the intrinsic leading feature makes the leading indicator a functional early
warning tool to signal forthcoming economic vulnerability. As such, the indicator-based
forecasting tool is not merely used to forecast movement in the general economic activity,
but also serves as a crisis alarm given the ability of the indicator to signal vulnerable
episodes in advance. Attempts to build a resilient forecasting system will be of value to
all economic agents, including policymakers, business players, investors, and the general
public. Consequently, development of an early warning indicator (EWI) capable of
assessing impending economic dangers is of great interest in macroeconomic and
business cycle forecasting because it would provide an opportunity to moderate the
severity of any unwelcome economic event.
1
Accordingly, the present study sought to establish an empirically and practically useful
EWI capable of offering early signals of critical turning points in the business cycle. The
results are intended to aid economic agents in staying alert to the future direction of an
economy and to respond promptly to changing economic scenarios and upcoming
economic dangers. The practical implementation of the EWI is especially important to
national policymakers and central banks because economic policy by its nature requires a
high degree of foresight to be effective. The rationale is that policy typically plays its role
after a certain lag time. Hence, the key policy objective of macroeconomic stabilization
may not be achievable if the policy action is not implemented in a timely manner to
ensure that a weakening economic position does not translate into a serious crisis or
downturn. Thus, closely scrutinizing the rise and fall in economic activity through an
EWI is important in creating and implementing responsive stabilization and adjustment
policies.
Seeing that the development of EWI provides a sizable benefit to its potential users with
respect to macroeconomic risk management and vulnerability anticipation, we perceived
a vital role of EWI in the Malaysian economy in the contemporary and dynamic
economic environment. Therefore, the exploration into a resilient early signal tool to
identify economic vulnerability is an important endeavor for the Malaysian economy
because the ability to monitor and manage arising risks and uncertainties in the economy
is yet to be enhanced despite currently available practices.2In addition, building a sound
forecasting tool for accurate short-term prediction is worthwhile in confronting the
2
diminishing capability of existing economic indicators as early signaling tools due to
false signals and lead times, as reported byYap (2009). Also, a study presented byWong,
Abu Mansor, Puah, and Liew (2012) provided evidence of the diminishing lead time
offered by the existing composite leading indicator (CLI).
All in all, the main objective of this study was to construct a novel EWI for the Malaysian
economy with the aim of providing notable future projections of any vulnerable
economic situation and a macroeconomic risk-monitoring tool. The constructed EWI was
expected to outperform the currently available indicator-based forecasting instruments in
terms of ability to lead the business cycle and predictive power in directional accuracy.
This paper is organized into sections, as follows. The next section provides a review of
related literature followed by a brief description of the data and reference series selection.
The subsequent section covers methodological aspects of the study and presentation of
empirical findings with interpretations, while the final section provides the conclusion.
2.0 REVIEW OF LITERATURE
Despite the challenging task of analyzing and predicting the business cycle under an
intrinsically dynamic economic environment, continuous evolution in business cycle
forecasting is taking place over time. Endless research on this agenda has contributed
countless articles to sustain the practical significance of business cycle forecasting in
indicator-based forecasting tool for business cycle analysis became reality, the practice diffused
promptly into other economies. However, most of the empirical study of this nature has
concentrated on industrialized or economically advanced economies (see, for example,
Herrera & Garcia (1999); Bodart, Kholodilin, & Shadman-Mehta (2003); Kholodilin &
Siliverstovs (2005), and Schirwitz (2009)). Literature in this domain is fairly scarce for
emerging economies where the construction and application of indicator-based
forecasting is quite a recent practice in macroeconomics forecasting.
As far as this study is concerned, the noteworthy research on business cycle analysis
carried out specifically for emerging economies includes Everhart and Duval-Hernandez
(2001), Zhang and Zhung (2002), Jaya, Bhupal, and Rajeev (2003), Atabek, Coşar, and
Şahinöz (2005), Bascos-Deveza (2006), Bordoloi and Rajesh (2007), Zalewski (2009),
andIssler, Notini, and Rodrigues (2011). For the Mexican economy,Everhart and
Duval-Hernandez (2001) constructed a CLI following the Organization for Economic
Cooperation and Development’s (OECD’s) indicator compilation procedure. They
concluded that the Hodrick-Prescott (HP) filter developed byHodrick and Prescott (1980)
contributed fairly well in cycle extraction and that the constructed indicator met their
research objective of building an indicator of economic activity for business cycle
forecasting. Alternatively,Jaya, Bhupal, and Rajeev (2003)used the band pass (BP) filter
to construct a business cycle indicator under the growth cycle approach for the Indian
economy. That study showed that the constructed indicator could predict the cyclical
turning points six months ahead of the reference series - the Index of Industrial
Meanwhile, Zhang and Zhuang (2002) employed the sequential probability model
proposed byNeftci (1982)to build up a system of leading indicators for Malaysia and the
Philippines. The predictive power evaluation based on the Quadratic Probability Score
(QPS) proposed by Diebold and Rudebusch (1989) indicated that the constructed
indicator performed better than non-indicator-based forecasting models, suggesting that
the composite indicator could be a useful predictor of economic activity. Then,
Bascos-Deveza (2006) added to the literature on indicator construction and business cycle
analysis for the Philippines. Following a rules-based approach proposed byArtis,
Bladen-Hovell, and Zhang (1995)in turning points detection, both studies byZhang and Zhuang
(2002)andBascos-Deveza (2006)consistently illustrated that the leading indicator works
well in tracing the turning points in the business cycle for the Philippines. Using a
combination of QPS evaluation and the Granger causality test as an approach to
component series selection, Issler, Notini, and Rodrigues (2011) computed a CLI for the
Brazilian economy. The proposed CLI forecasts correctly the economic activity
represented by the coincident index up to 90% of the time.
Moreover, Atabek, Coşar, and Şahinöz (2005) constructed a CLI for the Turkish
economy based on the growth cycle approach, taking the IIP as the reference series. The
study showed that the constructed CLI leads IIP and movements in IIP were predicted
correctly with no false turning point. Both in-sample and out-sample forecast evaluations
demonstrated that the constructed CLI has significant power to predict the IIP. Taking a
different approach, Bordoloi and Rajesh (2007) applied the probit model to forecast the
that the model-based leading indicator is capable of predicting all the turning points in IIP
and satisfactorily portrays forecasting performance as shown by recursive probabilities
estimation. Furthermore, the yield on Treasury bills was found to be a best potential
leading indicator for business cycle forecasting.
3.0 DESCRIPTION OF DATA AND REFERENCE SERIES SELECTION
For the purpose of EWI construction, a bundle of macroeconomic and financial series
that has certain desirable properties of a business cycle indicator as documented by the
Conference Board (2000, p. 14) and OECD (2001, p. 3) was selected for empirical
examination.3This was to ascertain the inherent nature of each series in relation to the
business cycle. To reach the goal of building an early warning tool to signal critical
turning points in the Malaysian business cycle, only economic series with leading
characteristics were selected for inclusion in construction of the EWI. Correlation
analysis and visual inspection were utilized to facilitate the selection of the component
series. It was crucial to have a component series highly correlated with the business cycle
because evidence of correlation denotes that the selected component series possesses a
significant interrelationship with the business cycle. This was a necessary condition to
ensure the likelihood of the EWI working well in tracing the business cycle. Hence, series
that did not show significant correlation were dropped from the analysis, and ultimately
only six component series (domestic share price, share price in US, total exportation,
3
money supply, number of new companies registered, and number of tourists’ arriving)
made up the EWI construction in this study.
Given that the selection of business cycle representation does not tie to a universal
proposition (European Central Bank, 2001), appropriate selection accounts for the
common practice in business cycle literature as well as the nature of the economy and the
representativeness of the selected proxy. In this study, we adopted the real gross domestic
product (GDP) as a representation of business cycle or general economic activity in
Malaysia. The rationale was that the real GDP is a broad-based and ideal representation
of the Malaysian business cycle as it covers a wide range of economy activity and
sufficiently reflects each of the real economic sectors in the country. This is consistent
with the NBER routine but distinct from the OECD’s and the Department of Statistics
Malaysia’s (DOSM’s) approaches of using IIP and the self-built coincident index (CCI),
respectively, as the reference series in their business cycle analysis. Du Plessis (2006),
who analyzed the business cycle for a group of emerging markets consisting of Hong
Kong, Israel, Korea, Mexico, Peru, the Philippines, and South Africa, also employed the
real GDP as the reference series.
To obtain series with higher frequency, the interpolation technique proposed byGandolfo
(1981)was applied and the ratio of GDP to consumer price index (CPI) was calculated to
transform the GDP series into its real term. The monthly series of CPI and quarterly
series of GDP were extracted from various issues of theInternational Financial Statistics
currently available monthly data of CLI from 1981 through 2009 were compiled from
various issues of Malaysian Economic Indicators published by the DOSM. The CLI
functioned as a competing model in the evaluation of predictive accuracy and forecasting
performance of the constructed EWI.
4.0 METHODOLOGY AND EMPIRICAL DISCUSSION
The EWI construction involved a step-by-step procedure of indicator-based ideology first
introduced by the US NBER during 1930s. The composite indicator compilation
procedure outlined by theConference Board (2000)was applied to construct the EWI for
the Malaysian economy. After the construction of the EWI, the index was then
transformed into a growth cycle based on the procedure proposed by Moore and
Zarnowitz (1986). The rationale behind using the growth cycle approach was that we
intended to study the growth rate of the Malaysian business cycle instead of the classical
business cycle or business cycle in its level form.4The justification was that the level
form of the business cycle conception is less applicable to the Malaysian scenario as the
economy does not suffer from major oscillation in the level of general economic activity,
but experiences fluctuations in the growth rates of economic activity (Ahmad, 2003, p. 3).
Therefore, measuring the business cycle by estimating the deviation of economic activity
from its long-term trend was more appropriate for the Malaysian context.5
4
The business cycle conception of growth cycle and classical cycle has different interpretations. For the former, contraction means a slowdown or an absolute decline in economic activity in the growth cycle approach. However, for the latter, contraction involves only absolute decline or recession.
5
To obtain a smoothed cyclical component of the reference series for turning point
analysis, this study followed the procedure suggested by Moore and Zarnowitz (1986).
First, seasonal adjustment using Tramo/Seats methods were applied to eliminate the
seasonal factor. Then, the seasonally adjusted series was subjected to detrending using
the HP filter to obtain a smooth estimate of the long-run trend components of real GDP.
The HP filter is a widely applied detrending framework used to decompose the seasonally
adjusted time series into trends and to provide smoothed trends to minimize problems.
The HP filter was first employed by Hodrick and Prescott in the early 1980s to study the
business cycle for the US during the postwar period. The HP filter is a commonly applied
technique for extracting the cyclical component in business cycle analysis. Recent studies
in business cycles, including Everhart and Duval-Hernandez (2000), Kranendonk,
Bonenkamp, and Verbruggen (2005),Bascos-Deveza (2006),Klucik and Haluska (2008),
Zalewski (2009),Polasek (2010), and many more, have opted for the HP filter for cycle
extraction.
Next, we applied the method of simple centered moving average to smooth out
irregularities. This is one of the smoothing techniques adopted and suggested by Zhang
and Zhuang (2002). According to those authors, a moving average length of seven
months is appropriate for the case of Malaysia. However, the present study employed a
moving average length of five months since this was empirically sufficient to smooth out
the irregularities within the sample period. Finally, following most of the non-parametric
business cycle studies reported in the literature, the Bry-Boschan technique was used to
series. To ensure consistency, a similar procedure was applied to yield a smoothed
cyclical component of the EWI. The performance of the EWI in predicting critical
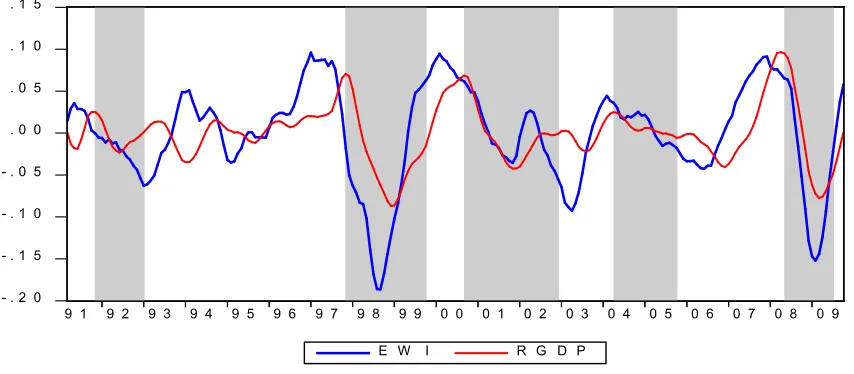
scenarios in the Malaysian business cycle from 1991 through 2009 is presented in Figure
1. The important episodes that resulted from the outbreak of critical economic downturns
and crises are indicated by the shaded area.
- . 2 0 - . 1 5 - . 1 0 - . 0 5 . 0 0 . 0 5 . 1 0 . 1 5
9 1 9 2 9 3 9 4 9 5 9 6 9 7 9 8 9 9 0 0 0 1 0 2 0 3 0 4 0 5 0 6 0 7 0 8 0 9
[image:13.612.96.523.242.429.2]E W I R G D P
Figure 1: EWI versus RGDP, January 1991 through December 2009
On the whole, Figure 1 shows that the movement of the EWI is relatively consistent with
the movement of the business cycle represented by real GDP. The traced peaks and
troughs from turning point analysis are fairly consistent with the historical profile of the
Malaysian business cycle. Moreover, from Figure 1, it is obvious that the EWI moves in
advance of real GDP most of the time and that the turning points in EWI frequently
appear a few months earlier than the turning points in real GDP. The visual evidence
presented in Figure 1 suggests that the constructed EWI successfully traced most of the
2009. Furthermore, the remarkable lead times shown by the EWI fulfilled the aim of
building an EWI to signal vulnerable turning points in the Malaysian business cycle.
In recent years, testing the directional accuracy of macroeconomic forecasts has received
increased attention in the field of forecasting because unreliable forecasts make no sense
to users. In addition, only large predicted change is useful to forecast users(Greer, 2003).
Hence, we applied directional accuracy testing in the present study to investigate whether
the EWI accurately predicted the direction of changes in the business cycle. We
trichotomized the forecasts into trichotomous scenarios, namely, large predicted increases,
no significant changes, and large predicted decreases. To distinguish small from large
changes, a relevant threshold or cutoff was required. We adopted a 5% cutoff following
Greer (2003). The directional accuracy rate was first calculated as Cs/Ns x 100%, where
Cswas the number of correct predictions for significant large changes, and Nsreferred to
the total number of significant large changes in the actual business cycle variable. Then,
the comparative finding for directional accuracy and binomial testing up to 6 months was
tabulated collectively, as shown in Table 1. This was to evaluate the predictive accuracy
of the constructed EWI against the competing indicator-based mode (i.e., the publicly
available CLI).
In this context, the binomial test was incorporated to examine the robustness of the EWI
as a forecasting tool. The aim of the test was to statistically verify that the EWI itself has
compelling predictive power and that the success of the prediction is independent from
probability of correctly predicting the direction of change in the forecasting model is 50%.
In other words, the null hypothesis implied that the forecasting model performs no
differently than the wild guess. If the null hypothesis is rejected, then we could expect
two possible outcomes. In the case where the directional accuracy rate is more than 50%,
the forecasting model proved to statistically outperform the wild guess. Conversely, if the
directional accuracy rate is lower than 50%, the wild guess will dominate the source for
obtaining correct predictions. If this is the case, then the forecasting model cannot beat
[image:15.612.93.519.325.455.2]the wild guess in predicting the direction of change in the business cycle.
Table 1: Directional Accuracy and Binomial Testing Results
Lag (month)
Directional Accuracy (%) P(Binomial)
EWI CLI EWI CLI
1 86.49% 8.11% 0.000 0.000
2 91.89% 10.81% 0.000 0.000
3 94.59% 13.51% 0.000 0.000
4 94.59% 13.51% 0.000 0.000
5 89.19% 13.51% 0.000 0.000
6 83.78% 10.81% 0.000 0.000
The direction accuracy test results in Table 1 reveal that the constructed EWI can predict
with up to 94.6% accuracy Malaysia’s major business cycle turning points. In sharp
contrast, the directional accuracy rate of the existing CLI was at best 13.5%. Furthermore,
binomial test results called for a rejection of the null hypothesis at the 1% level of
significance, indicating that the EWI performs better than the wild guess. This is an
important inference to justify that the source of success or correct prediction offered by
the EWI is owing to the predictive power of the indicator per se, and not to mere chance.
robustness of the EWI in business cycle forecasting given the strong evidence of
directional accuracy. This again suggests that EWI holds compelling predictive power to
foreshadow the changing phases in the business cycle and offers a reliable signal of
economic vulnerability.
5.0 CONCLUSION
With the aim of providing the Malaysian economy with a practically and empirically
sound indicator-based forecasting tool, an EWI was constructed using a set of
macroeconomic series. The EWI was found to work well in tracing the business cycle in
Malaysia with some lead time. Most of the critical turning points that translated into
unpleasant economic experiences from 1991 through 2009 were predicted in advance by
the EWI. The remarkable lead time of about 6 months on average enables the EWI to
work as a responsive short-term forecasting tool in macroeconomic analysis and policy
building. In addition, the statistical tests on the model’s predictive accuracy suggest that
the constructed EWI outperforms the currently available CLI in forecasting the
Malaysian business cycle. This finding again strengthens Yap’s (2009) argument
regarding the diminishing capability of the CLI as an early signaling tool. One significant
possibility that leads to a weakened CLI is the diminishing capability of the component
series to reflect the contemporary economic environment. In other words, such
phenomenon implicitly suggests that continuous updating and revising of the composite
indicator is crucial to sustain the accuracy and competency of the indicator-based
ACKNOWLEDGEMENT
The authors acknowledge the financial support of the Universiti Malaysia Sarawak and Fundamental Research Grant No. FRGS/05(18)/731/2010(17).
REFERENCES
Ahmad, N. (2003). Malaysia Economic Indicators: Leading, Coincident and Lagging Indicators. Paper presented at the Workshop on Composite Leading Indicators and Business Tendency Survey, Bangkok.
Artis, M. J., Bladen-Hovell, R. C., & Zhang, W. (1995). Turning Points in the International Business Cycle: An Ex Post Analysis of the OECD Leading Indicators Series for the G-7 Countries.OECD Economic Studies, 24(1), 125-165.
Atabek, A., Coşar, E.E., & Şahinöz, S. (2005). A New Composite Leading Indicator for Turkish Economic Activity.Emerging Markets Finance and Trade, 41(1), 45-64.
Bascos-Deveza, T. (2006). Early Warning System on the Macroeconomy Identification of Business Cycles in the Philippines.Bangko Sentral Review, January, 7-16.
Bodart, V. Kholodilin, K.A., & Shadman-Mehta, F. (2003). Dating and Forecasting the Belgian Business Cycle. Institut de Recherches Economiques et Sociales (IRES) Discussion Paper, No. 0318.
Bordoloi, S., & Rajesh, R. (2007).Forecasting the Turning Points of the Business Cycles with Leading Indicators in India: A Probit Approach. Paper Prepared at the Singapore Economic Review Conference, Singapore.
Bry, G., & Boschan, C. (1971). Cyclical Analysis of Time Series, Selected Procedures and Computer Programs (Technical Paper 20). Massachusetts Avenue, Cambridge: National Bureau of Economic Research, Columbia University Press.
Burns, A.F., & Mitchell, W.C. (1946). Measuring Business Cycles. In NBER (Ed.),
Studies in Business Cycle. New York: Colombia University Press.
de Leeuw, F. (1991). Towards a Theory of Leading Indicators In Lahiri, K. and Moore, G . D . (Eds.), Leading Economic Indicators: New Approaches and Forecasting Records. Cambridge: Cambridge University Press.
Diebold F.X., & Rudebusch G.D. (1989). Scoring the Leading Indicators, Journal of Business, 60, 369-391.
Du Plessis, S.A. (2006).Business cycles in Emerging Market Economies: A New View of the Stylized Facts. University of Stellenbosch Economic Working Papers, No. 2/2006.
Everhart, S.S., and Duval-Hernandez, R. (2000). Leading Indicator Project: Lithuania. Policy Research Dissemination Center, Policy Research Working Paper Series 2365.
Everhart, S.S., & Duval-Hernandez, R. (2001). Short-Term Macro Monitoring: Leading Indicator Construction-Mexico. Georgia State University, Andrew Young School of Policy Studies, Working Paper 01-8.
Gandolfo, G. (1981). Qualitative Analysis and Econometric Estimation of Continuous Time Dynamic Models. Amsterdam: North-Holland Publishing Company.
Greer, M. (2003). Directional Accuracy Tests of Long-Term Interest Rate Forecast.
Journal of Forecasting, 19(2), 291-298.
Herrera, S., & Garcia, C. (1999). User's Guide to an Early Warning System for Macroeconomic Vulnerability in Latin American Countries. Policy Research Dissemination Center, Policy Research Working Paper Series 2233.
Hodrick, R.J., & Prescott, E.C. (1980). Postwar U.S. Business Cycles: An Empirical Investigation.Carnegie Mellon University Discussion Paper, No. 451.
International Monetary Fund (IMF). International Financial Statistics, various issues. Washington, DC: IMF.
Issler, J.V., Notini, H.H., & Rodrigues, C.F. (2011). Constructing Coincident and Leading Indices of Economic Activity for the Brazilian Economy. Graduate School of Economics, Getulio Vargas Foundation, Economics Working Papers, No. 714.
Jaya, M., Bhupal, S., & Rajeev, J. (2003). Business Cycles and Leading Indicators of Industrial Activity in India, MPRA Paper, No. 12149.
Jones, M., & Ferris, K. (1993). Market Movers: Understanding and Using Economic Indicators from the Big Five Economies.New York: McGraw-Hill.
Klucik, M., & Haluska, J. (2008). Construction of Composite Leading Indicator for the Slovak Economy. Scientific Annals of the “Alexandru Ioan Cuza” University of Iasi – Economic Sciences Section, 363-370.
Kranendonk, H., Bonenkamp, J., & Verbuggen, J. (2005). A Leading Indicator for the Dutch Economy. Central Planning Bureau (CPU) Discussion Paper, No. 32.
Mitchell, W.C., & Burns, A.F. (1938). Statistical Indicators of Cyclical Revivals, New York: NBER.
Moore, G.H., & Zarnowitz, V. (1986). The Development and Role of the National Bureau of Economic Research: Business Cycle Chronologies In: Gordon, R. A. (Ed.),The American Business Cycle: Continuity and Change. Chicago: University of Chicago Press for NBER.
Neftci, S. N. (1982). Optimal Prediction in Cyclical Downturn. Journal of Economic Dynamic and Control, 4(1), 225-41.
Niemira, P. M., & Klein, P.A. (1994).Forecasting Financial and Economic Cycles.New York: John Wiley & Sons, Inc.
Organization for Economic Cooperation and Development (OECD). (2001). OECD Composite Leading Indicators: A Tool for Short-Term Analysis. France: OECD.
Phillips, K.R. (1998). The Composite Index of Leading Economic Indicators: A Comparison of Approaches. Paper Presented at the Workshop on Regional Economic Indicator Models, University of Minho, Braga, Portugal.
Polasek, W. (2010).Dating and Exploration of the Business Cycle in Iceland. The Rimini Centre for Economic Analysis, Working Paper 10-13.
Samuelson, P.A. (1976). Optimality of Sluggish Predictors under Ergodic Probabilities,
International Economic Review, 17, 1-7.
Schirwitz, B. (2009). A Comprehensive German Business Cycle Chronology, Empirical Economics, 37(2), 287-301.
The Conference Board (2000). Business Cycle Indicators Handbook. New York: The Conference Board.
Yap, J. T. (2001). System of Leading Indicators for the ASEAN Surveillance Process. (Final Report for Capacity Building in Support for the ASEAN Surveillance Process). Manila: Asian Development Bank.
Yap, M.M.C. (2009). Assessing Malaysia’s Business Cycle Indicators. Monash University Discussion Paper, 04/09.
Zalewski, K. (2009). Forecasting Turning Points with Composite Leading Indicators – The Case of Poland,Ekonomia Journal, 24, 61-93.