Munich Personal RePEc Archive
The Reverse Wage Gap among Educated
White and Black Women
Houseworth, Christina and Fisher, Jonathan
20 January 2011
The Reverse Wage Gap among Educated White and Black Women
Jonathan D. Fisher* Christina A. Houseworth
New York Census Research Data Center Litigation Analytics, Inc.
School of Public Affairs, Baruch College 370 Lexington Avenue
135 East 22nd Street, Box D-901 Suite 1802
New York, NY 10010 New York, NY 10017
Key Words
Human capital, differential demand and supply for schooling, wage gaps
Abstract
Using the 2004 National Sample Survey of Registered Nurses and the 2004-2005 American
Community Surveys, we estimate the black-white wage gap among females with at least some
college education. We find that black female nurses earn 9 percent more at the mean and median
than white female nurses, controlling for selection into nursing employment. Among K-12
teachers, black females earn 7 percent more than white females at the median. There is no
black-white wage gap among all women with a bachelor’s degree. Differences in opportunities for
education and marriage between white and black women may explain why highly educated black
females earn on par with highly educated white females.
Abbreviations
ACS – American Community Survey
NSSRN – National Sample Survey of Registered Nurses
1. Introduction
Differences in socioeconomic status by race persist in the United States, although there
has been some convergence over time. Blacks have, on average, lower wealth, income, wages,
and levels of human capital than whites. These differences can be explained through differences
in opportunities, individual characteristics and discrimination. There is a large literature that
attempts to explain wage differentials with the latter two explanations. Opportunities may differ
by race affecting, among other things, the supply of education, the demand for education, and
marriage markets. These differences will affect investment in human capital. For instance,
blacks attend lower quality schools (Alliance for Excellent Education, 2008, and Orfield and
Lee, 2005), which will affect the demand for higher education. Further, black women face a
substantially tighter marriage market, which may induce a higher demand for education.
Differences in opportunities affect an individual’s decision to obtain higher levels of education,
occupation choice, and the decision to marry, which in turn, affect wages. It has been found that
differences in marriage outcomes between black and white women can affect our perception of
the racial wage gap (Neal, 2004).
Given that there are different characteristics and opportunities between blacks and whites,
and that these differences affect wages, shouldn’t we expect wage differentials to differ by
education level? An examination of the characteristics of educated women is the first step in
identifying how differences in opportunities, such as access to education and the marriage
market, affect the racial wage gap among women. Using the 2004 National Sample Survey of
Registered Nurses (NSSRN), registered nurses are used to examine the black/white wage gap
The restriction to registered nurses does not limit the interpretations of the results found
in this research. Rather, the findings here can be applied to all women with higher levels of
education. Registered nurses were chosen because of the specific characteristics that ease in the
interpretation of the racial wage gap among women. More specifically, registered nurses were
chosen because of the education requirement, because over 90% are female, and because we can
control for selection into employment with the NSSRN. These specific occupational
characteristics allow for the examination of a highly educated group of women in an occupation
that has few males. Therefore, the examination is not complicated by issues related to the gender
wage gap. The NSSRN provides earnings information regardless of employment, and, therefore,
can be used to control for selection into employment. In addition, the NSSRN provides other
useful information not found in economy-wide data, such as information on the financing of the
individual’s nursing education. The results are then expanded beyond nurses by examining the
racial wage gap among all women with higher education using the 2004-2005 American
Community Surveys (ACS).
This paper differs from previous studies by focusing on highly educated women while
controlling for selection into employment. While initially nurses are examined, the analysis is
extended to K-12 teachers, and then to all women with at least some college education. The
same reasoning discussed above for the examination of nurses can be applied to teachers. K-12
teaching is also primarily female, and spread out across the country. Most importantly, K-12
teaching also requires higher levels of education for the most part. The reverse wage gap among
nurses is emblematic of wider trends and should begin an academic discussion of deeper
of the important factors and markets that contribute to differences in wages among black and
white women.
2. Wage Gaps
Studies have found that controlling for education and experience among the highly
educated can explain much of the wage gap. Black, Haviland, Sanders & Taylor (2006) find
that the observed racial wage gap among college-educated men born outside the South was
approximately zero. For black men born in the South and those born outside the South but born
to poorly educated parents, the wage gap is related to the lower quality education they receive.
O’Neill and O’Neill (2005) conclude that differences in the quantity of education and the quality
of skills account for most of the wage gap between white and black men and women. Anderson
and Shapiro’s (1996) findings suggest that highly educated black women suffer less racial labor
market discrimination than lower educated black women. Jacobson, Olsen, Rice, Sweetland &
Ralph (2001) show that for women with similar levels of education, blacks earn as much, or
more, than whites. Black, Haviland, Sanders & Taylor (2008) find that controlling for
observables for Asian and Hispanic women with high labor force attachment and high levels of
education renders the gender wage gap relative to white men essentially zero. The same study
shows that when experience is not controlled for, black women earn more than white women.
The reverse is found when controlling for experience. None of the latter four papers that focus
on women, however, control directly for selection into employment.
In addition to differences in observable characteristics, selection into employment can
help to explain wage gaps. The original Oaxaca-Blinder technique decomposes the wage
not random, then the observed wage gap among those who are working is likely to be a biased
measure of the population wage gap.
Selection into employment is particularly important when examining the wage gap
among black and white women. Among white women, those not employed are more likely to be
married with children, and they may choose not to work for pay. Positive assortative mating
implies that high ability marry high ability, meaning that the white women who are not employed
could garner a high wage if working. Thus, white married females who are not employed cause
observed wages for white women to be biased downward. Neal (2004) finds that black women
who are not employed are more likely to be single mothers, and receiving welfare may be a
better option than working. Therefore, black women who do not participate in the labor force are
those with relatively low earnings, which biases observed wages for black women upward. If
observed wages for white women are biased downward and observed wages for black women are
biased upward, the observed wage gap between employed white and black women is too small.
Selection into employment may explain why O’Neill and O’Neill (2005), Anderson and Shapiro
(1996), and Jacobsen, Olsen, Rice, Sweetland & Ralph (2001) find that the racial wage gap
among educated women is relatively small. They do not control for selection, therefore, black
female wages may be overstated relative to white female wages.
Neal (2004) considers selection patterns into employment between white and black
women. Using data from the 1990 National Longitudinal Survey of Youth, he imputes wages for
those not employed. Using the imputed wage technique, Neal finds that the wage gap increases
by almost 60%.
In addition to selection into employment, selection into post-secondary education may
opposite direction. If the costs of attending post-secondary schooling are higher for blacks, then
the blacks who choose to attend post-secondary may have higher unobserved ability than whites
who choose to attend post-secondary schooling. It follows that, absent discrimination in the
labor market, blacks who graduate from college should have a higher wage than whites who
graduate from college. Jacobson et al (2001) find that for young adults with similar levels of
prior educational achievement, blacks are more likely to attend college than whites. Among
those in college with similar levels of ability (reading and mathematics test scores), blacks are
just as likely, or more likely, to complete college as whites. Urzua (2008) finds that for the same
ability level, blacks have higher levels of schooling. It is unclear what is driving this result. It
could be that it takes more schooling to get the same level of ability. It may also be that for the
same level of ability, blacks have a lower supply of funds and have more of an incentive to
perform well in school. Therefore, they may be more likely to complete their degree, or continue
with their education than their white counterparts. These results may indicate that blacks who
choose to attend college are different than their white counterparts.
Finally, different marriage market conditions between black and white women will
generate different levels of investment in human capital. Lichter, LeClere, and McLaughlin
(1991) find that for every three black unmarried women in their 20s, there is roughly only one
unmarried man with earnings above the poverty threshold. Because black women have a poorer
marriage market, they may be more likely to invest in higher levels of human capital.
3. Data and Empirical Methodology
3.1.1 National Sample Survey of Registered Nurses (NSSRN)
To estimate the black-white female wage gap among registered nurses, we use the
individuals holding a registered nurse license and is conducted by the U.S. Department of Health
and Human Services. The sample is derived from state registries of those holding a registered
nurse license. Smaller states are oversampled to aid in estimating workforce supply conditions
for each state.
The survey began in 1977 and was conducted again in 1980 and every four years since.
We use the 2004 survey for our main analysis. Two important variables are included only in
2004, years of nursing experience and urban/rural status. The response rate in 2004 was 70.5
percent, for a total of 35,724 respondents. Respondents are asked questions regarding formal
education and additional training and certificates received. When referring to educational
attainment, we use the highest nursing degree earned. Some have higher degrees in a
non-nursing field. Demographic information includes gender, race, year of birth, marital status,
presence of children, and household income.
An individual stays in the sample frame as long as she maintains an active license. Thus,
the sample includes all individuals, regardless of employment status. The survey provides a
wide range of information for those not utilizing their license. Respondents that are not
employed as nurses are asked if they are unemployed or employed outside of nursing, and their
reason for leaving nursing. Information on current job title, average hours worked per week, and
gross annual earnings at the current job is provided for those employed outside of nursing. The
only information available for the unemployed is whether the individual is seeking employment
in nursing.
For those employed in nursing, detailed job characteristics are gathered, including title,
type of unit (e.g. emergency room), and setting (e.g. hospital). To estimate wages for those
weeks normally worked per year, hours worked in the last full workweek, and current gross
annual earnings including overtime and bonus income. All three questions refer only to the
individual’s principal nursing position.
3.1.2 American Community Survey (ACS)
We use the 2004 and 2005 American Community Surveys (ACS) to examine the racial
wage gap among females. Conducted by the U.S. Census Bureau, the ACS replaces the
Decennial Census Long-Form. The 2004 ACS had over 568,000 respondents, and the 2005 ACS
had over 1.9 million respondents. The large sample allows us to look at wage gaps by
occupation using just two years of data.
Questions regarding earnings, hours, and weeks are similar to other national surveys and
to the NSSRN. Earnings are for the previous twelve months; hours are the usual hours worked
per week in the last twelve months, and weeks are the number of weeks worked in the past
twelve months.
3.2 Empirical Methodology
We estimate the hourly wage as the gross earnings divided by the product of hours and
weeks worked. The estimated hourly wage is censored at the first and ninety-ninth percentiles to
control for outliers.
To estimate the black-white female wage gap among nurses, we follow the basic
methodology of Blinder (1973) and Oaxaca (1973). Separate log wage models are run for black
females and white females.
( )
Wi =Xi+ui 'log (1)
for education (associates degree, diploma degree, bachelor’s degree, and master’s degree or
higher),1 three dummy variables for marital status (married, single, and
divorced/separated/widowed), three dummy variables for children (child less than six-years old
in the home, child aged 6-17, and no child under 17 in the home), years of experience in nursing
and its square,2 whether the nurse had help from family or other relatives in financing her R.N.
education, four region variables, four urban status variables (urban, large rural, small rural, and
isolated rural),3 whether the individual was employed in nursing last year, and three dummy
variables for mobility (moved once to a different state since obtaining license, moved more than
once, and has not moved between states).
The basic models exclude those who are not working in nursing at the time of the survey.
Thus it excludes those employed outside of nursing and those not working. Neal (2004) showed,
however, that ignoring females who are not working biases the black-white female wage gap.
We employ two methods to address potential selection into employment. The first is the
standard Heckman correction method for selection bias. Heckman (1979) accounts for selection
by first estimating an equation determining the probability of labor force participation and then
using the computed hazard rate variable in the wage equation. This method has been criticized
because it requires specific functional form restrictions and requires a variable that affects the
decision to work but not the wage. A typical instrument in this literature, especially for women,
is household income. Women who have spouses with high earnings may be less likely to work
outside the home, and their spouse’s earnings may not affect her potential wage. The NSSRN
1
To take the exam to become a registered nurse, the individual must complete a bachelor’s degree in nursing from a 4-year college, an associate’s degree in nursing from a 2-year college, or a three-year diploma program through a hospital. A graduate degree in nursing is not an entry-level degree.
2 The survey asks how many years the respondent has worked at least half the year since receiving her registered nurse license.
3
includes a bracketed variable for total household income. We assign the mid-point of the bracket
and then subtract the respondent’s total earnings to arrive at non-nursing household income.
The second method follows Neal (2004) and imputes a wage for those not employed in
nursing. We create race, education, marital status, and children status cells and assign the
median of that cell to all women in that cell who do not have an observed wage. Because we are
imputing wages for a specific occupation with strict licensing requirements, this imputation
method should be more accurate than when applied to a sample drawn from all occupations, such
as is done in Neal (2004).
For those employed outside of nursing, we ignore their wage rate from their non-nursing
employment, as we are interested in the nursing wage gap. Therefore, we estimate the wage
these women would receive if they worked in nursing as a proper measure of the nursing racial
wage gap.
4. Results
Basic summary statistics are presented to describe the race wage gap among female
nurses, labor force participation rates and mean values for independent variables. Empirical
results include an Ordinary Least Squares (OLS) using the Blinder-Oaxaca decomposition, and
then we discuss decomposition results when correcting for selection into employment. In all
decompositions, the reference group is black females.
4.1 Wage Gap and Descriptive Statistics
Table 1 presents the mean and median wage gap for nurses in the NSSRN. Mean and
median earnings for black female nurses are 9 percent higher than for white female nurses in
such that a gap of 1.09 means that blacks earn 9 percent more than whites, and an increase
(decrease) in the wage gap means the gap widens (narrows) in favor of blacks.
One major concern regarding wage differentials is selection into employment. Neal
(2004) finds that the female racial wage gap is 60 percent larger in favor of whites when
controlling for selection into employment. White women who are not employed are more likely
to be in high income households while their black counterparts are more likely to be single
mothers.
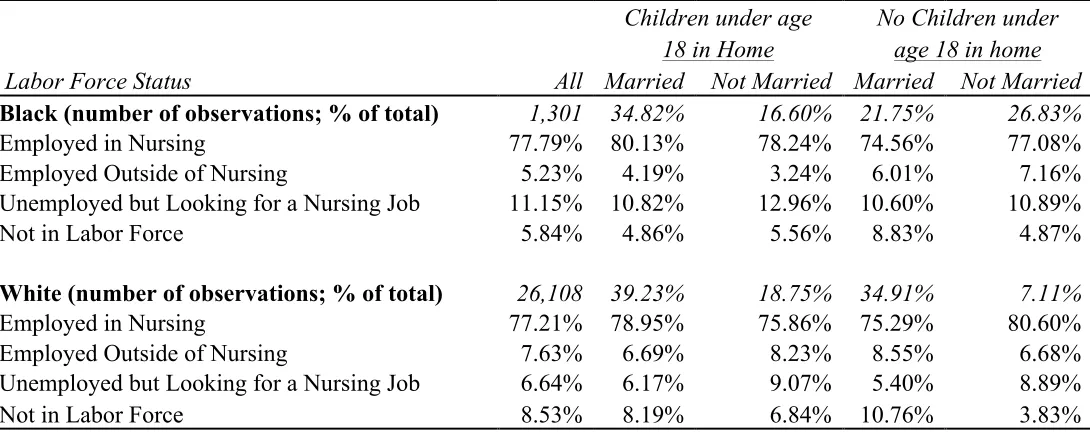
In the sample of registered nurses, 77.8 percent of black women are employed in nursing
and an additional 5.2 percent are employed outside of nursing (Table 2). Similarly, 77.2 percent
of white women are employed in nursing and an additional 7.6 percent are employed outside of
nursing. Among those not employed, 5.8 percent of black women are not in the labor force,
while a higher percentage of white women, 8.5 percent, are not in the labor force. Table 2 does
not appear to conform to the narrative found in Neal (2004) regarding labor force participation
rates. The modal black woman not employed in nursing is married with a child under age 18 in
the home, while the smallest group of black women not employed in nursing are unmarried with
children under age 18 in the home. In addition, the labor force participation rate for non-married
black women with children is just over 94 percent. The corresponding labor force participation
rate for white women is 93 percent. White married women with no children in the home are
about 2 percentage points more likely to be out of the labor force than their black counterparts;
however, the difference is not large compared to the percentage of all white women who are out
of the labor force. Thus, even when we control for selection into employment below, we should
The mean wage gap decreases as education increases, and at the median, the wage gap is
essentially zero for those with a graduate degree (Table 1). Table 3 shows that among registered
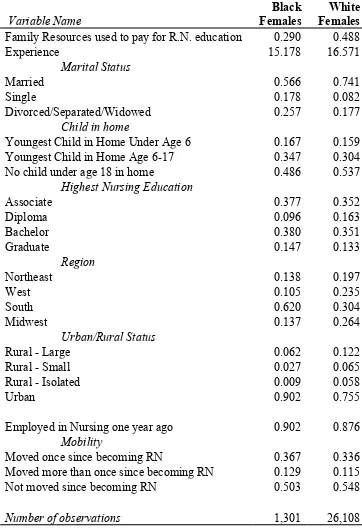
nurses, regardless of employment status, black females have higher levels of education. Over 52
percent of black females have a bachelor’s or graduate degree in nursing, while 48 percent of
white females have a similar level of education. Nationally, a higher percentage of white women
have a bachelor’s degree or greater. Over 26 percent of white women and 18.5 percent of all
black women in 2004 had at least a bachelor’s degree.4 Table 3 could suggest that part of the
reason blacks earn higher wages in nursing is their higher education.
White females are more likely to be married, more likely to have resources from their
family help pay for their education, less likely to live in the south, and less likely to work in an
urban area. As wages are generally higher in urban areas, a higher percentage of black nurses
working in urban areas may explain why blacks earn more than whites on average. The opposite
is true for south as wages are generally lower in the south and a higher percentage of blacks live
in the south.
4.2 OLS Results
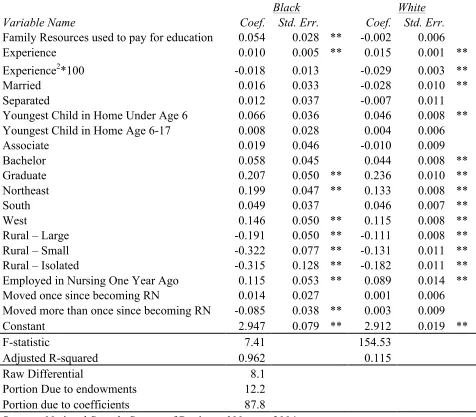
Table 4 presents the basic results using Ordinary Least Squares, not correcting for
potential selection bias. In this full specification, we include all variables that might be related to
wages in order to determine whether we can explain away the observed reverse wage gap. Some
variables, such as whether you worked as a nurse last year, are related to the structure of wages.
For example, a reverse wage gap may make black nurses more likely to work last year because
of the wage premium they are receiving relative to white nurses. Because we are primarily
interested in whether we can explain away the observed reverse wage gap, an intuitive
paper. However in Table 5 discussed below, we do show how the wage decomposition changes
under alternate specifications to determine whether our conclusions depend on the inclusion of
these variables. In the discussion below, we focus on the variables that affect the wage gap.
A Chow/Wald test indicates that the coefficients differ between blacks and whites.
Therefore, models are run separately for blacks and whites, with the Blinder-Oaxaca
decomposition shown at the bottom of the table. The coefficients match expectations.
The Blinder-Oaxaca decomposition shows that black female nurses earn 8.1 percent more
than white female nurses. The wage gap is broken down into two components: the portion due to
differing endowments of the independent variables, and the portion unexplained. Table 4 shows
that if whites were given the endowments of blacks then the gap would decrease by 12.2 percent.
This means, however, that blacks still earn approximately 7.1 percent more when controlling for
observable differences, using a standard wage decomposition technique.
For most variables, the coefficients match signs between blacks and whites. There are
differences between white and black coefficients in regards to the variables marital status,
associate degree, and very mobile. However, the coefficients are either statistically insignificant
for both or are only statistically significant for one group.
The benchmark group for the education variables is those with a diploma only. The
premium for having a bachelor’s degree is relatively small, just 4.4 percent for whites and 5.8
percent for blacks. The graduate premium is significantly higher at 23.6 percent and 20.7
percent, respectively. Education variables are a large determinant of the wage gap. Blacks have
a higher return to holding a bachelor’s degree, which explains 7.5 percent of the wage gap.
Blacks are also more likely to have a bachelor’s degree. If white women received the higher
would decrease by 9.8 percent. Adding the effect of all of the education variables indicates that
if whites had the same return as black females and the same likelihoods, the wage gap would
decrease by 20.1 percent.
Black women are less likely to live in rural areas. If the same percentage of whites lived
in rural areas as blacks, the wage gap would narrow by 39.3 percent. However, blacks have a
higher penalty than whites for living in a rural area. If whites were to receive the wage penalty
that blacks receive for living in rural areas, the wage gap would widen by 27.7 percent.
Combining these effects, the four rural/urban variables together shrink the wage gap by 11.6
percent.
Blacks are less likely to live in the Northeast and West but earn a higher return to living
in those regions than whites. Similarly, blacks are more likely to live in the South but receive a
lower return than whites to living in the South compared to living in the Midwest. The net effect
of the region variables widens the wage gap. Because blacks are twice as likely to live in the
South as whites and because the wages in the South are lower than in the Northeast or West,
giving whites the region endowments of blacks increases the wage gap. It appears that the
penalty to living in the South for black women is large enough to counter the gain in other
regions.
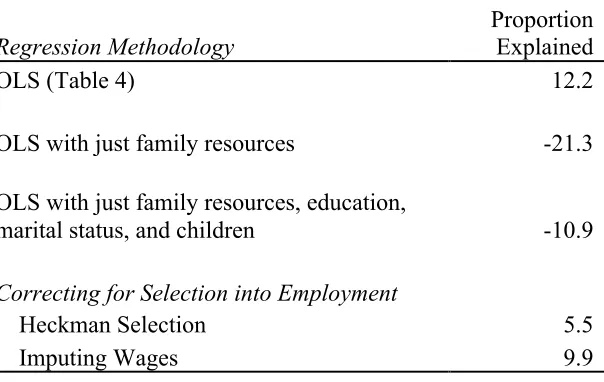
Table 5 presents sparser specifications. The first specification uses the only variable that
is plausibly fixed before job market decisions are made – whether the nurse used money from
family members to help pay for her R.N. education. We use this variable as a proxy for parental
wealth and unobservable parental characteristics that may be correlated with education and
ability. As shown in Table 3, whites were more likely to have help from their families. Using
includes education, marital status, and the presence of children. The results again indicate that
the wage gap widens when only controlling for these variables.
4.3 Correcting for Selection into Nursing Employment
Black women may have higher wages even controlling for observables because selection
into employment is not being controlled for. As Neal (2004) finds for females as a whole,
accounting for selection raises the average wage of whites and lowers the average wage of
blacks. However, the sample used in Neal (2004) is that of black and white women in all
occupations and education levels, where differences are due in large part to low wage black
females being out of the labor force. Women, such as registered nurses, who have invested in
human capital with schooling beyond high school and with a specialized license are less likely to
have low wages than women as a whole. Government assistance is not likely to be an optimal
outcome considering the income they could earn as a nurse. This should also be true for more
educated women as a whole, even outside of nursing.
A more applicable portion of Neal’s discussion of selection concerns married white
women and positive assortative mating. Selection is controlled for in two ways.5 A standard
Heckman selection correction is used where non-nursing income (total household income less
earnings from the registered nurse) is used as an instrument for nursing employment. This
income measure is used under the assumption that husband’s earnings will affect the decision to
work but not the wage received.6 The second sample selection method follows Neal (2004) by
imputing wages for those who are not employed in nursing. To impute wages, cells for race,
education, marital status, and presence of children in the home are used. The median of each cell
5 Imputation and the Heckman selection both are problematic, and previous research has shown that the Blinder-Oaxaca decomposition can be sensitive to the selection correction method (Beblo, Beninger, Heinze & Laisney 2003). Including both methods provides evidence that the results are robust to the two models.
6
for those who are employed in nursing are used as the imputed wage for those who are not
employed in nursing.
Because we are only interested in whether selection into employment affects the wage
gap, regression results for these methods are not presented but are available upon request.
Instead, Table 5 displays the portion of the wage gap explained by our various techniques. First,
the results from Table 4 using OLS are presented, showing that 23.6 percent of the wage gap is
explained by observables without correcting for selection into employment. Using the Heckman
selection method, the portion of the wage gap that is explained actually decreases to 5.5 percent.
The results indicate that there is negative selection for both blacks and whites, suggesting that
unobserved factors that make employment in nursing more likely to be associated with lower
wages. Neal (2004) hypothesizes that selection into employment differs between blacks and
whites, which is inconsistent with these results. However, Neal analyzes females regardless of
education.
Only 19.6 percent of the wage is explained when using imputed wages for those who are
not employed in nursing. Regardless of method for correcting for selection into employment, the
wage gap is not explained by differences in observables. See Appendix B for results with
variables including job setting (e.g. hospital), occupation (e.g. staff nurse), union status,7 prior
health care experience, additional training, and other variables which are important determinants
of nurse earnings. Again, less than 5 percent of the wage gap is explained in a kitchen sink-type
regression. Thus, the wage gap among those that have invested in human capital cannot be as
easily explained by differences in employment as was shown in Neal (2004).8
7 The non-union median wage gap is 8.9 percent, while the union wage gap is 6.9 percent. 8
5. Discussion
Observable variables examined do not explain why black female nurses earn 9 percent
more than white female nurses. Education and urban status explain a portion of this gap, but the
unexplained portion of the gap remains large. A narrowing and even reversal of the female
black-white wage gap has been documented in earlier literature (Neal and Johnson, 1996;
Bollinger 2003), where selection into employment was not controlled for. Neal (2004) attributed
the narrowing of the female black-white wage gap primarily to differing selection into
employment by race. We do not find empirical evidence to support this hypothesis with our
sample of nurses. Black female nurses earn a higher mean and median wage than white female
nurses, even when controlling for selection. This section explores other factors that might
explain the wage gap and presents evidence when possible. While we explore nurses in the first
part of this section, many of the same arguments will apply to educated women as a whole. We
focus on nurses because of the unique variables available in the NSSRN such as how the higher
education was financed and actual labor market experience.
5.1 Supply and Demand for Education
Selection into employment is not the only possible explanation for a wage gap in favor of
black females. There are differences between black and white women in labor force attachment,
ability, supply and demand conditions for education, and marriage markets. Neal (2004) argues
that, all else equal, black women may have higher average wages than white females because
black females are more attached to the labor force. Therefore the observed wage for black
females should be higher because of this additional human capital. The 2004 NSSRN includes
information on the number of years the individual worked at least half the year in nursing. At
the mean and median, black nurses have lower actual experience than whites (Table 3).
Additionally, for a given year of potential experience, black nurses have 0.64 years of actual
experience, while white nurses have 0.69 years of actual experience for a given year of potential
experience. Hence, the argument that black females are more attached to the labor force is not
applicable for our sample of nurses.
The wage gap may also be explained through education. A defining characteristic of
nursing is that it requires significant investment in human capital. To become a registered nurse,
an individual is required to obtain at least two years of post-secondary education. Unlike the
population as a whole, black females have more education than white females. As discussed
above, this education differential in favor of blacks explains a portion of the wage gap. It is still
unexplained why black nurses are more educated than white nurses.
In general, differences between whites and blacks in ability and in the supply and demand
for education will affect the return to education,9 which in turn affects educational attainment
and wages.
5.1.1 Supply for Education
Average incomes are lower for blacks and therefore black parents are less likely to be
able to provide support for post-secondary education for their children (Black and Sufi, 2002).
Thus, black women may be less likely to have family support for higher education. Cameron and
Heckman (2001) and Carneiro and Heckman (2003) also argue that living in lower income
households hinders the human capital accumulation of blacks. Caldwell (2009) finds that
changes in affirmative action policies affect human capital accumulation, indicating that
differences in perceived opportunities for education affect investment. Linsenmeier, Rosen, and
suggesting that the ability to finance post-secondary education is a barrier to blacks. If family
support is lower for black females, the supply of funds is lower, indicating a higher rate of return
on the investment is needed for blacks to attend college, all else equal. For an individual to
benefit from that additional education, the rate of return to that education should be larger.
Therefore, the return to education should be higher for blacks. For a good discussion of the
relationship between the return to education and the marginal benefit and marginal cost of
education see Chiswick (1988).
The 2004 NSSRN survey provides information on the financing of the individual’s
nursing education. The categories listed are personal resources, family resources, employer
tuition reimbursement plan, federal traineeship, and federal, state, local government, and
non-government scholarships, grants, or loans. Black nurses are almost twice as likely to have
financed their nursing education by loans or scholarships alone (24.6% versus 12.4%; Table 6),
34% less likely to have financed by self or family (27.2% versus 41.4%), and almost twice as
likely to be funded by their employer only (2.5% versus 1.3%). The remaining 46% of black
nurses and 45% of white nurses rely on some combination of these sources for their funding.
Black nurses are less likely to rely solely on their family for financing their nursing education.
Black nurses face a higher cost of nursing education if they are more likely to borrow to pay for
their education.
Given that the cost of attending post-secondary schooling is higher on average for blacks
than whites, for a given set of observable pre-market characteristics (e.g. AFQT as a proxy for
ability), one would expect that the average black female who received post-secondary schooling
would have higher unobservable skill than the average white female who received
believe they will succeed in order for the investment to make sense a priori. This unobservable
skill may be rewarded in the labor market through higher wages, but it may be unobservable to
the econometrician.
5.1.2 Demand for Education
Additionally, the demand curves for education may be different between blacks and
whites due to marriage market characteristics. “Marriageable” black men are in more limited
supply, especially for highly educated black females, as black males have higher than average
unemployment and incarceration rates, and lower than average levels of education, compared to
both white males and black females. Black females, on average, have higher levels of education
and are more likely to be employed than black males (Houseworth 2008). Further, two thirds
of marriages between blacks and whites are between black men and white women, while black
women have very low rates of racial intermarriage (The Journal of Blacks in Higher Education,
1997). Finally, non-black women are more likely to be married to black men if the black spouse
is highly educated (Gullickson, 2006, Houseworth, 2008, Qian, 1997). Therefore, black females
compete for an already limited number of “marriageable” black males with other racial groups,
while at the same time their relevant marriage pool tends to exclude other racial groups.
With poorer marriage market prospects, black woman may invest more in their own
careers. Gould and Paserman (2003) argue that higher wage inequality among white men may
lead white women to invest more in their own education and work experience. Further, risk
averse women may choose to work more because they are less able to diversify income risk
through marriage. If the marriage market is worse for black women, then one would expect that
these effects would be larger for black women as well. As a result, black females may be more
develops a dynamic equilibrium model where marriage and employment decisions are made
simultaneously. However, this model does not consider the decision to obtain higher education.
Taking the risk averse argument a step further, because of a poorer marriage market,
black females also may be more likely to choose an occupation that provides a steadier source of
income, such as nursing. An individual may be less likely to choose an occupation with a high
variance in earnings if the individual cannot diversify income risk through marriage. Therefore,
high ability black women may be more likely to choose an occupation that has less income risk,
such as nursing. There are chronic shortages of nurses, thereby insuring a demand for nurses.10
The effect of consumer discrimination on the wages of blacks may be less in an
occupation such as nursing because the customers are also likely to be black. Hospitals, in
general, serve local populations. As much as local areas are segregated, hospitals are segregated
as well. Thus black nurses are less likely to face discrimination by customers if they work in
areas where they live.
5.1.3 Summary
There may be several unobservable factors that suggest that the wages of black female
nurses may be higher than the wages for white female nurses. Because the supply of funds for
education is lower for blacks for the reasons listed above, the marginal benefit to education
should also be higher for those blacks who choose higher education. Therefore blacks who
choose higher education have higher unobserved ability than whites. Second, because of the
poorer marriage market for black females, nursing as an occupation with steady demand and jobs
spread throughout the country may attract high quality black females who are worried about the
quality of the marriage market. These black women are choosing a more secure job in case they
are not able to diversify income risk through marriage. Thus, nursing may be a more attractive
occupation for high ability blacks.
However, these are all partial equilibrium arguments. A tendency towards a long-run
equilibrium would imply that black females should observe this gap and enter into nursing.11 As
more black females enter nursing, we might expect that lower quality black females will make
the decision to enter into nursing. As lower quality black women enter into nursing, the wage
gap between white and black females will narrow in favor of whites. Figure 1 presents the
percent of nurses that are black females along with the black-white female nursing wage gap
between 1980 and 2004, using the various years of the NSSRN. As predicted, black females
went from 4.3 percent of nurses to 5.7 percent of nurses between 1980 and 2004, while the wage
gap fell from blacks earnings 11.9 percent more to 8.8 percent more.
5.2 Supporting Evidence
Most of the discussion above regarding the wage gap between white and black females in
nursing can be applied to all females. The differences between black and white nurses that
explain the wage gap are likely to be similar to the female black-white wage gap as a whole.
Specifically differences in labor force participation rates, ability, supply and demand conditions
for education, and marriage markets among black and white women will be present in other
occupations requiring higher education and among highly educated women as a whole.
K-12 teaching is also primarily female, and spread out across the country. Most
importantly, K-12 teaching also requires higher levels of education for the most part.
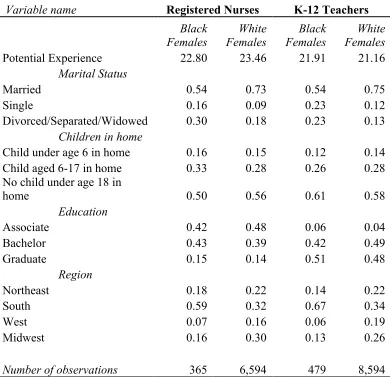
Descriptive statistics for black and white teachers are shown in Table 7. Black female teachers
have slightly higher levels of potential experience than their white counterparts, where the
11
opposite is true for nurses in the ACS and NSSRN. Black females in both occupations are less
likely to be married, more likely to be divorced, separated, widowed or single than white women.
Black teachers are less likely to have a child in the home than white women, where the opposite
is true for black nurses. Black nurses are more likely to have a bachelor’s degree, while black
teachers are slightly less likely. The characteristics of teachers suggest similar patterns among
nurses and teachers. For example, black females in both occupations are less likely to be
married, more likely to be divorced, separated, widowed or single than white women. A larger
percentage of both black nurses and teachers have a graduate degree than white females.
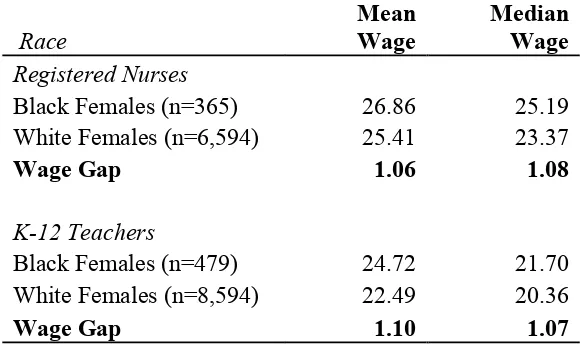
Regional patterns are similar for teachers and nurses. Black teachers also have higher earnings
than their white counterparts. The median wages of black female K-12 teachers are about 7
percent higher than those of white females (Table 8) in the ACS, where black female nurses earn
8 percent more at the median in the ACS.
The wage gap results in Table 8 suggest that Neal’s (2004) findings may be largely
influenced by the high proportion of blacks with low levels of education. The importance of
education in explaining the wage gap is further highlighted with the ACS data in Table 9.
Ignoring education and occupation, black females earn 93 percent of the earnings of white
females at the median, using the 2004-2005 ACS. Black females with a high school diploma or
less earn 92 percent of the earnings of white females with the same level of education. Black
and white females with a bachelor’s degree earn about the same at the mean and median, while
blacks with post-graduate degrees earn 108 percent of white females. Thus, the wage gap favors
white females at lower levels of education and favors black females at higher levels.
Of course, the wage gap for higher levels of education may decrease in favor of white
into employment. Black females with low levels of education are much less likely to be
employed than their white counterparts; however, the reverse is true for higher levels of
education (Table 9). Using the median of the race and education cell, wages were imputed
following the method in Neal (2004). In results not presented in the table, imputed wages
indicate that black females earn 83 percent of the earnings of white females at the median. When
not controlling for selection, this figure is 93 percent.
These results suggest that education and selection into employment are keys to
understanding the racial wage gap among females. Black and white women face very different
supply and demand conditions for education. In addition, black women face a very different
marriage market than those of white females, which may affect their decision to invest in a given
amount of human capital.
If education is a key to the white-black female wage gap, then is education a similar key
for men? Table 9 shows that it does not appear to be in the 2004-2005 ACS data. The wage gap
stays constant across education levels. However, employment rates by education and race differ
for men. Controlling for selection into employment may decrease the male wage gap as
education increases, but it is not likely to approach what is seen among females. Highly
educated black males will still earn considerably less than highly educated white males at the
median.
6. Conclusion
This paper focuses on the racial wage gap among highly educated females. However, the
restriction to registered nurses does not limit the significance of the results discussed above.
Registered nurses were chosen because of the specific characteristics that ease in the
be applied to all women with higher levels of education. An examination of registered nurses
finds that black female nurses earn 9 percent more than white female nurses. Contrary to
existing research, this result holds when controlling for selection into employment.
Inequality of opportunities between white and black females may help to explain this
reverse wage gap. The term “opportunities” is used broadly, as there may be differences in
opportunities that arise from family background, education, marriage markets and others. Blacks
are likely to have a lower supply for education and therefore in order to make the investment
worthwhile, those who choose to attend post-secondary schooling are of higher average ability.
Consequently, blacks who attend college may be of higher average ability than whites who
attend post-secondary schooling. This unobserved ability is rewarded in the labor market. Less
favorable marriage markets for blacks also affect the demand for education among blacks and
may affect the occupational choices of black females. Women whose marriage prospects are less
favorable will be more likely to invest in human capital. Both a higher demand curve and lower
supply curve indicate a higher rate of return to education for black women.
As supporting evidence of these hypotheses, K-12 teachers are examined. Black females
earn 7 percent more than white females in this occupation. Further, among all occupations,
employed black females with at least a bachelor’s degree earn more than employed white
females with at least a bachelor’s degree.
Corresponding to other research on racial wage inequality, our results indicate that
education is a key determinant of wage gaps. Currently, 26.4 percent of white women have at
least a college degree while only 18.5 percent of black women do. However, encouraging
post-secondary education may not necessarily increase the relative wages of highly educated black
ability is more equally distributed among the additional black college graduates, then it will
reduce the relative wages of college-educated black females. Consider that as the percent of blacks has increased over time in nursing, the wage premium received by blacks has decreased,
as shown in Figure 1. However, additional education certainly has non-wage benefits and likely
would decrease the overall female racial wage gap.
The findings presented in this paper raise an important question in regards to differences
in opportunities for education and marriage, and how they affect the educational and
occupational choices of women. Some evidence is presented to support the theory that black
women choose more stable occupations such as nursing and teaching because they have less
favorable marriage market prospects. The National Longitudinal Surveys of Youth contain
information on an individual’s education choice as well as that same person’s occupational
choice. This data could be used to sort out some of the issues raised in this paper. Overall, our
findings reinforce that additional research is needed to examine differences in opportunities and
how they may affect the wage gap among blacks and whites.
Acknowledgments
We thank Yuliana Sameroynina and Lisa Efuni for their assistance with the data. We also thank
seminar participants at the University of Alberta and the SOLE 2009 Annual Meetings for
References
Alliance for Excellent Education. 2008. African American Students and U.S. High Schools.
http://www.all4ed.org/files/archive/publications/AfAm_FactSheet.pdf
Anderson, D. and D. Shapiro. 1996. Racial Differences in Access to High-Paying Jobs and the
Wage Gap Between Black and White Women. Industrial and Labor Relations Review
49(2), (January): 273-286.
Auerbach, D. I., P. I. Buerhaus, and D. O. Staiger. 2007. Better late than Never: Workforce
Supply Implications of Later Entry into Nursing. Health Affairs 26, (January/February):
178-185.
Beblo, M., D. Beninger, A. Heinze, and F. Laisney. 2003. Measuring Selectivity-Corrected
Gender Wage Gaps in the EU. ZEW Discussion Papers No. 03-74.
Becker, G. S. and B. R. Chiswick.1966. The Economics of Education and the Distribution of
Earnings. American Economic Review 56 (March): 358-369.
Black, D., A. Haviland, S. Sanders, and L. Taylor. 2006. Why Do Minority Men Earn Less? A
Study of Wage Differentials Among the Highly Educated.” Review of Economics and
Statistics 88(1): 300-313.
Black, D., A. Haviland, S. Sanders, and L. Taylor. 2008. Gender Wage Disparities Among the
Highly Educated” The Journal of Human Resources 43(1): 630-659.
Black, S. and A. Sufi. 2002. Who Goes to College? Differential Enrollment by Race and Family
Background. National Bureau of Economic Research Working Paper No. 9310.
Blinder, A. S. 1973. Wage Discrimination: Reduced Form and Structural Estimates. The Journal
of Human Resources 8 No.4 (Fall): 436-455.
The Review of Economics and Statistics 85 (August): 578-585.
Caldwell Jr., R. 2009. The Effects of University Affirmative Action Policies on Human Capital
Development of Minority Children: Do Expectations Matter? Unpublished manuscript,
Department of Economics, University of Kansas, Lawrence.
Cameron, S. V. and J. J. Heckman. 2001. The Dynamics of Educational Attainment for Black,
Hispanic, and White Males. Journal of Political Economy 109 (June): 455-499.
Carneiro, P., and J. J. Heckman. 2003. Human Capital Policy. National Bureau of Economic
Research Working Paper No.9495.
Chiswick, B. R. 1988. Differences in Education and Earnings Across Racial and Ethnic Groups:
Tastes, Discrimination and Investment in Child Quality. Quarterly Journal of Economics
103 (August): 571-597.
The Journal of Blacks in Higher Education. 1997. The Effect of Higher Education on Interracial Marriage. 16: 55-56.
Gould, E. D., and M. Daniele Paserman. 2003. Waiting for Mr. Right: Rising Inequality and
Declining Marriage Rates. Journal of Urban Economics 53: 257-281.
Gullickson, A.. 2006. Education and Black -White Interracial Marriage. Demography 43
(November): 673-689.
Heckman, J. J. 1979. Sample selection bias as a specification error. Econometrica 47 (January):
153–161.
Houseworth, C. A. 2008. Human Capital and Interracial Marriage in the United States.
Unpublished Manuscript.
Jacobsen, J., C. Olsen, J. King Rice, S. Sweetland, and J. Ralph. 2001. Educational Attainment
Report (July).
Jones, C. Bland, and M. Gates. 2004. Gender-Based Wage Differentials in a Predominantly
Female Profession: Observations from Nursing. Economics of Education Review 23(6)
(December): 615-631.
Lichter, D., F. LeClere, and D. McLaughlin. 1991. Local Marriage Markets and the Marital
Behavior of Black and White Women. American Journal of Sociology 96(4) (January):
843-867.
Linsenmeier, D., M., H. S. Rosen, and C. Elena Rouse. 2002. Financial Aid Packages and
College Enrollment Decisions: An Econometric Case Study National Bureau of
Economic Research Working Paper No 9228.
Neal, D. A. 2004. The Measured Black-White Wage Gap among Women Is Too Small. Journal
of Political Economy 112 (February): 1-28.
Neal, D. A. and W. R. Johnson. 1996. The Role of Premarket Factors in Black-White Wage
Differences. The Journal of Political Economy 104 (October): 869-895.
Oaxaca, R.. 1973. Male-Female Wage Differentials in Urban Labor Markets. International
Economic Review 14 (October): 693-709.
O’Neill, J., and D. O’Neill. 2005. What do Wage Differentials tell us about Labor Market
Discrimination? NBER Working Paper 11240.
Qian, Z..1997. Breaking the Racial Barriers: Variations in Interracial marriage Between 1980
and 1990. Demography 34 (May): 263-276.
Orfield, G., and C. Lee. 2005. Why Segregation Matters: Poverty and Educational Inequality.
Harvard Civil Rights Project.
Labor Economics 27(3): 385-437. 4 (May): 263-276.
Urzua, S. 2008. Racial Labor Market Gaps The Role of Abilities and Schooling Choices. The
Journal of Human Resources 43(4): 919-971.
Veneri, C. M. 1999. Can Occupational Labor Shortages be Identified using Available Data?
Table 1: Mean and Median Black-White Female Nursing Wage Gap
Race Mean Wage
Median Wage
Black (n=1,147) 29.37 27.20
White (n=22,375) 27.06 25.00
Wage Gap (Black/White) 1.09 1.09
By education Mean Wage
Median Wage Associate's Degree or Diploma
Black 27.80 25.94
White 25.32 23.55
Wage Gap 1.10 1.10
Bachelor's Degree
Black 29.32 27.78
White 27.05 25.00
Wage Gap 1.08 1.11
Graduate Degree
Black 34.61 31.16
White 33.81 31.25
Wage Gap 1.02 1.00
Source - National Sample Survey of Registered Nurses, 2004
Notes: Only includes those employed in nursing at the time of the survey. A Diploma degree is a 3-year degree
Table 2: Labor Force Participation Rates for Female Registered Nurses by Race and Family Structure
Children under age No Children under 18 in Home age 18 in home Labor Force Status All Married Not Married Married Not Married Black (number of observations; % of total) 1,301 34.82% 16.60% 21.75% 26.83%
Employed in Nursing 77.79% 80.13% 78.24% 74.56% 77.08%
Employed Outside of Nursing 5.23% 4.19% 3.24% 6.01% 7.16%
Unemployed but Looking for a Nursing Job 11.15% 10.82% 12.96% 10.60% 10.89%
Not in Labor Force 5.84% 4.86% 5.56% 8.83% 4.87%
White (number of observations; % of total) 26,108 39.23% 18.75% 34.91% 7.11%
Employed in Nursing 77.21% 78.95% 75.86% 75.29% 80.60%
Employed Outside of Nursing 7.63% 6.69% 8.23% 8.55% 6.68%
Unemployed but Looking for a Nursing Job 6.64% 6.17% 9.07% 5.40% 8.89%
Not in Labor Force 8.53% 8.19% 6.84% 10.76% 3.83%
Table 3: Descriptive Statistics by Race Variable Name Black Females White Females Family Resources used to pay for R.N. education 0.290 0.488
Experience 15.178 16.571
Marital Status
Married 0.566 0.741
Single 0.178 0.082
Divorced/Separated/Widowed 0.257 0.177
Child in home
Youngest Child in Home Under Age 6 0.167 0.159 Youngest Child in Home Age 6-17 0.347 0.304
No child under age 18 in home 0.486 0.537
Highest Nursing Education
Associate 0.377 0.352
Diploma 0.096 0.163
Bachelor 0.380 0.351
Graduate 0.147 0.133
Region
Northeast 0.138 0.197
West 0.105 0.235
South 0.620 0.304
Midwest 0.137 0.264
Urban/Rural Status
Rural - Large 0.062 0.122
Rural - Small 0.027 0.065
Rural - Isolated 0.009 0.058
Urban 0.902 0.755
Employed in Nursing one year ago 0.902 0.876
Mobility
Moved once since becoming RN 0.367 0.336
Moved more than once since becoming RN 0.129 0.115
Not moved since becoming RN 0.503 0.548
Number of observations 1,301 26,108 Source - National Sample Survey of Registered Nurses, 2004
Table 4: Ordinary Least Squares - Log Wage Results for Registered Nurses by Race
Black White
Variable Name Coef. Std. Err. Coef. Std. Err.
Family Resources used to pay for education 0.054 0.028 ** -0.002 0.006 Experience 0.010 0.005 ** 0.015 0.001 **
Experience2*100 -0.018 0.013 -0.029 0.003 **
Married 0.016 0.033 -0.028 0.010 **
Separated 0.012 0.037 -0.007 0.011 Youngest Child in Home Under Age 6 0.066 0.036 0.046 0.008 ** Youngest Child in Home Age 6-17 0.008 0.028 0.004 0.006 Associate 0.019 0.046 -0.010 0.009
Bachelor 0.058 0.045 0.044 0.008 **
Graduate 0.207 0.050 ** 0.236 0.010 ** Northeast 0.199 0.047 ** 0.133 0.008 **
South 0.049 0.037 0.046 0.007 **
West 0.146 0.050 ** 0.115 0.008 **
Rural – Large -0.191 0.050 ** -0.111 0.008 ** Rural – Small -0.322 0.077 ** -0.131 0.011 ** Rural – Isolated -0.315 0.128 ** -0.182 0.011 ** Employed in Nursing One Year Ago 0.115 0.053 ** 0.089 0.014 ** Moved once since becoming RN 0.014 0.027 0.001 0.006 Moved more than once since becoming RN -0.085 0.038 ** 0.003 0.009 Constant 2.947 0.079 ** 2.912 0.019 **
F-statistic 7.41 154.53
Adjusted R-squared 0.962 0.115
Raw Differential 8.1
Portion Due to endowments 12.2
Portion due to coefficients 87.8 Source - National Sample Survey of Registered Nurses, 2004
Notes: Dependent variable is log hourly wage. The omitted categories are:
divorced/separated/widowed; no children under age 18 in the home; Diploma degree; Midwest; urban; and, not moved since becoming RN. Experience equals the number of years the nurse has worked at least half the year since receiving RN license. A Diploma degree is a 3-year degree program run by a hospital.
Table 5: Percent of Wage Gap Explained by Observable Characteristics
Regression Methodology
Proportion Explained
OLS (Table 4) 12.2
OLS with just family resources -21.3
OLS with just family resources, education,
marital status, and children -10.9
Correcting for Selection into Employment
Heckman Selection 5.5
Imputing Wages 9.9
Source - National Sample Survey of Registered Nurses, 2004
Notes: The number represents the proportion of the wage gap explained by the observables in the regression, using the Blinder-Oaxaca decomposition. The OLS results come from Table 4. The Heckman selection results use non-nursing household income as an instrument for labor force
Table 6: Source of Education Financing by Race and Education
Source of financing All
Associate or
Diploma Bachelor
Black White Black White Black White Loans or scholarships only 0.246 0.124 ** 0.243 0.136 ** 0.248 0.111 ** Self or family only 0.272 0.414 ** 0.324 0.435 ** 0.225 0.392 ** Employer only 0.025 0.013 ** 0.036 0.017 ** 0.016 0.008 ** Multiple sources 0.457 0.449 0.397 0.411 0.511 0.488
Source - National Sample Survey of Registered Nurses, 2004
Table 7: Descriptive Statistics by Race and Occupation – American Community Survey
Variable name Registered Nurses K-12 Teachers
Black Females
White Females
Black Females
White Females
Potential Experience 22.80 23.46 21.91 21.16
Marital Status
Married 0.54 0.73 0.54 0.75
Single 0.16 0.09 0.23 0.12
Divorced/Separated/Widowed 0.30 0.18 0.23 0.13
Children in home
Child under age 6 in home 0.16 0.15 0.12 0.14
Child aged 6-17 in home 0.33 0.28 0.26 0.28
No child under age 18 in
home 0.50 0.56 0.61 0.58
Education
Associate 0.42 0.48 0.06 0.04
Bachelor 0.43 0.39 0.42 0.49
Graduate 0.15 0.14 0.51 0.48
Region
Northeast 0.18 0.22 0.14 0.22
South 0.59 0.32 0.67 0.34
West 0.07 0.16 0.06 0.19
Midwest 0.16 0.30 0.13 0.26
Number of observations 365 6,594 479 8,594
Source: American Community Surveys, 2004-2005
Table 8: Mean and Median Black-White Female Wage Gap by Occupation, American Community Survey
Race
Mean Wage
Median Wage
Registered Nurses
Black Females (n=365) 26.86 25.19 White Females (n=6,594) 25.41 23.37
Wage Gap 1.06 1.08
K-12 Teachers
Black Females (n=479) 24.72 21.70 White Females (n=8,594) 22.49 20.36
Wage Gap 1.10 1.07
Table 9: Mean and Median Black-White Female Wage Gap and Employment Gap, American Community Survey
Race Females Males
Median Wage Employment Rate Median Wage Employment Rate
Black 13.49 59.84 14.92 64.77
White 14.51 65.69 18.60 80.98
Gap 0.93 0.91 0.80 0.80
High School Dropout
Black 8.06 31.56 10.45 39.61
White 8.76 37.52 12.09 62.54
Gap 0.92 0.84 0.86 0.63
High School
Black 10.23 54.31 12.86 62.76
White 11.16 59.87 15.35 77.10
Gap 0.92 0.91 0.84 0.81
Some College
Black 13.43 67.01 15.74 71.48
White 13.95 69.39 18.60 82.37
Gap 0.96 0.97 0.85 0.87
Bachelor
Black 18.60 78.87 20.46 81.80
White 18.60 72.75 24.39 88.43
Gap 1.00 1.08 0.84 0.93
Graduate
Black 26.14 81.44 27.41 84.36
White 24.18 78.56 32.55 88.78
Gap 1.08 1.04 0.84 0.95
Source: American Community Surveys, 2004-2005.
Figure 1: Percent of RNs who are Black and Black/White RN Wage Gap 0.0 1.0 2.0 3.0 4.0 5.0 6.0 7.0
1980 1984 1988 1992 1996 2000 2004
P e r c e n t B l a c k 1.05 1.06 1.07 1.08 1.09 1.10 1.11 1.12 1.13 W a g e G a p
% Black Median Wage Gap
Source: National Sample Survey of Registered Nurses, 1980, 1984, 1988, 1992, 1996, 2000, and
2004
Notes: Sample is restricted to black and white females, employed in nursing at the time of the