Munich Personal RePEc Archive
Impacts of Service Sector Policy
Reform:CGE model Analysis based on
Sri Lanka
Pallegedara, Asankha
20 August 2010
Online at
https://mpra.ub.uni-muenchen.de/30603/
Impact of Services Sector Policy Reforms
CGE Model Analysis based on Sri Lanka
August , 2010
Pallegedara Asankha
National Graduate of Policy Studies, Japan
Abstract
This paper investigates the macroeconomic effects of services sector reform policies
using two computable general equilibrium models of Sri Lankan economy. First model
assumes perfect competitive market and second one assumes monopoly supplier economy.
Both models have been calibrated using Sri Lanka’s social accounting matrix currently
available. Impacts of both services sector production tax reduction and import tariff
increase have been simulated. Simulation results imply that reduction of services sector
production tax is better than increase of import tariff in both perfect competition case and
monopoly supplier case.
1. Introduction
Transformation to service sector is one of the important aspects of economic policies
not only in the developed countries but developing countries. In high- income countries,
on average, services sector constitute nearly two thirds of total Gross Domestic Product
(GDP). Among low and middle- income countries, they account for a smaller share of 54
percent but still the majority of output. In East Asia, the services sector on average is
about the same size as the industrial sector, at 41 percent of GDP.In Sri Lanka 59.3
percent of total GDP is contributed by service sector (Source: National Accounts 2009).
Throughout its history, Sri Lanka has been a beneficiary of being an active partner in
global trade. In addition to being located on a very convenient naval route, conducive
policies adopted by successive rulers have been a booster to international trade, and
through it, to wealth creation. The reliance on services, especially commercial services,
for wealth creation is not a new policy paradigm for Sri Lanka. Sri Lanka which is devoid
of a sufficient natural resource base would find it difficult to enhance growth through
industry or agriculture alone. The country’s available land is limited and its population
density at over 290 persons per square kilometer is one of the highest in the world.
Another factor that has driven Sri Lanka to the services sector is the ever rising
globalization of services. Moreover, after ending 30 year internal conflict between
separatist Tamil tigers has created ideal atmosphere to improve services sector in Sri
Lanka.
So in this paper, I apply CGE model approach to Sri Lankan economy and look for new
production tax and import tariff policies to improve the services sector in Sri Lanka.I use
economy. Then compare the differences of services sector improvements based on policy
simulations.
This paper is structured as follows. Section 2 discusses the history of services sector of
Sri Lanka and related literature. Section 3 presents the model and its calibration
procedure. Section 4 provides the simulation results based on policy experiments. Finally
section 5 summarizes the results.
2. Services sector in Sri Lanka
Sri Lanka is the first country in the South Asia which started open market economic
policies. In 1977, newly elected united national party government introduced new open
market oriented economic policies. Until 1977, Sri Lanka had been following mainly
socialist economic policies based on Marxism. With the introduction of open market
economy, Sri Lankan economy gradually transforms from agriculture based economy to
more liberalized industry and service sector based economy. But economic growth has
been hampered by internal conflict started early 80s. Despite a brutal civil war that began
in 1983, economic growth has averaged around 4.5%. In 2001, however, GDP growth
was negative 1.4%; the only contraction since independence. Growth recovered to 4.0%
in 2002. Following the 2002 ceasefire and subsequent economic reforms, the economy
grew more rapidly, recording growth rates of 6.0% in 2003 and 5.4% in 2004. The
December 2004 Indian Ocean tsunami killed 32,000 people, displaced 443,000, and
caused an estimated $1 billion in damage. The tsunami's overall economic impact was
less severe than originally feared, with the economy growing by 6% in 2005 and 7.7% in
a positive growth rate of 3.5 percent for the year 2009.This economic performance has to
be considered as a very satisfactory achievement considering the global economic
recession. Table 1 shows the Sri Lanka’s GDP by three main sectors.
Table1: Sri Lanka GDP by sectors (%)
Source: Central bank of Sri Lanka (2009)
As we can see from table 1, the services sector contributes the highest percentage of Sri
Lankan gdp in the last decade. Agriculture sector contribution had been declining year by
year. On the other hand Services and Industry sector contribution had been increased.
Moreover, the major division of economic activities, namely, Agriculture, Industry and
Services registered positive growth rates of 3.2 percent, 4.2 percent and 3.3 percent
respectively(Source :Sri Lanka National Accounts,2009). The percentage share of the
three major sectors, the agriculture, industry and services to the total National Income
more or less remained unchanged being 12.0 percent, 28.6 percent and 59.3 per cent.
The main components of Sri Lanka’s services sector are tourism, banking, finance,
shipping, aviation and retail trade. Being situated as a small island country in northern
part of Indian Ocean, It has a very good position to develop services sectors. Sri Lankan
government recently started constructing new international harbor and air port to boost
the shipping and aviation services. Financial services are another valuable sector which
has got attention by global firms. Sri Lanka’s financial sector comes under the purview of
the Central Bank of Sri Lanka. Liberal policies and a lucrative business environment have
Year 2001 2002 2003 2004 2005 2006 2007 2008 2009 Agriculture 20.1 14.3 13.7 13 12.5 12.3 11.9 12.1 12
Industry 26.8 28 27.7 27.7 28.1 28.2 28.5 28.4 28.6
made the island nation an attractive location for several global banking firms to set up
operations, complementing a strong local network of investment and commercial banks.
On the other hand, Sri Lanka’s IT industry has made rapid progress in the past decade,
becoming a vibrant sector in the country and the region. The significant inroads has
prompted growth and development in IT-related services as well as IT education. The
sector has become particularly popular among the country’s younger generation who
have given prominence to improving their skills and knowledge in IT-related products
and services. India’s recent success as a global IT giant also gives valuable chance to
develop information and communication technology (ICT) services in Sri Lanka.
3. Model and Calibration
To quantify the possible impact of service sector tax policies in Sri Lanka, we employ a
static computable general equilibrium model for Sri Lankan economy. Following hosoe
and others (2010), two computable general equilibrium (CGE) models have applied to Sri
Lankan economy. The first model is based on perfect competitive market economy and
second one based on monopoly market where each sector only has one supplier. Basically
these models provide an internally consistent economy-wide framework for policy
analysis, in considering internal and/or external shocks to an economy on macro and
micro economic variables.
3.1 Model Structure
The model includes four types of institutions: households, firms, the government and
the rest of the world. Production sectors categorized in to Agriculture, Manufacturing and
goods and services, and provides transfers to household groups or firms. The economy is
also involved in transactions with the rest of the world: exporting or importing goods and
services, receiving or sending transfers and grants. Household owns the capital and labor.
Labor is divided in to 2 categories; skilled labor and unskilled labor.
All the agents of the model maximize their objectives. While Households maximize
their utility, producers maximize their profit. Firms optimize labor according to wage,
equalizing the value of the marginal product of labor with its wage rate. While basic
structure for both perfectly competitive market economy model and monopoly market
economy model are same, in the latter model i-th sector has only one monopoly supplier.
Figure 01: Structure of CGE Model
SRV
Y
SRV SRV
X , XSRV,NON−SRV
SRV
Z
SRV
E DSRV QSRV
SRV
Q
v SRV
X XSRVg
UU=Utility
Services Sector
SRV ULAB
F , FSLAB,SRV FCAP,SRV
p SRV
Table 2: Description of Model
Variable Description
SRV CAP
F , Capital used in Services sector
SRV SLAB
F , Skilled Labor used in Services sector
SRV ULAB
F , Un-Skilled Labor used in Services sector
SRV
Y Composite factor of Services sector
SRV Non
Y
− Composite factor of non-services sector
SRV SRV
X , Intermediate Service sector products used in Services sector
SRV SRV Non
X ,
− Intermediate non-service sector products used in services sector
SRV Non SRV
X
−
, Intermediate services sector products used in non-services sector
SRV Non SRV Non
X − , − Intermediate non-services products used in non-services sector
SRV
Z GDP of services sector
SRV Non
Z − GDP of non-services sector
SRV
E Exports of Services sector products
SRV Non
E
− Exports of non-services sector products SRV
D Services sector products for domestic usage
SRV Non
D − Non-services sector products for domestic usage
SRV
Q Imports of services sector products
SRV Non
M
− Imports of non-services products
SRV
Q Armington’s composite Services sector goods
SRV Non
Q − Armington’s composite non-services sector goods
v SRV
X Investment of services sector goods
v SRV Non
X −
Investment of non-services goods
g SRV
X Government consumption of services sector goods
g SRV Non
X − Government consumption of non-services goods
p SRV
X Household consumption of services goods
p SRV Non
X −
3.2 Calibration
The model has been calibrated using Sri Lanka Social Accounting Matrix. The SAM
has been obtained from GTAP database. The base year for this SAM is year 2000. All the
parameters and initial values for the variables used in the model have been calibrated
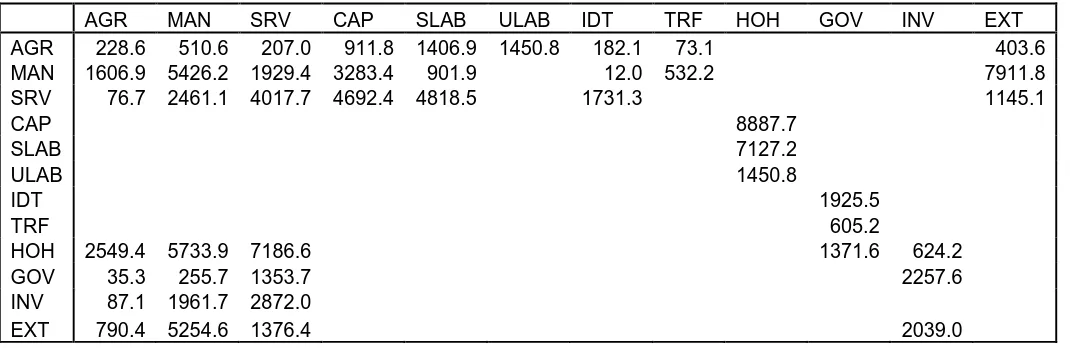
using this SAM. The detailed SAM is shown in Table 3.Gams computer code has been
[image:10.612.42.577.281.455.2]used for calibration and policy simulations.
Table 3: Sri Lankan Social Accounting Matrix (values are in millions of Rupees)
4. Simulations Results
Several policy experiments have been simulated using both perfectly competitive
market model and monopoly market model. First we checked the macroeconomic impact
of production tax rate reduction of services sector by simulating several scenarios. Next
we checked the impact of import tariff rate increase in services sector.
AGR MAN SRV CAP SLAB ULAB IDT TRF HOH GOV INV EXT
AGR 228.6 510.6 207.0 911.8 1406.9 1450.8 182.1 73.1 403.6
MAN 1606.9 5426.2 1929.4 3283.4 901.9 12.0 532.2 7911.8
SRV 76.7 2461.1 4017.7 4692.4 4818.5 1731.3 1145.1
CAP 8887.7
SLAB 7127.2
ULAB 1450.8
IDT 1925.5
TRF 605.2
HOH 2549.4 5733.9 7186.6 1371.6 624.2
GOV 35.3 255.7 1353.7 2257.6
INV 87.1 1961.7 2872.0
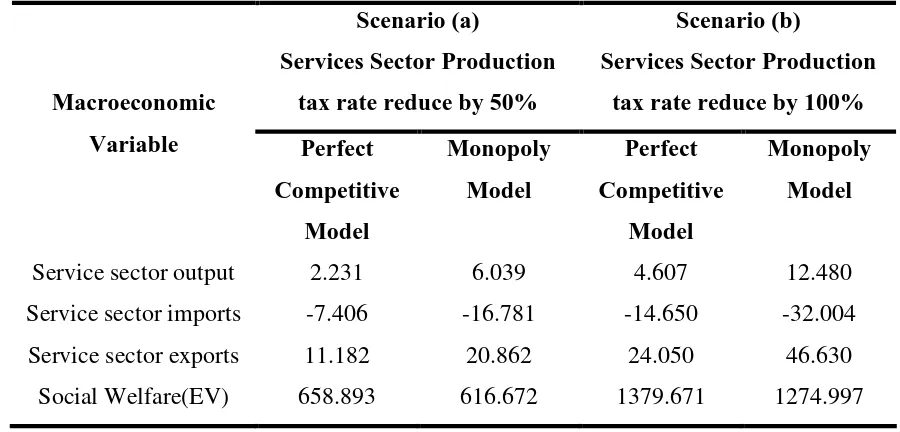
4.1 Macroeconomic Impacts of Production tax rate reduction of services sector
We have conducted several simulations of tax rate reduction scenarios in the services
[image:11.612.79.529.182.398.2]sector. Table 4 presents the macro economic indicator results of these scenarios.
Table 4: Macroeconomic impacts of production tax policies (% change to base case)
Scenario (a)
Services Sector Production tax rate reduce by 50%
Scenario (b)
Services Sector Production tax rate reduce by 100% Macroeconomic
Variable Perfect
Competitive Model
Monopoly Model
Perfect Competitive
Model
Monopoly Model
Service sector output 2.231 6.039 4.607 12.480
Service sector imports -7.406 -16.781 -14.650 -32.004
Service sector exports 11.182 20.862 24.050 46.630
Social Welfare(EV) 658.893 616.672 1379.671 1274.997
Source: Model simulation results.
Simulation results indicate that reduction of services sector production tax rate by 50%
will increase services sector output by 2.23% in under the perfectly competitive market of
suppliers. But under the monopoly market model this will increase by 6.04%.So impact is
larger under the production sector monopoly. These values will be approximately
doubled when tax rate reduced by 100% to zero production tax rate. With the effect from
this policy imports of service sector will be reduced in both models as expected. But
again under the monopoly decrease will be higher than perfectly competitive market
economy. Because reduction of production tax gives service sector producers an
incentive to produce more products they can export more to rest of the world. We can see
this from our simulation results. The larger the reduction of production tax rate on
reduction of production tax rate in services sector will give higher social welfare
(Hicksian equivalent variation :EV).This increase will be higher under the perfect
competitive model as expected as under the monopoly supplier model some of the
monopoly rent will be taken by producers. Moreover, higher reduction of production tax
rate in service sector will generate higher social welfare under both perfect competitive
and monopoly models.
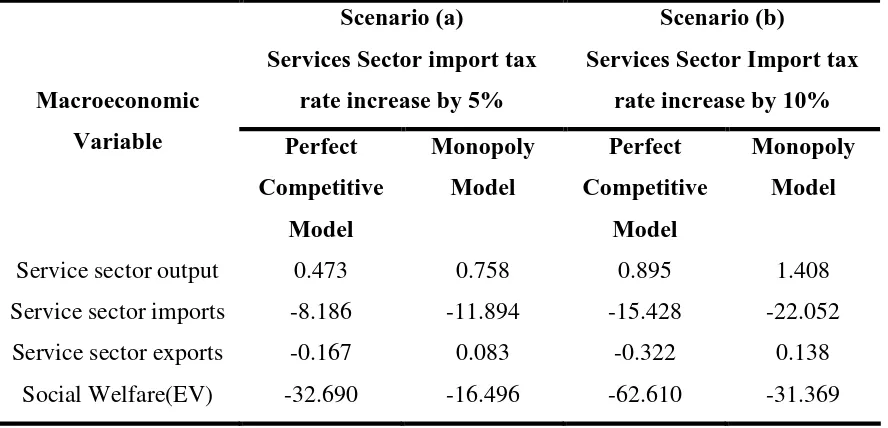
4.2 Macroeconomic Impacts of import tariff rate increase of services sector
Next we conducted several simulation scenarios of increase of import tariff in the
services sector. First scenario is increase of services sector import tariff by 5% .Second
scenario is import tariff increase of 10%.Table 5 gives results for these two scenarios
[image:12.612.87.531.404.618.2]under the monopoly model and perfect competitive model separately.
Table 5: Macroeconomic impacts of import tariff policies (% change to base case)
Scenario (a)
Services Sector import tax rate increase by 5%
Scenario (b)
Services Sector Import tax rate increase by 10% Macroeconomic
Variable Perfect
Competitive Model
Monopoly Model
Perfect Competitive
Model
Monopoly Model
Service sector output 0.473 0.758 0.895 1.408
Service sector imports -8.186 -11.894 -15.428 -22.052
Service sector exports -0.167 0.083 -0.322 0.138
Social Welfare(EV) -32.690 -16.496 -62.610 -31.369
Results imply that with the increase of import tariff in services sector by 5%, services
sector gross output will be increased by 0.47% in the perfect competitive case and 0.76%
import tariff rate doubled. So we can think that import tariff on services sector give an
incentive to domestic services sector producers to produce more as price competition will
be lower when tariff increase. We can see services sector imports will be reduced as
expected in both perfect competitive and monopoly cases. Interestingly, services sector
exports increased slightly only under monopoly model. Under the perfect competitive
case increase of import tariff will reduce exports as well. The higher the import tariffs in
service sector the lower the exports from service sector. In both scenarios social welfare
will be decreased due to the import tariff increase. Moreover, Social welfare will be
worsening under perfect competitive production model.
5. Conclusions
This paper examined the impact of production tax policies and import tariff policies in
the Sri Lankan services sector on a general equilibrium framework. Several policy
experiments had been conducted for both perfect competitive production model and
monopoly production model. We found that production tax reduction of services sector
increases the output of the services sector in both perfect competitive and monopoly
models. Social welfare also improved in both cases with reduction of services sector
production tax rate. We also found that increase of import tariff in services sector
increase the services sector output slightly. But in this case social welfare has been
decreased considerably.
So according to these results, we can say that reduction of services sector production
tax rate is more effective to improve the Sri Lankan services sector. Sri Lanka should
References
Input Output table for Sri Lanka, (2005).Macroeconomic Policy Series No.16.
Institute of Policy Studies Research Studies, Sri Lanka.
Nobuhiro Hosoe, Kenji Gasawa and Hideo Hashimoto (2010). Textbook of Computable
General Equilibrium Modeling .Programming and Simulations.
Palgrave Macmillan.England.
Somaratne, W.G. (1998).Policy Reforms and the Environment:
General Equilibrium Analysis of Land Degradation in Sri Lanka.
Unpublished PhD Thesis, School of Business, LaTrobe University,
Bundoora,Australia.
Sri Lanka National Accounts (2009), Department Statistics, Sri Lanka.
The Consumer Finances and Socio-economic Survey Report 2003/04 – Part I,