http://dx.doi.org/10.4236/oje.2016.66029
How to cite this paper: Bahadori, B. and Boynagryan, V. (2016)Evaluation of Ecology, Land Uses in Different Parts and the State of the Land Uses’ per Capita of Ahwaz City. Open Journal of Ecology, 6, 288-302.
http://dx.doi.org/10.4236/oje.2016.66029
Evaluation of Ecology, Land Uses in Different
Parts and the State of the Land Uses’ per
Capita of Ahwaz City
Bahman Bahadori*, Vladimir BoynagryanDepartment of National Geography, College of Geography and Geology, Yerevan State University, Yerevan, Armenia
Received 5 April 2016; accepted 9 May 2016; published 12 May 2016
Copyright © 2016 by authors and Scientific Research Publishing Inc.
This work is licensed under the Creative Commons Attribution International License (CC BY).
http://creativecommons.org/licenses/by/4.0/
Abstract
There has been a progressively rivalry among different cities for attaining development oppor-tunities and attraction of economic and social capitals in the recent years. In this universal rivalry, the quality of spaces and urban design are considered as key factors for evaluating cities. There-fore, in this research in order to comprehend the spatial deficiency of the public welfare services in different regions of Ahwaz city, issues such as land uses in different parts of the city, the state and per capita of land uses in the city and comparison of the current land uses with per capita of Comprehensive Plan approved in 1988 are analyzed. Also, evaluation and comparison of the land uses distribution state in different parts of Ahwaz in form of different regions of the city, popula-tion distribupopula-tion in those regions, residential spaces distribupopula-tion in the regions, commercial spac-es distribution in the regions, educational spacspac-es distribution in the regions, religious, sanitary and therapeutic, athletic, administrative spaces, green spaces and other spaces distribution in the different regions are also evaluated in this research.
Keywords
Ecology, Land, Ahvaz City, Geography
1. Introduction
are so complicated and overlooking them will add on economic and social problems. So, for attaining a stable development trend, geographical studies and researches can be useful here.
Cities are regarded as the main residence for cultural and industrial communities. City is the work, education and recreation place for citizens. It is a base for people’s interactions, creating cultural structure for communities, and bonding people to each other, which have been the reasons of civilization in most of the cases. In this envi-ronment, all the actions and reactions between people and groups need defined and appointed spaces, and these should have proper quantity and quality related to their usages.
Urban development in the last decades has been in a way that has led to the unbalanced usage of urban lands and, as a result, has changed villages into cities and small cities into mega cities. This has forced planners to meet these challenges and let them know their important duty in which they should protect security, serenity and welfare of residents from being affected by these inconsistencies. Therefore, they should always try to provide more accurate plans that are consistent with location and time conditions.
The world is rapidly changing. Generally, the affective factors causing changes in phenomena can consist of two natural and human categories. Natural and human factors have different effects on phenomena and features in different locations and times. Based on the extent of mentioned effective factors, trend and form of changes will differ. In some cases, natural and human factors help each other to change a phenomenon or a feature, and in some other situations they neutralize each other’s effect. In extensive scales, earth is considered as a source and land use as usage of this source, but in urban scales, instead of evaluation of earth based on productive power of soil or so, rather it is evaluated based on power of using soil trend for basement of different activities. Using land uses maps, main characteristics of regions can be known. In the same extent that land uses and land coverings maps have special importance, knowledge of land use changes in certain duration is also important.
Remote sensing has had applications in detecting and recovering changes through data and in evaluating changes of the land uses and so on. Using data from satellite images has prevailed in the world, since it has a universal view of phenomena and land sources, records characteristics of phenomena, gains needed information by electromagnetic waves and spectrums, reflects phenomena by detectors, and finally analyzes them by com-puter software and hardware.
2. Subject Literature
Industry growth and GIS have been in line with each other in the 1980’s and 1990’s. Growth speed in all sys-tems increased in 20th century and finally a free growth with open source (through internet) for GIS was created, like Grass GIS and Quantum GIS, which flows in a scientific system. The following instances can be mentioned regarding Iran:
-Mahmoudizadeh presented his master degree thesis entitled” usage of multi-temporal satellite data in GIS aiming evaluation of Tabriz’s land use changes”. This project was aimed at modeling physical extension of city Tabriz in terms of land use changes attained from multi-temporal images of detectors alongside digital maps and finally it was witnessed that significant changes in land uses had taken place.
-Rahimiyon through researches about Tehran, first evaluated the city based on natural and human factors and then explained the urban land uses in different parts and analyzed them via digital data and images. He created original, auxiliary and base maps, then analyzed them using geographical software and at the end presented the sample maps for residential development for the city Baghershahr [1].
-Ziya’iyanin his doctorate thesis entitled “digital methods for detecting changes in urban areas using Remote Sensing data” first discussed the necessity of using these methods for cities, towns, etc., and discussed the rea-sons for increasing urban problems which have been as a result of migration, increase in growth of city’s popu-lation and so on. In this thesis, multi-temporal and multi-spectrum satellite data have been used and applied on India’s Madras city. The period during which the research took place was from April 1933 to April 1994 and 1995, and it was by India’s IRS satellite and LIS II detector. At the end, he analyzed landuses and covering changes, and therefore it was known that sea’s water has advanced and moved toward the littoral areas in a re-gion with nearly 10 kilometers in the fishing littoral areas over a course of 20 years, which it made this place as a tourist-attracted region. Finally, he concluded that most of the changes had occurred in Madras coastline areas
[2].
and at the end providing land uses, covering changes maps and preparation of output maps were performed [3].
3. Research Methodology
The aim of this research is to evaluate the ecology condition, land uses in different parts of the city and the state of distribution and land uses per capita in city Ahwaz. The data collection tools are as follows:
Topography maps: These maps were used as study base and general structure for geo-referencing satellite images and other scanned maps. In this research two types of topography maps on a scale of 1:5000 and digital maps in a scale of 1:25,000 were used.
Geological maps: For evaluation of tectonic and geology condition of studied areas, geology maps in small and medium scales like 1:25,000 and 1:100,000 and in large and applied scales like 1:25,000 and 1:10,000 from Oil Ministry were used.
The used images were acquired by Landset, IRS, and Spot satellites. Evaluation of Karoun River, from the beginning of the city to the end of its limitation was carried out by aerial photos taken in year 1955.
4. Findings
Ahwaz is the center of Khouzestan province, with an area of 222 square kilometers and service limitation of 300 square kilometers and 895 square kilometers of shielding region is the largest city of Khouzestan. The city is lo-cated in 31 degrees 20 arcminutes N latitude and 48 degrees 40 arcminutes E longitude, and in an 18 m above sea level flat. The city of Ahwaz has common borders with cities of Sheyban, Veys, Molathani, Shoushtar, Dezfoul, Shoush from the north, Ramhormoz from the east, Hamidiyeh and Dasht-e-Azadeghan from the west, and Shadeghan, Mahshar and Abadan from the south. The city has 8 municipality regions each of which has three or four zones.
Khouzestan province has an area of 64,664 square kilometers and is located between 30 degrees 5 arcminutes and 32 degrees 30 arcminutes N latitude and between 47 degrees 40 arcminutes and 49 degrees 50 arcminutes E longitude. The province has common borders with Lorestan province from the north, the country of Iraq and Ilam province from the west, Persian Gulf from the south, and Chahar Mahalva Bakhtiyari and Kohkiloyehva Boyer Ahmad provinces from the north. This Plateau is a plain, featureless, and almost squared land. Its North side width is 110 KMS and the distance between North side and sea is 200 KMS. The height of north side from mean sea level is 180 Meters (Ahvaz Comprehensive plan). Khouzestan province’s roughness can be categorized into two regions; Mountainous region in north and east of the province and the plain region (Khouzestan Plateau).
The high northern and eastern part of Khouzestan is a part of western Zaghros southern regionand these heights gradually decrease toward the Plateau and is disconnected by river. Direction of these wrinkles is toward Northwest, which gradually changes toward South. Mountains such as Chou, Zardkuoh, Savish, Bahl’ hava, Mi’yangran, Monghasht, Mamazad, Siyah and Chal are among the most significant mountains of this region. The sole internal heights of Khouzestan are a range of heights that are placed in center of province. These ranges of heights have begun from 32 kilometers from east of Karoun river and are disconnected by Karoun river and then continue to the Northwest up to the Karkheh river. The elevation of these heights does not excess 120 meters.
There are vast wetlands in the flat of Khouzestan, which are created due to the low elevation of the plain by the sea and in some parts due to the river stream, and because of having permanent water are called Hoor (la-goon). Hoorolazim, Mishan, Miyan’garan and Shadegan are the most important hoor’s (lagoons) of Khouzestan. Shadegan lagoon is located next to the Karoun River and Karoun’s spates in the time that the water is high used to enter into this lagoon in the past. The depth of water in the deepest part of these lagoons is mostly less than 10 meters (Map 1).
In different parts of the city due to erosions and fractures, the height of Karoun River’s bed would be less than its adjacent areas, but the elevation difference is not so high as to prevent the arrival of the flood during heavy rains and, as a result, river’s water will rise and flow in the city during the rainfalls.
In the southeastern parts of the city Karoun mountain with a height of 120 meters and a in the northwest side of city vast area of sand dunes with a height of approximately 50 meters are located (Map 2).
Map 1. Elevation information of Ahvaz (author).
Comprehensive plan).
The city Ahvaz, in general, has no considerable relief, except Karoun Mountain, and topography factor hasn’t been a forming factor or a hindrance in development. One of the most important issues in Ahvaz that is asso-ciated with its topography is the issue of surface water guidance, which causes severe damages to the city and the life of citizens during rainfall and also causes severe problems to sewage disposal system.
Evaluation of land uses in city Ahwaz in terms of area and per capita
Map 2. Ahvaz slope map (author).
forms constructed area of the city (Ahvaz Comprehensive plan).
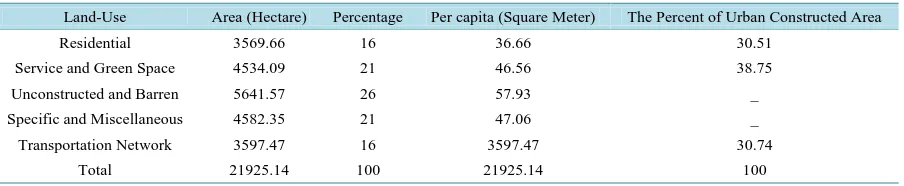
Presenting an image from condition of earth usage in the city, urban land uses, and specific and un-urban land uses have been distinguished from each other. Specific land uses include military, agricultural, livestock, river and miscellaneous land uses. Other service and green spaces land uses are considered in the next category. Thus, in the first step for comprehending how to use lands in the city, five land use groups are considered as follows
(Table 1).
• Residential land uses including houses and housing compounds.
• Service land uses including welfare and infrastructure services and recreational and green space areas. • Transportation network from main roads and highways to the local access roads.
• Specific land uses including agricultural, military, livestock, river and miscellaneous land uses. • Barren and unconstructed land uses including barren lands and abandoned places.
Table 1. Land uses distribution in the city of Ahwaz (Ahvaz comprehensive plan).
The Percent of Urban Constructed Area Per capita (Square Meter)
Percentage Area (Hectare) Land-Use 30.51 36.66 16 3569.66 Residential 38.75 46.56 21 4534.09
Service and Green Space
_ 57.93
26 5641.57
Unconstructed and Barren
_ 47.06
21 4582.35
Specific and Miscellaneous
30.74 3597.47 16 3597.47 Transportation Network 100 21925.14 100 21925.14 Total
lands which mainly are concentrated in form of heavy industries in east and Southwest of the city form 10.5 square kilometers of the city. Green spaces which have an area of 7.5 square kilometers lack a balanced distribu-tion in the city and most of them are located in margin area of Karoun River and in regions 3 and 8 (Table 2).
Population density index shows the immobile population compressibility based on the area of the region. The evaluation of the overall density of population in the city indicates that the most compact regions of the city are located in center and southeastern part of the city. Regions 1, 7 and 6 have the most density of Ahvaz. The den-sity of the regions ranges from 59 to 116 persons in hectare. Their neighbor regions, which are regions 3 and 4, are in the next place and have a density of 45 people in hectare. Other regions possess less than 42 people in hectare density (Map 3).
Areas dedicated to commercial land use in Ahvaz shows that commercial activities are mainly concentrated in the center of city (CBD in the region 1) and city center has a 31 percent of the commercial activities. In the next places, regions 6 and 5 possess the most amounts of this land use. Nearly 24 percent of the commercial activities happens in the region 6 and mainly are in form of repair activities in the vicinity of the Khoramshar Street
(Diagram 1 & Diagram 2).
At present, per capita of higher education in Ahvaz is 3.24 square meters. The area allocated to public higher education in the city indicates that about 88 percent of the higher education level belongs to the Zone 4. The high percentage of this land use in the region 4 is due to the high area of Shahid Chamran University, in a way that this academic complex includes about 71.5 percent of higher education area in the city. In the next place, region 5 possesses 6.5 percent of this land use (Map 4&Diagram 3).
Study of distribution state and area of the lands dedicated to religious spaces in the city shows that this land use enjoys relatively balanced distribution in the city. The amount of area and per capita dedicated to religious land use shows that region 1 allocates 33 percent of the whole religious areas of the city.
Surveys show that therapeutic land use distribution among the regions of the city is highly unbalanced. Ap-proximately most of the therapeutic spaces are located in regions 3 and 4. In this regard, these regions per capita are respectively 2.17 and 2.12 square meters that is higher than average per capita of this land use in the city, which is 1.18 square meters.
Evaluation of the athletic land uses in the city shows that the most areas of this land use is located in region 4, which is about 32 percent of the athletic space in the city. Per capita of athletic space in this region is 1.9 square meters that is higher than average city’s per capita, which is 2.35 square meters. Despite the fact that region 4 allocates the highest amount of this land use, the most athletic per capita, which is 2.22 square meters, is located in region 8, which is 25 percent of the whole area of this land use in the city. Regions 3 and 7 with per capita 1.13and 1.05 square meters enjoy a relatively proper amount of per capita. Other regions have very low athletic space per capita (Diagram 4 &Diagram 5; andMap 5).
Distribution of administrative spaces in the city
Ahvaz city has a relatively concentrated administrative center. Area and distribution of the administrative land use in region of city shows that the most administrative activities such as state departments, work offices and companies are concentrated in the Amaniyeh district, which is located in region 2 (Map 6).
Distribution of green spaces in Ahwaz regions
Table 2. Area and per capita of land uses in the city (Ahvaz comprehensive plan).
Percentage Per capita (Square Meter)
Area (Hectare) No. Land-Use Row 16.28 36.66 3569.66 151848 Residential 1 0.7 1.58 153.55 4048 Commercial 2 0.83 1.87 182.36 616 Educational 3 1.44 3.24 315.46 41 Higher Education 4 0.14 0.32 31.29 286 Religious 5 0.18 0.41 39.6 69 Cultural 6 0.11 0.24 23.06 35 Tourism 7 0.52 1.18 114.47 106 Health 8 0.02 0.04 3.57 1 Recreation 9 1.04 2.35 228.74 99 Sports 10 1.42 3.19 310.82 333 Office 11 3.38 7.61 741.24 668 green space 12 11.35 25.56 2489.25 74 Military-police 13 4.79 10.78 1049.85 654 Industrial 14 1.36 3.06 298.15 89
Municipal Facilities and Equipment 15
2.22 3.06
487.35 1071
Transport and Storage 16
25.32 5.00
5551.51 3358
Unconstructed and Barren 17 16.41 36.94 3597.47 0 Road Network 18 0.00 0.01 0.56 0.56 Public-Social Services 19 5.06 11.39 1109.17 1 River 20 4.09 9.21 896.57 16 Agriculture 21 1.50 3.37 328.04 20 Gardens 22 1.50 0.00 0.32 1 Livestock 23 0.51 1.15 111.55 4895 Commercial Complex 24 0.87 1.97 191.71 3066 Under Construction 25 0.41 0.92 90.06 351
Abandoned and Dilapidated 26 0.00 0.01 0.63 0.63 Other Miscellaneous 27 0.04 0.09 9.13 36 Other 28 100.00 225.15 21,925.14 171803 Total 29
Distribution of industrial land use in the Ahwaz’s regions
Area allocated to industry land uses and workrooms show that the region 8 along the Imam Khomeini street and the global railroad (Bandar-e-Imam Road) are the main concentration of heavy industry in the city of Ahvaz. This region’s per capita amounts to 43.65 square meters that is far more than average city’s per capita, which is 10.78 square meters (Diagram 6 &Map 8).
Barren lands distribution in the regions of the city of Ahvaz
Map 3. Current Ahvaz’s land uses (Ahvaz comprehensive plan).
Diagram 1. Population gross density in Ahvaz’s regions (author).
Map 4. Commercial land use distribution in the city Ahvaz (author).
Diagram 3. Educational per capita in the city Ahvaz (author).
Diagram 5. Religious land use per capita of Ahvaz’s regions (author).
Map 5. Higher education distribution in Ahvaz’s regions (author).
Distribution of urban infrastructures in the city’s regions
Study of the state of area and distribution of allocated lands to the urban infrastructures in the districts of the city shows that the most area and per capita of this land use is located in region 3 with per capita of 10.85 square meters, and region 5 with 9.53 square meters is in the next place (Diagram 7).
The state of urban wastes and their landfill
Ahvaz city with a population of more than 1,100,000 people and about 222 square kilometers area produces approximately 800 tons of household wastes per day. Each person produces about 730 grams waste per day and municipality collects the waste once per day in residential area and sometimes twice in commercial area.
The waste is collected by mechanized vehicles in most parts of the city and by traditional procedures in sub-urban and rural areas due to the technical consideration of collecting operation. Collected waste in the east of the city are carried to the sanitary landfills of the municipality in the Boroumi area and wastes in the western areas, after conveyance to the temporary places, are carried to the landfills by poisonous trailers (Ahvaz’s waste man-agement department, 2015).
The comparison of the current situation and approved Plan of the year 1988
Map 6. Administrative land use distribution in the city’s regions (author).
Map 7. Distribution of green spaces in the Ahwaz’s regions (author).
Diagram 6. Industrial land use per capita in the Ahvaz’s regions (author).
Map 8. Industrial land use distribution in the Ahvaz’s regions (author).
with proposed land uses in the Comprehensive Plan approved in year 1388 is presented the table below (Table 3).
Structure and texture of the city
Map 9. Barren spaces distribution in the regions of the city of Ahvaz (author).
Diagram 7. Infrastructure land use per capita in different regions of the city Ahvaz (author).
consistence between urban spans and centers. The main roads in the city of Ahvaz have relatively a radial struc-ture which goes out of the old center of the city that has an organic strucstruc-ture and spread around that. Except a small part of an old limitation of the city that has this organic texture and has stemmed the main roads, minor roads that define the structure and connecting state of spans and districts mainly follow a checkered pattern.
5. Discussion and Conclusions
Table 3. Comparison of current situation area and per capita with proposed land uses in the comprehensive plan approved in year 1988 (author).
Land Use Proposed Area Available Area Available Area Proposed Area Land Use −2.77 2910.27 3569.66 3569.66 2910.27 Residential −1.22 271.63 153.55 153.55 271.63 Commercial −0.1 190.95 182.36 182.36 190.95 Educational 1.07 207.40 315.46 315.46 207.40 Higher Education −0.1 41.04 31.29 31.29 41.04 Religious −0.5 88.40 39.60 39.60 88.40 Cultural 0.02 21.00 23.06 23.06 21.00 Tourist Attract on Area
−1.02 212.96 114.47 114.47 212.96 Therapeutic 0.35 291.02 228.74 228.74 291.02 Athletic 2.45 72.06 310.82 310.82 72.06 Administrative −8.31 1543.92 741.24 741.24 1543.92 Green Space 21.23 419.69 2489.25 2489.25 419.69 Military −6.48 1683.17 1049.85 1049.85 1683.17 Industrial −3.23 610.00 298.15 298.15 610.00 Urban Infrastructure −2.39 716.92 487.35 487.35 716.92 Transportation and Depot
−12.33 3724.27 2384.26 2384.26 3724.27 Street Network −2.30 223.66 0.56 0.56 223.66 Social and Public Service
−17.30 13228.36 12419.67 12419.67 108.11 Total
concentration along the river hasn’t developed, and distribution of the activities and their density is a function of a radial system. It is clear that this concentration will spread more with strengthening river role, and in case of concentration on road leading to the river and also roads along which textures depth passes, this structure will change and develop highly [4].
National resources specialists have based their works in watershed management and Soil Conservation Plans on geomorphology maps and provide erosion maps using these maps. These are result of researches that are drawn out of morphogenic phenomena of a region regarding scale and in form of clear data in terms of topogra-phy and using aerial photos [5]. The interpretation of these maps has made locating and sedimentological studies possible and preparing it has many usages and benefits in engineering projects, land use planning and manage-ment [6]. Since these maps can be used in many different contexts, being too meticulous over the precise of the methods that should be adopted isn’t desirable. In this research after preparation of geomorphology maps, land-forms and phenomena are recognized and interpreted. The city of Ahvaz and its suburb analyzed in this research are located in a flat area and is the center of the province. Ahvaz is extended on young sediments of Tertiary and is located18 meters above the mean sea level and this low elevation causes river stream to flow mildly toward the south and southwest [7] [8].
In different parts of Ahwaz, examples of social problems can clearly be seen; places for buying and selling narcotic drugs, tramp and brawl meeting, and corruption, etc. The censuses show that the social problems are rising in the city. Access to facilities and services is the most important factors that determines the social status of citizens in urban ecology of Ahvaz, while a significant proportion of the urban population of Ahvaz expe-rience failure in urban services. Literacy rate, employment rate, enjoying hygienic, therapeutic and education indexes, having municipal services such as water, gas, electricity, telephone, etc., are among the needs of civil society of Ahvaz, which have been thoroughly considered. In spite of dramatic improvements in urban services, today about 40 percent of the residents of Ahvaz don’t have proper access to health services (in terms of infra-structure and superinfra-structure), proper drinking water and optimal training services.
aerial photos, satellite images and GIS the quantity of green space on the basis of the brink of ecological factor method and using the principle of landscape ecology, organizing Ahvaz’s green spaces can be reached. The re-sults of this analysis show that for achieving ecological balance in the city center and other areas, maintenance of green spaces around the city, Karoun River and gardens and green spaces in the city of Ahvaz is needed. Moreover, the higher percentage of green spaces belongs to regions 3, 8, 5, 2, respectively.
The formation of urban heat islands has direct relationship with type of land use in these areas. In this regard, the temperature characteristics of the land uses of Ahvaz are extracted and the results show that the major indus-trial areas of the city including areas around Karoun, Khuzestan steel industries and manufacturers of pipe at the end of Golestan Blvd. have the highest average temperature.
Examining relationship between type of land uses and the surface temperature of Ahvaz with land uses tem-perature measured in the city also showed that the land uses of water and green spaces, with a temtem-perature of 27.5˚C and 33.3˚C, respectively, are minimum and industry land use, street network and wastelands with respec-tively 2.43˚C, 1.41˚C and 2.40˚C surface temperatures have highest amount of temperature, which shows that the direct relationship between the type of land use and the surface temperature of heat islands.
Uncontrolled migration growth in the recent decades towards Ahvaz and restructuring of landscape ecology caused an important structural difference in the urban and natural landscapes including crashing green and open zones, reduction of open and green spaces, playgrounds, landscape and so on. Since these elements create the environmental advantages for a city, the destruction of them has changed the ecological balance in Ahvaz city. From environmental poverty factors of Karoun River following factors can be noted:
Entrance of untreated domestic and industrial wastewater to the Karoun, lack of attention to animal and plant ecosystems, lack of attention to the water quality and how to use it, intervening in the natural and organic wastes and Karoun River edge and its bed, unprincipled construction in that area, lack of monitoring of environmental conditions of Karoun after subsiding of the great floods, pollution of Karoun river side and river bed and the lack of timely and regular dredging, germination of forests in the river bed, climate change and reduction of rainfall in the recent years and, consequently, Karoun river flow rate reduction.
References
[1] Rahimiyoun, A.A. (1998) Evaluation of Tehran’s Bagher Shahr Using Satellite Images. Shahr Negar Journal, No. 11. [2] Parviz, Z.F. (1997) Introduction Digital Image Processing a Remote Sensing Perspective. Published Thesis, Anna
University, Chennai, 45.
[3] Brandon, R. and Bottomly, B.A. (1998) Mapping Rural Land Use & Land COVER Change in Carrol County, Arkansas Utilizing Multi Temporal Land Sat Thematic Mapper Satellite Imagery. University of Arkansas of Interest, Fayetteville, Arkansas 72701.
[4] Jahani, A. (1998) Evaluation of Tehran’s Development and Changes within Years 1986 to 1997 Using Satelite Data.
Shahr Negar Journal, No. 11.
[5] Khiam, M. (1990) Scientific Application and Practical Usage of Geomorphology Maps. Geography Organization Journal, No. 2.
[6] Rajaei, A. (1991) Geomorphology Maps’ Application in Civil and Development. Geography Organization Journal, No. 3.
[7] Moghaddam, R., Hossein, M., et al. (2010) Categorization of Morphologic Limitation of Urban Development Using Satellite DEM and GIS. Geography Spatial Journal, 2, 1-15.