A Study of Feature Stability of Contact-Less Imaging
Based on Palm Vein
Weiqi Yuan1, Wei Wu1,2, Lantao Jing1, Deqi Kong1, Lili Wang1 1
Computer Vision Group, Shenyang University of Technology, Shenyang, China
2
Information Engineering, Shenyang University, Shenyang, China Email: [email protected], [email protected]
Received 2013
Abstract
Palm vein hidden under the skin and its distribution feature is hard to be stolen, which makes the palm vein recognition to be a high security biometric authentication method. Contact-less palm vein imaging can avoid the spread of disease, thus expanding the application range of palm vein biometric authentication devices. However, due to the different un- derstanding of the right imaging position and the change of fingers open degree, contact-less palm vein image acquisi- tion led to a certain degree of translation, rotation, scaling and shear, that is, the image deformation. Image deformation causes the imaging feature unstable. In this paper, the effect of image deformation to the stability of palm vein features is studied by some similarity parameters. First, feature points in the palm were marked, contact-less imaging and con- tact imaging of palm vein were acquired. Then, this paper calculated the similarity parameters of the contact-less imag- ing to contact imaging and gave corresponding analysis. Experimental results show that contact-less palm vein imaging was stable, and derived the linear regression equation of relationship between sample space and the recognition rate: y = −0.000903x + 1.0332, coefficient of determination R² = 0.9824. This research provided effective and detailed data to the study of contact-less palm vein recognition and gave powerful support to contact-less multi-feature fusion recogni- tion based on hand.
Keywords: Palm Vein; Contact-Less Imaging; Stability
1. Introduction
Palm vein is a permanence and uniqueness physiological feature of human [1,2]. Palm vein recognition as a new family of biometric technology has gained more and more attentions these years and it is expected to have a wide range of security application. From the health pers- pective, contact palm vein imaging may cause the spread of germs, resulting in resistance to some users. This problem is particularly exacerbated during the outbreak of epidemics or pandemics like SARS and Influenza A (H1N1) which can be spread by touching germs leftover on surfaces. In the outdoor environment, this contact palm vein device easily contaminated, affected its use in the access control system. Contact imaging brings in- convenience in actual use, which makes the developing contact-less palm vein recognition instruments become new direction. The “contact-less” in this research means no guidance pegs were used to constraint the position of the hand. The user’s hand can face the sensor naturally as prompt during image acquisition. Obviously this con- tact-less imaging can avoid the spread of germs and im- proves ease of use.
Like the other biometric technology, the contact-less
(a) (b)
Figure 1. NIR image of palm vein and feature point mark. (a) NIR image of palm vein; (b) bifurcation point and ending point mark.
vessels in the palm image as the feature points. The paper represents palm vein image deformation with the change of these points in the space position.
To achieve the contact-less palm vein recognition, the feature stability of palm vein is the question must be discussed firstly.
Some other literature inferred “contact-less imaging” also. Reference [6] captured the finger vein contact-less with transmission illumination method, while our capture method is reflection illumination method. Reference [7] just mentioned “contact-less image”, but not clearly ex- pressed how to realize. The contact-less imaging realized in [8] used capture window, so it was not really contact- less method. Reference [9] realized contact-less palm vein recognition with a robust processing method, how- ever, it didn’t involve the feature stability of imaging. To the best of our knowledge, there is scant research which focuses on the study of feature stability of contact-less image based on palm vein.
For fixed capture distance and illumination angle, con- tact imaging can guarantee for feature stable of palm vein image. If the contact-less imaging is more similar to con- tact image, the contact-less image is more stable. At the same time, if the inter-class distinction between images is bigger, the recognition rate is higher. To investigate the feature stability of palm vein image, this paper designs two experiments to evaluate the similarity parameter and recognition rate.
2. The Evaluation Methodology of Feature
Stability of Contact Image Based on Palm
Vein
We assume that the hands just take rigidity shape change during the acquisition process.
If extracted all feature points in palm vein image by programming, the result would be affected a lot by the algorithm of preprocessing, feature extraction and feature matching. To eliminate this effect, our research designed an experiment to measure the similarity of contact-less image to contact image. Additionally, palm vein image quality is not good enough for every person. Extracting feature points in this picture are difficult and are not ac-
curate enough. Actually, we want to get the offset of the contact-less imaging to contact imaging, rather than the actual location of feature points. Therefore, in order to remove these impacts, this paper presents a simulation of the palm vein feature point method, and accordingly de- signed two experiments.
2.1. Evaluation Methods Based on Similarity
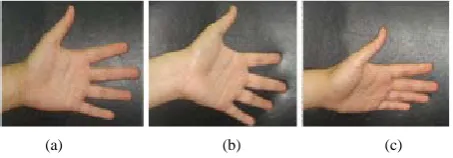
Contact-less imaging not only might lead to translation and rotation, but also scaling and shear. The scaling is caused by the different distance to sensor and the shear is caused by the angle to sensor. The shear include hori- zontal shear and vertical shear [10], shown in Figure 2. Contact imaging might lead to translation and rotation. Translation and rotation can be adjusted by the algo- rithm.
The effect on images led to the change of position of the point in palm vein. The similarity of two images can be measured by the change of position of feature points in two images. Euclidean distance is one of the most simplest and effective algorithms in measurement of the similarity of two images. This research measured the change of position of feature points in contact-less image to position of feature points in contact image by Eucli- dean distance. The similarity of contact-less image to contact image was represented by this change.
We figured 9 feature points in the hands of volunteers to represent the feature of the image of palm vein. The position of feature point has no feature of vein; it only represents the position of the point that meets some fea- ture condition. In this experiment, the feature points were just the constant points of palm vein. They represented the bifurcation point and ending point on the palm vein. The stability of these 9 feature points represented the stability of the whole image. The change of these 9 fea- ture points in contact-less image to contact image re- presented the similarity of the two images. The 9 points were specified as shown in Figure 2.
First, we drew vertical line from the heel of thumb and drew midline from middle finger, these two lines jointed in the point marked point 5. Then, we drew a square of 4 cm length of sides with the central point was point 5 and the coordinate was the heel of thumb and midline from middle finger. Last, we marked the peak of square with
(a) (b) (c)
Figure 2. Level imaging and shear imaging. (a) Level imag- ing; (b) Vertical shear imaging; (c) Level shear imaging.
[image:2.595.311.538.629.708.2]
point 1, point 3, point 9, point 7 and marked the middle point of every length with point 2, point 6, point 8, point 4. We registered contact-less image to contact image with point 5. After wiped off the deviation of rotary and translation from contact-less image to contact image, the other 8 points could represent the change from every direction.
Experiment method: Every volunteer took one contact image of palm vein, three contactless images of palm vein. After wiped off the deviation of rotary and transla- tion from contact-less image to contact image, we called it registration image. We computed Euclidean distance of 9 points in registration image to 9 points in contact image. This Euclidean distance could represent the similarity of contact-less image to contact image.
As shown in Figure 3, the coordinates of 9 character points in contact image were dot1(x1,y1), dot2(x2,y2),
dot3(x3,y3), dot4(x4,y4), dot5(x5,y5), dot6(x6,y6), dot7(x7,y7),
dot8(x8,y8), dot9(x9,y9). The coordinates of 9 character
points in registration image were dot1’ (x1’,y1’), dot2’
(x2’,y2’), dot3’ (x3’,y3’), dot4’(x4’,y4’), dot5’(x5’,y5’),
dot6’(x6’,y6’), dot7’(x7’,y7’), dot8’(x8’,y8’), dot9’(x9’,y9’).
We marked Euclidean distance of 9 points in registra- tion image to the 9 points in contact image with sum. The equation of sum was showed as (1).
9
' 2 ' 2
1
(( ) ( ) )
i
i i i i
i
sum x x y y
=
=
=
∑
− + − (1)The similarity of contact-less image to contact image was measured by the average value of Euclidean distance of 3 registration images to contact image.
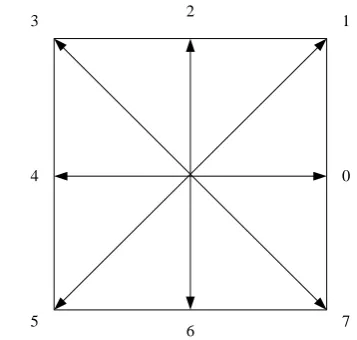
According to Equation (2), we calculate the mean val- ue of 3 Euclidean distances of registration imaging to contact imaging. This mean value measured the similari- ty of contact-less imaging and contact imaging by this experimenter. Then we calculate the changes of distance of point 5 to point 1, 2, 3, 4, 6, 7, 8, 9 separately. That is the offset of 8 directions as Figure 4.
3
1
( )
3 n
n
sum n ave
=
=
=
∑
(2)2.2. Evaluation Methods Based on Recognition Rate
This paper used recognition rate as another index to measure contact-less imaging characteristics stability. More significant the difference between the classes, (the higher the recognition rate), and the more suitable for subsequent identification.
[image:3.595.312.536.85.259.2]In this experiment, we also draw 9 points on the palm of experimenter to simulate the palm veins feature points. It had difference with the first experiment. The length and width of rectangle enclosed by point 1, point 2, point
Figure 3. 9 characteristic points on palm vein in experiment 1.
Figure 4. Schematic diagram of 8chain code.
3, point 6, point 7, point 8, point 9, and point 4 were not regular. T he second difference was the location of point 5 only enclosed in the rectangle, rather than the center, the location of the nine points shown in Figure 5.
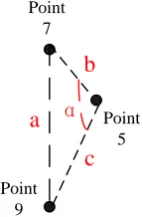
Every experiment took a contact imaging as the regis- tration, extracted the coordinates of night points of this image and stored them in the sample database. We cal- culated the degree of angle α, shown in Figure 6.
The equation was following.
2 2 2
arc cos 2
b c a bc
α = + − (3)
The degree of the angle α is also stored in the sample database. The degree of the angle α is also stored in the sample database. We took contact-less image of every experiment as the login image. Extract the degree of an- gle α, and nine coordinates of feature points as the match data.
The first step was to determine with angle α, chose images with angle of α ± 1˚ into the next match, select
Point 4 Point 7
Point 8
Point 9
Point 6 Point 6 Point 2 Point 2
Point 5
1
0
7 2
6 5
[image:3.595.329.508.298.468.2]Figure 5. 9 characteristic points on palm vein in experiment 2.
Figure 6. Schematic diagram of angle α.
minimum Euclidean distance of 9 feature points to de- termine the same person, otherwise identified as different people. Recognition rate (Recognition Rate, RR) is cal- culated as (4) [11]:
1 NFR NFA 100%
RR
NAA NIA
+
= − ×
+
(4)
NAA and NIA were the attempt times of the legitimate user and impostor in (4). NFR and NFA are times of the false rejection and false acceptance. Programmatically accomplish the above calculation.
This paper calculated the number of samples with 30, 60, 90, 120, 150, 180. With this change of samples the regular pattern could be caught.
3. Experiment and Result Analysis
3.1. Similarity Experiment
To ensure the reliability of experimental data, there were 180 volunteers participating in the experiment, including 90 women. 180 volunteers aged 20 to 40 years old. The experimenter divided volunteers into six groups of 30 people, including 15 female, each group is to meet a minimum sample space.
In our experiment, contact images were captured in the
condition of volunteer’s hand placed on the bracket. The bracket indirect under the sensor of image and the dis- tance was 10 cm. Contact-less images were captured in the condition of volunteers placed there hand under the sensor of image 10 cm, parallel his/her hand with the sensor. The five fingers of the volunteer separate natu- rally. The image resolution was 1280 × 960 pixels of two kinds of images.
First of all, Figured 9 character points on the left hand of every volunteer, just like the Figure 2 showed. Se- condly, captured 1 image of each volunteer with contact pattern and named images with An (n = 1···180). Then,
captured 3 images of each volunteer with contact-less pattern and named them with Bn1, Bn2, Bn3 (n = 1···180)
separately.
1) Step 1: Extracted coordinate of 9 character points of contact image A1 and coordinate of 9 character points
of contact-less image B11 separately. That were point sets
of a1 and b11.
2) Step 2: We accomplished registration from image B11 to image A1. Coincide the coordinate of 5th point in
image B11 with image A1. Adjusted the middle finger of
image B11 to the middle finger of image A1.
3) Step 3: In the registration image B11, the coord-
inates of 9 points maked up the point set c11.
4) Step 4: We computed the Euclidean distance of the correspond point in point sets of c11 and the point in
point set a1. Now we computed the 9 Euclidean distance
of 9 character to sum1.
5) Step 5: Followed step 1-4, settle contact-less image B12, B13 separately, then we get sum2, sum3.
6) Step 6: Ave1 represents the average value of 3
Euclidean distance of 9 points in registration image to 9
points in contact image. The equation of sum is showed as (2).
7) Step 7: In accordance with this method, the re- maining 29 samples were completed. We got ave1 ~ ave30.
8) Step 8: The remaining five groups of samples were calculated and we got the data.
3.2. Result Analysis of Similarity Experiment
To reflect the variability of 6 sets of data, we calculated a number of parameters in Table 1, including the sample mean, the sample variance, the sample standard deviation and range, the equations as following:
Sample mean:
1
1 n
i i
x x
n =
=
∑
(5)Sample variance:
(
)
2 21
1 1
n
i i
s x x
n =
= −
−
∑
(6) Point1
Point 2
Point 3 Point
4
Point 5
Point 6 Point
7
Point 8
Point 9
Point 5 Point
7
Point 9
α
b
a
[image:4.595.137.209.297.406.2]Table 1. Similarity statistical parameters of 6 group sample.
Feature Sample Mean
Sample Median
Sample Variance
Sample Standard Deviation
Sample Utmost
1 106.95 97.56 1883.28 43.40 186.81
2 107.93 97.38 1410.37 37.55 171.52
3 99.12 91.78 1538.47 39.22 166.49
4 99.77 99.77 1755.89 41.90 158.70
5 99.84 92.64 2173.68 46.62 192.63
6 97.73 89.85 1406.10 37.50 149.96
Sample standard deviation:
(
)
2 11 1
n i i
s x x
n =
= −
−
∑
(7)Sample mean in Table 1 varied between 97.73 ~ 107.93, varied in 10.2 pixels. Sample median between the range of 89.85 - 99.77, varied in 10.2 pixels. That means the sample concentration was good.
Sample variance was a way to reflect the data variabil- ity of statistical parameters, the larger the sample va- riance, the data demonstrate the variability of the group was greater. In the six groups, the sample variance and standard deviation of the fifth group were maximum, indicating some of experimenters in this group had taken too far or too near distance from requirements, see the original picture, we found that two experimenters took too far distance from the lens, resulting in the median of the group was small, but the sample variance, sample standard deviation and sample utmost were great. The same situation happened in the first group. Other groups of data indicates the majority of the experimenter could understand contact-less imaging probably accurate and the way of contact-less imaging was basically stable.
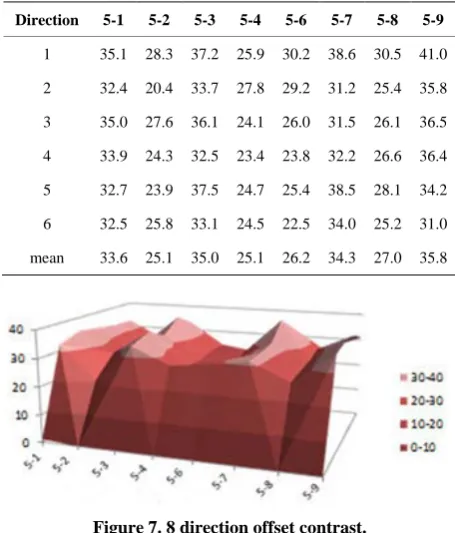
Directions offset of six groups data was shown in Ta- ble 2. In order to analyze the above six groups of data, we draw the surface figure as shown in Figure 7.
In the figure, the x-coordinate was 8 directions, the y-coordinate was offset and the unit was pixels. The three-dimensional was six groups of data in the direction of distribution. Through Figure 7, we could draw a con- clusion of offset in direction 5-1, 5-3, 5-7, 5-9 were larg- er than the other four directions. In the direction 5-3 and 5-9, we got the maximum of offset.
3.3. Result Analysis of Recognition Rate Experiment
In the sample space of 30 people, we matched contact- less image and contact image of every experimenter. Experiments conducted in-class match 30 times, inter- class match 2
60 1770
C = times, recognition rate of 99.84%. The remaining five recognition rates of the sample space
Table 2. basic statistical parameters of 8 directions offset (unit: pixel).
Direction 5-1 5-2 5-3 5-4 5-6 5-7 5-8 5-9
1 35.1 28.3 37.2 25.9 30.2 38.6 30.5 41.0
2 32.4 20.4 33.7 27.8 29.2 31.2 25.4 35.8
3 35.0 27.6 36.1 24.1 26.0 31.5 26.1 36.5
4 33.9 24.3 32.5 23.4 23.8 32.2 26.6 36.4
5 32.7 23.9 37.5 24.7 25.4 38.5 28.1 34.2
6 32.5 25.8 33.1 24.5 22.5 34.0 25.2 31.0
[image:5.595.308.536.111.378.2]mean 33.6 25.1 35.0 25.1 26.2 34.3 27.0 35.8
[image:5.595.306.537.112.375.2]Figure 7. 8 direction offset contrast.
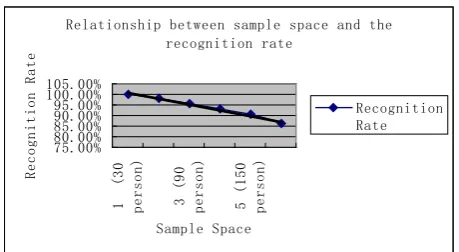
Table 3. Relationship between sample space and recognition rate.
Sample Space
30 person
60 person
90 person
120 person
150 person
180 person
Recognition
Rate 99.8% 98.1% 95.8% 92.8% 90.3% 86.1%
as shown in Table 3.
We did linear regression analysis from TABLEIII and got the trend line of relationship between sample space and recognition rate, as shown in Figure 8.
At last, we derived the linear regression equation of relationship between sample space and the recognition rate: y = −0.000903x + 1.0332, the judge coefficient was R² = 0.9824. Coefficient of determination R² = 0.9824 indicates the explanation power of the regression modal, that means sample could explained recognition rate di- versity 98.24%.
4. Conclusions
[image:5.595.311.535.419.464.2]Figure 8. Trend line of relationship between sample space and recognition rate.
dition. The deviation of contact-less imaging was caused by the different understanding of imaging situation. The result we got from this research provided effective and detailed data to the study of contact-less palm vein rec- ognition and gave powerful support to contact-less hand multi-feature fusion recognition.
In our future research, we will try to give the curve of high scope and angle scope that fit for contact-less im- aging. It will support the contact-less palm vein recogni- tion and the fusion with the other biometrics feature. At the same time, the curve of high scope and angle scope that fit for contact-less imaging will benefit for the other contact-less biometric technologies, such as hand vein recognition and palm print recognition.
5. Acknowledgements
This work is supported by National Natural Science
Foundation of China (60972123), Specialized Research Fund for the Doctoral Program of Higher Education (20092102110002) and Shenyang Science and Technol- ogy Development Program (F10-213-1-00).
References
[1] A. Jain, R. Bolle and S. Pankanti, “Biometrics: Personal Identification in Networked Society,” Kluwer Academic Publishers, Dordrecht, 1999.
[2] M. Watanabe, “Palm Vein Authentication,” Advances in Biometrics, Springer, Berlin, 2008.
[3] B. Prasanalakshmi and A. Kannammal, “A Secure Cryp- tosystem from Palm Vein Biometrics in Smart Card,” The
2nd International Conference on Computer and Automa- tion Engineering (ICCAE), 26-28 February 2010, pp. 653-657.
[4] Y. Z. Chao, Q. P. Guo and X. L. Lian, “Algorithm Re- search of Vein Recognition Based on Feature Point,”
Computer and Digital Engineering, Vol. 36, No. 5, 2008, pp. 1-3.
[5] L. Wang, G. Leedham and D. S.-Y. Cho, “Minutiae Fea- Ture Analysis for Infrared Hand Vein Pattern Biome- trics,” Pattern Recognition, Vol. 41, No. 3, 2008, pp.
920-929
[6] S. Hero, “Vein Imaging Device, Vein Imaging Method and Vein Recognition Device,” China, Application for Patent for Invention 200910168806.0, 2010.03.03.
Relationship between sample space and the recognition rate
75.00% 80.00% 85.00% 90.00% 95.00% 100.00% 105.00%
1
(
3
0
p
e
r
s
o
n
)
3
(
9
0
p
e
r
s
o
n
)
5
(
1
5
0
p
e
r
s
o
n
)
Sample Space
R
e
c
o
g
n
i
t
i
o
n
R
a
t
e