http://dx.doi.org/10.4236/oje.2015.510041
How to cite this paper: Li, Y.B., Xie, J., Luo, G.J., Yang, H. and Wang, S.J. (2015) The Evolution of a Karst Rocky Desertifica-tion Land Ecosystem and Its Driving Forces in the Houzhaihe Area, China. Open Journal of Ecology, 5, 501-512.
http://dx.doi.org/10.4236/oje.2015.510041
The Evolution of a Karst Rocky
Desertification Land Ecosystem and Its
Driving Forces in the Houzhaihe Area, China
Yangbing Li1*, Jing Xie1, Guangjie Luo1, Hua Yang1, Shijie Wang21School of Geography and Environmental Science, Guizhou Normal University, Guiyang, China
2National Key Laboratory of Environmental Geochemistry, Geochemistry Institute of Chinese Academy of Science, Guiyang, China
Email: *[email protected]
Received 22 December 2014; accepted 13 October 2015; published 16 October 2015
Copyright © 2015 by authors and Scientific Research Publishing Inc.
This work is licensed under the Creative Commons Attribution International License (CC BY).
http://creativecommons.org/licenses/by/4.0/
Abstract
Understanding the evolution of karst rocky desertification (KRD) quantitatively is essential to ob-tain objective knowledge about the concept of KRD and the form reason of KRD, and is useful to restore KRD land. Houzhaihe area located in central plateau in Guizhou Province was studied here as a representative assemblage landform and its KRD’ s evolution and driving factors were studied, based mainly on high-resolution remote sensing image in 1963, 1978, 2005 and 2010. The KRD land comprises light KRD, moderate KRD and severe KRD. The results demonstrated that the evo-lution process of KRD can be divided into four modes such as unchanged, weakened, fluctuated and aggravated in the study area. The KRD with no changes from 1963 to 2010, namely, un-changed mode, accounted for 43.76% of the total area of the KRD in 2010; it distributed in the area with the slope of 15˚ - 25˚ and >25˚ basically. Furthermore, the severe KRD distributed mainly in the areas within 300 - 600 m distance from settlement; when the distance away from the rural settlements was more than 900 m, the severe KRD declined, and its proportion was 28.6% and 10.6% in 1963 and 2010 respectively. In the peak-cluster depressions, located in central study area, the slope cropland with slope of 15˚ - 25˚ was still abounding, and was seriously rocky desertification generally. So, we propose that the existence of a large number of slope croplands is still the major driving factor of land rocky desertification. Therefore, for the rocky desertification control, the authors consider that the focal point is to alter the land use of steep-slope cropland at present.
Keywords
Karst Rocky Desertification, Evolution, Driving Mechanism, Central Plateau in Guizhou
1. Introduction
Most of karst landscapes are recognized as fragile zones unsuitable as human habitats—mainly due to extremely poor soil cover, or a complete lack of soil, and rapid water loss [1]. The karst landscape degeneration caused by the humanity activity proposes restoration challenges and opportunity to study stability and resistivity of limes-tone ecosystem [2], and also receives many attentions in international range [3]-[5]. Karst rocky desertification (KRD) land refers to a land degradation process, due to the human interference causing continued vegetation degradation, soil and water loss and even loss of resources, land productivity decline, and bedrock exposed sim-ilar to that in a desert landscape, in the vulnerable karst ecological environment in south humid regions of China [6][7]. A similar process has occurred in other parts of the world, such as in Southeast Asia, in the Mediterra-nean basin and the Classical Karst (kras) region [8][9].
At present, many scholars in this field have spent much time in studying the formation background [10], evo-lution [11], management [12], the driving factors of KRD [13], the spatial correlation of lithology and rocky de-sertification land [14], and the risk evaluation of KRD [15]; based on this research, some researchers developed the test observation of KRD process from the view of the ecological process [16], summarizing the KRD land-scape evolution model of the peak-cluster depression [17]. Some problems about KRD research still exist, such as the controversy on how to determine and classify the KRD [18][19], the lack of typical evolution case study of KRD with the application of a long-time series of high-resolution images [20], the neglect of the relationship among KRD, the people’s behavior and government policy [21] [22]. Monitoring and assessing karst rock is important for policy-makers and academic researchers [23]. In this paper, we attempt to reveal the KRD evolu-tion rule and driving mechanism through the typical case studies based on a long-time series of high-resoluevolu-tion images. Our purpose is aimed at providing some help for understanding KRD and its evolution process, the driving causes, and the effective measures for handling KRD through our study results.
The Study Area
The Houzhaihe area located in Puding County in the centre of Guizhou Province and in the watershed between the Yangtze river basin and the Pearl river basin was selected as the research area. This area includes two towns of Maguan and Yuguan, consists of administrative villages of Dayouzhai, Chenqibao, Zhaojiatian, Xiaba and Baiqibao, etc., and covers an area of 62.7 km2 (Figure 1). Elevation in this area decreases from southwest to northeast with a variation from 1257 m to 1568 m above sea level. Limestone deposited in Trias covers this area, and karst landforms develop well. The west is a peak forest basin; the middle is peak-cluster depressions; the southeast is peak-cluster valley; and the northeast is hills-depressions. The Houzhaihe river is the only seasonal river. In recent years, the rapid development of social economy, more migrant workers, and large changes in the agricultural structure make its natural, social and economic conditions be typical in the karst mountains. Figure 2 shows the land use pattern in 2010 of this area; the paddy field surrounds the peak-cluster depressions, which is dominated by steep-slope cropland (with the slope of 15˚ - 25˚), shrubby land and grassland.
2. Materials and Methods
2.1. The Classification of KRD
KRD is a kind of artificial desertification, refering to the desert landscape of the serious land degradation. On one hand, the KRD have a “serious degree” concept compared with the “land degradation”, on the other hand, the concept of KRD emphasizes the specific “landscape” features, so vegetation degeneration, soil and water loss and soil fertility decline cannot be simply counted as karst rocky desertification. Therefore, in order to de-fine the classifications of KRD land clearly, we divided the land types in the study area into three kinds as fol-lows:
1) No karst rocky desertification (NKRD, with no land degradation): the concentrated and contiguous
woodland such as the nature reserves; the flatland with no land degradation.
2)Potential karst rocky desertification (PKRD, with slight land degradation): the karst slope land where the land ecosystem has been degraded slightly, but the percentage of bare rock is less than 30%.
3)Karst rocky desertification (KRD, the serious land degradation): according to the concrete meanings of
Figure 1. Location sketch of the study area. (a) The topography and the division of village; (b) The land use pattern in 2010.
[image:3.595.94.535.452.685.2]KRD (MKRD) and severe KRD (SKRD).
2.2. Data Sources and KRD Judgment
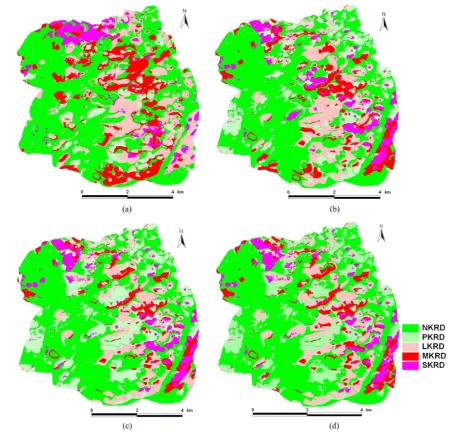
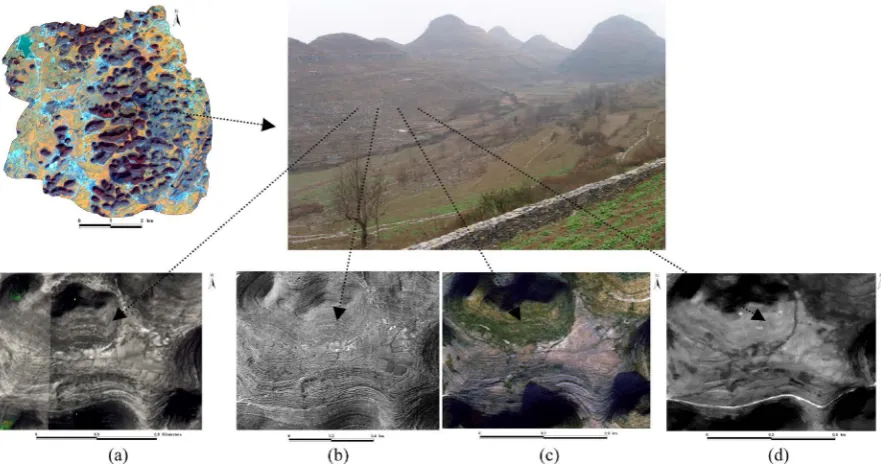
The basic datum used for this study included the aerial photograph in 1963 and 1978 (with a resolution of 1 m × 1 m), the SPOT image in 2005 and ALOS image in 2010 (with a resolution of 2.5 m × 2.5 m), and a topographic map at a 1:10,000 scale for the generation of slope gradient. First by using geographical information system (GIS) techniques, the digital orthophoto map was constructed from the aerial images, then all the images were precisely calibrated according to topographic map. The distribution maps of KRD land in four periods had been made using the human-computer interactive interpreting method. With the peak cluster depression as an exam-ple, when we calculated the percentage of bare rock of karst slope land, the flat bottoms of peak-cluster depres-sions weren’t considered. According to the percentage of bare rock of distributed in the peak-cluster slope around the depressions, the aggregation of bare rock patches, the vegetation types and their seasonal change characteristics, the remote images characteristics of KRD landscape was set up as a basis to judge the types of KRD in this region (Table 1). Further, the four periods corresponding KRD vector data layers are amended ac-cording to the result of the field sampling inspection and investigation in 2010, the interpretation accuracy of sampling patches is more than 90% (Figure 2). The spatial distribution of the four periods KRD in research area is to see Figure 3.
2.3. Analysis of the Evolution Trajectories of KRD
To calculate the evolution trajectories of KRD in the study area, first the KRD distribution map in the year of 1963, 1978, 2005 and 2010 were transferred into 10 m × 10 m grids data, then the classes of KRD of all the same grid unit in four periods were compared using the layer algebra operation method in ARCGIS software to gain the KRD evolution trajectories. We considered the LKRD, MKRD and SKRD as KRD land collectively and only discuss the most representative evolution trajectories so as to simplify calculation. 1) Unchanged mode reflects the types of KRD have no change in 4 periods. 2) Weakened mode reflects the transformation from KRD to potential KRD. 3) Fluctuated degradation reflects the types of KRD that transforms repeatedly, for ex-ample, from LKRD to MKRD, then to LKRD in 4 periods. 4) Aggravated mode reflects from NKRD and PKRD to KRD in the latter periods. The KRD trajectories could be indicated the continuous evolving processes of KRD land.
3. Results
3.1. The Changes of KRD in the Study Area
There are no obvious change of area proportions of NKRD and SKRD in study area in 1963, 1978, 2005 and 2010 (Figure 4). The proportions of PKRD from 5.62% in 1963 rise to 20.70% in 2005 and 19.03% in 2010, LKRD from 22.44% in 1963 down to 17.28% in 1978, and basically maintain unchanged between 2005 and 2010, MKRD from 15.66% in 1963 down to 6.90% in 2005, and rise to 7.98% in 2010.
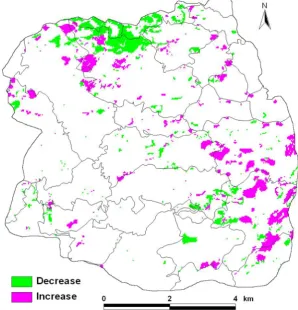
[image:4.595.89.538.601.721.2]The KRD of study area distributes mainly in peak-cluster depression along the northwest to southeast. The MKRD has changed greatly; the SKRD relatively has been not obviously changed along this region from 1963 to 2010. The SKRD has declined continuously in the north of study area, yet it declines in a scattered mode in
Table 1. The classification criterion and characteristic code of KRD types [24]-[26].
NKRD PKRD LKRD MKRD SKRD
Percentage of
bare rock (%) <10 <30 30 - 50 50 - 70 70 - 90
Characteristics of SPOT image
Bright green, patch, regular
boundary, clear texture Deep green, patch
Green, scattered across patches white
Shallow green, banded speckle white
Shallow green, banded patch white
Characteristics
of ALOS image Deep red, patch Shallow red
Speckle shallow red, speckle grey
Linked patch with shallow grey
Grey white of linked patch
Characteristics of aerial photos
Speckled grey black(woodland), white, grey white, uniform texture, clear patch(cropland)
Grey, not very uniform texture
Grey, very nonuniform texture
Shallow grey,
Figure 3. The distribution of KRD at study area in (a) 1963, (b) 1978, (c) 2005 and (d) 2010.
[image:5.595.122.529.536.709.2]the southeastern (Figure 5). The increase of SKRD is concentrated in south including Yuyangzhai and Dayouz-hai villages, and in north, including Chenqi, Houshan and Zhaojiatian villages.
3.2. The Change Trajectories of KRD in Study Area
The evolution process of KRD can be divided into four modes such as unchanged, weakened, fluctuated and ag-gravated KRD in the study area (Table 2). From 1963 to 2010, the unchanged KRD account for 43.76% of the total KRD land and the PKRD which was transformed from the KRD accounted for 47.26% of total PKRD in 2010, 34.35% of which was transformed during the interval of time from 1963 to 1978. The proportion of re-peated conversion between PKRD and KRD land is low during 1963 to 2010. In the three periods—1963 to 1978, 1978 to 2005, 2005 to 2010, the KRD area which aggravated from PKRD and NKRD accounts for 17.69% of the total KRD in 2010. These degradations also mainly occurred during periods of 1963 to 1978. The propor-tions of degradation in the periods from 1978 to 2005 and from 2005 to 2010 are 1.07%, 0.04% respectively. The above results show that there is only a local deterioration trend for KRD at study area in recent years.
From above, we know the unchanged KRD accounts for 43.76% of the total KRD in 2010. This phenomenon reflect the KRD land, especially those of serious degradation types once formed, if human interference condi-tions do not change, restoration is a long-term process. Each kind of change trajectories and types of KRD shown by Table 3 reflects different evolution processes under the comprehensive action of the natural factors and human factors. Of course, with each kind of driving factor of unchanged trajectories of KRD there should exist differences, may be harsh natural conditions or human interference on the KRD land, to induce the long time KRD. Finding out these differences is important for KRD land management.
3.3. The Relation between KRD and Different Slope Grades
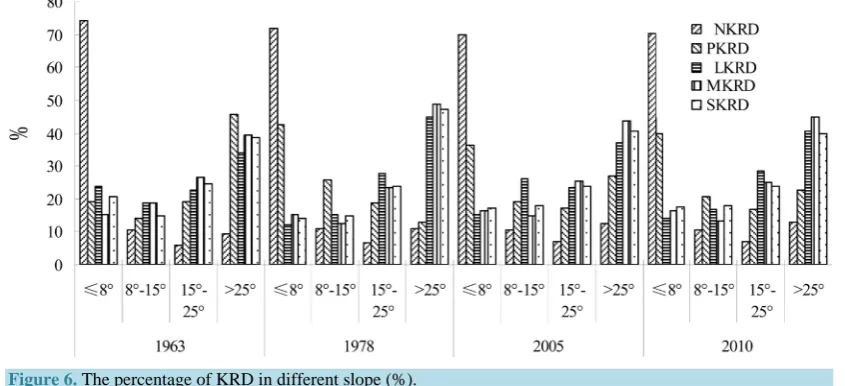
[image:6.595.162.461.394.705.2]As can be seen from the Figure 6, the proportion of NKRD decreased as the slope gradient increased generally.
Table 2. The change trajectories and types of KRD in periods of 1963 to 1978, 1978 to 2005 and 2005 to 2010.
Evolution trajectories Class of KRD Area/hm2 Percentage accounted for corresponding KRD type of 2010/% 1963 1978 2005 2010
Unchanged mode KRD KRD KRD KRD 1377.53 43.76
PKRD PKRD PKRD PKRD 59.9 5.02
Weakened mode
KRD KRD KRD PKRD 15.99 1.34
KRD KRD PKRD PKRD 138.07 11.57
KRD PKRD PKRD PKRD 410.03 34.35
Fluctuated mode PKRD KRD PKRD KRD 11.08 0.57
KRD PKRD KRD PKRD 00.07 0.01
Aggravated mode
PKRD PKRD PKRD KRD 0 0.00
PKRD PKRD KRD KRD 4.29 0.22
PKRD KRD KRD KRD 133.8 6.91
NKRD PKRD KRD KRD 7.56 0.39
NKRD NKRD NKRD KRD 0.86 0.04
NKRD NKRD KRD KRD 8.94 0.46
NKRD KRD KRD KRD 186.73 9.66
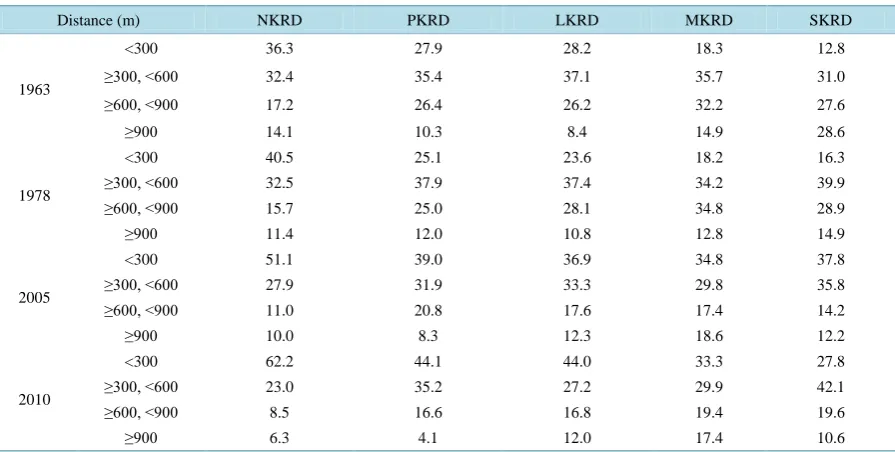
Table 3. The percentage of KRD at different buffer distance range to rural settlement (%).
Distance (m) NKRD PKRD LKRD MKRD SKRD
1963
<300 36.3 27.9 28.2 18.3 12.8
≥300, <600 32.4 35.4 37.1 35.7 31.0
≥600, <900 17.2 26.4 26.2 32.2 27.6
≥900 14.1 10.3 8.4 14.9 28.6
1978
<300 40.5 25.1 23.6 18.2 16.3
≥300, <600 32.5 37.9 37.4 34.2 39.9
≥600, <900 15.7 25.0 28.1 34.8 28.9
≥900 11.4 12.0 10.8 12.8 14.9
2005
<300 51.1 39.0 36.9 34.8 37.8
≥300, <600 27.9 31.9 33.3 29.8 35.8
≥600, <900 11.0 20.8 17.6 17.4 14.2
≥900 10.0 8.3 12.3 18.6 12.2
2010
<300 62.2 44.1 44.0 33.3 27.8
≥300, <600 23.0 35.2 27.2 29.9 42.1
≥600, <900 8.5 16.6 16.8 19.4 19.6
≥900 6.3 4.1 12.0 17.4 10.6
The proportion of NKRD with the slope 15˚ - 25˚ and >25˚ slope increased from 1963 to 2010, indicating that vegetation is recovering in this range. The proportion of PKRD with the slope >25˚ in 1963 was the highest, but the highest in 1978, 2005 and 2010 was distributed at range with the slope ≤8˚. The proportion of LKRD, MKRD and SKRD increased as the slope gradient increased. In range of ≤8˚ slope, the proportion of SKRD was the lowest in 1978, yet this percentage increases in 2005 and 2010. The proportion of SKRD with the slope 8˚ - 15˚ in 2005 and 2010 increased respectively, showing that this slope range is subjected to intense human inter-ference such as overexploitation. The proportion of SKRD with the slope 15˚ - 25˚ and >25˚ remained basically unchanged from 1963 to 2010.
3.4. The KRD Change in Different Buffer to the Settlements
[image:7.595.90.538.334.560.2]Figure 6. The percentage of KRD in different slope (%).
household would like to subconsciously protect the forests. The PKRD is mainly distributed in the areas within 300 m and 300 - 600 m distance from settlements, and the PKRD in the areas within >900 m distance have de-creased from 1963 to 2010. The LKRD and MKRD are mainly distributed in the areas within <300 m and 300 - 600 m distance from the settlement. Compared with 1978, the LKRD and MKRD in 2005 and 2010 within the 600 - 900 m and >900 m distance from the settlements are in a decreased trend. The SKRD is mainly distributed in the areas within 300 - 600 m distance from settlements, where a mass of the sloping cropland still exists. In the area within a >900 m distance from the settlements, the proportion of SKRD decrease from 28.6% in 1963 to 10.6% in 2010. The rule of KRD change in different buffers to the settlements has spatial diversity in the study area because there are more flat lands in the west village of the study area, so the distribution of KRD further from the settlements. However, there are less flat lands and denser peak-cluster depressions in the southeast of the study area, so the KRD is generally distributed near the settlements within a distance of 300 m and 300 - 600 m.
4. Discussion
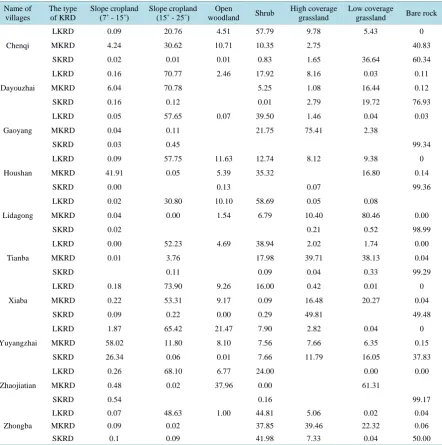
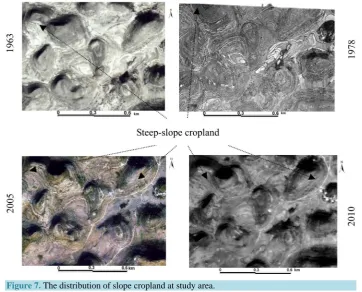
At fine scales, many factors are relatively similar at the county level, e.g., geology, lithology, and soil types, whereas human activities and topographical characteristics have significant impacts on KRD at certain scales [27]. In order to explain the driving factors of the change of KRD, we further analyzed the KRD which occurred in the different land use types in 2010 of ten village-level units located in the middle peak-cluster depressions in the study area (Table 4). We can see from Table 4, the KRD of gentle-slope cropland only in Houshan village and Yuyangzhai village is more serious than other villages. The KRD distributed in gentle slope cropland in Houshan village accounts for 41.91% of MKRD, the KRD distributed in gentle-slope cropland in Yuyangzhai village accounts for 58.02% of MKRD and 26.34% of SKRD while the KRD distributed in gentle-slope crop-land of other village is not serious. Although the KRD distributed in the steep-slope cropcrop-land is very serious in each villages, this situation in Da Youzhai village is the most serious, in which the KRD distributed in steep-slope cropland accounts for 70.78% of MKRD and 70.77% of LKRD respectively. Since the proportion of SKRD with slope 15˚ - 25˚ remains unchanged basically from 1963 to 2010 might have some relevance with the steep-slope cropland, it is the focal point of the KRD control work to alter the land use of steep-slope cropland at present.
Table 4. The distribution of KRD in land use types at study area (%). Name of villages The type of KRD Slope cropland
(7˚ - 15˚) Slope cropland (15˚ - 25˚) woodland Open Shrub
High coverage grassland
Low coverage
grassland Bare rock
Chenqi
LKRD 0.09 20.76 4.51 57.79 9.78 5.43 0
MKRD 4.24 30.62 10.71 10.35 2.75 40.83
SKRD 0.02 0.01 0.01 0.83 1.65 36.64 60.34
Dayouzhai
LKRD 0.16 70.77 2.46 17.92 8.16 0.03 0.11
MKRD 6.04 70.78 5.25 1.08 16.44 0.12
SKRD 0.16 0.12 0.01 2.79 19.72 76.93
Gaoyang
LKRD 0.05 57.65 0.07 39.50 1.46 0.04 0.03
MKRD 0.04 0.11 21.75 75.41 2.38
SKRD 0.03 0.45 99.34
Houshan
LKRD 0.09 57.75 11.63 12.74 8.12 9.38 0
MKRD 41.91 0.05 5.39 35.32 16.80 0.14
SKRD 0.00 0.13 0.07 99.36
Lidagong
LKRD 0.02 30.80 10.10 58.69 0.05 0.08
MKRD 0.04 0.00 1.54 6.79 10.40 80.46 0.00
SKRD 0.02 0.21 0.52 98.99
Tianba
LKRD 0.00 52.23 4.69 38.94 2.02 1.74 0.00
MKRD 0.01 3.76 17.98 39.71 38.13 0.04
SKRD 0.11 0.09 0.04 0.33 99.29
Xiaba
LKRD 0.18 73.90 9.26 16.00 0.42 0.01 0
MKRD 0.22 53.31 9.17 0.09 16.48 20.27 0.04
SKRD 0.09 0.22 0.00 0.29 49.81 49.48
Yuyangzhai
LKRD 1.87 65.42 21.47 7.90 2.82 0.04 0
MKRD 58.02 11.80 8.10 7.56 7.66 6.35 0.15
SKRD 26.34 0.06 0.01 7.66 11.79 16.05 37.83
Zhaojiatian
LKRD 0.26 68.10 6.77 24.00 0.00 0.00
MKRD 0.48 0.02 37.96 0.00 61.31
SKRD 0.54 0.16 99.17
Zhongba
LKRD 0.07 48.63 1.00 44.81 5.06 0.02 0.04
MKRD 0.09 0.02 37.85 39.46 22.32 0.06
SKRD 0.1 0.09 41.98 7.33 0.04 50.00
The KRD’s formation and distribution are related also to landform. In the vast rural areas of center plateau of Guizhou province, the karst landform, much like the assemblages of peak-cluster depressions, peak cluster val-ley and basin, have a widespread distribution except in cultivated flatland with area more than 10,000 mu. Therefore, because the study area in this paper is a typical model of karst landform in Guizhou plateau, the evo-lution and driving forces of KRD in the study area can be used to indicate the general circumstance of KRD of Guizhou province. Of course, due to the spatial difference of social, economic, locational and demographic con-ditions, the evolution and driving factors of KRD may have some other rules and need to study further.
5. Conclusion
Figure 7. The distribution of slope cropland at study area.
mode, fluctuated degradation and aggravated mode. The research results indicated that the LKRD and MKRD decreased; the SKRD increased from 1963 to 1978; the MKRD decreased; the change of SKRD was not obvious from 1978 to 2005. The LKRD and MKRD increased; the SKRD declined slightly from 2005 to 2010. From 1963 to 2010, the proportion of SKRD within the 15˚ - 25˚ and >25˚ slope range maintained basically un-changed and the proportion of unun-changed KRD accounted for 43.76% in 2010. In Houzhaihe area, the cropland of steep slope in each village held the serious KRD; the existence of more slope cropland was still the driving factors of land rocky desertification. Thus only when the use pattern of steep slope land is altered and the de-pendence on the way to reclaim slope land and slope cropland is reduced gradually, will the ecological restora-tion goal be realized.
Acknowledgements
This research was supported by the National Natural Science Foundation of China (41261045), Program for New Century Excellent Talents in University (NCET-05-0819) and MOE Layout Foundation of Humanities and Social Sciences (10XJAZH002). We also thank the local people who introduced how they fight the fragile karst environment and told us their doubts and hopes.
References
[1] Zhang, B., Xiao, F., Wu, H., Mo, S., Zhu, S., Yu, L., et al. (2006) Combating the Fragile Karst Environment in Guiz-hou, China. Ambio, 35, 94-96. http://dx.doi.org/10.1579/0044-7447(2006)35[94:CTFKEI]2.0.CO;2
[2] Gillieson, D., Wallbrink, P. and Cochrane, A. (1996) Vegetation Change, Erosion Risk and Land Management on the Nullarbor Plain, Australia. Environmental Geology, 28, 145-153. http://dx.doi.org/10.1007/s002540050087
[3] Bou Kheir, R., Abdallah, C. and Khawlie, M. (2008) Assessing Soil Erosion in Mediterranean Karst Landscapes of Lebanon Using Remote Sensing and GIS. Engineering Geology, 99, 239-254.
http://dx.doi.org/10.1016/j.enggeo.2007.11.012
[4] Day, M.J. and Sean, C.M. (2004) The Karstlands of Trinidid and Tobago, Their Land Use and Conservation. The Geo-graphical Journal, 170, 256-266. http://dx.doi.org/10.1111/j.0016-7398.2004.00124.x
with Modeling Approaches. Science of the Total Environment, 407, 1153-1163.
http://dx.doi.org/10.1016/j.scitotenv.2008.09.033
[6] Yuan, D. (1997) Rock Desertification in the Subtropical Karst of South China. Zeitschrift für Geomorphologie N. F.,
108, 81-90.
[7] Wang, S., Liu, Q. and Zhang, D. (2004) Karst Rock Desertification in Southwestern China: Geomorphology, Land Use, Impact and Rehabilitation. Land Degradation & Development, 15, 115-121. http://dx.doi.org/10.1002/ldr.592
[8] Sauro, U. (1993) Human Impact upon the Karst Land of Venetion Fore Alps, Italy. Environmental Geology, 23, 115- 121. http://dx.doi.org/10.1007/BF00775294
[9] Gams, I. (1993) Origin of the Term “Karst”, and the Transformation of the Classical Karst (Kras). Environmental Ge-ology, 21, 110-114. http://dx.doi.org/10.1007/BF00775293
[10] Wang, S., Li, R., Sun, C. and Zhang, D. (2004) How Types of Carbonate Rock Assemblages Constrain the Distribution of Karst Rock Desertified Land in Guizhou Province, P R China: Phenomena and Mechanism. Land Degradation & Development, 15, 123-131. http://dx.doi.org/10.1002/ldr.591
[11] Wang, S.J., Li, Y.B. and Li, R.L. (2003) Karst Rocky Desertification: Formation Background, Evolution and Compre-hensive Taming. Quaternary Sciences, 23, 657-666.
[12] Tian, X.L. and Ni, J. (2010) Comprehensive Treatment of Rocky Desertification in Karst Mountainous Areas, South-western China: Fundamental, Approach and Issues. Arid Land Geography, 33, 532-539.
[13] Hu, B.Q., Liao, C.M., Yan, Z.Q., Jiang, S.F., Huang, Q.Y. and Li, S.M. (2004) Diving Mechanism Diagnosis of Karst Rocky Desertification in Du’an Yao Autonomous County of Guangxi Based on RS and GIS. Journal of Mountain Re-search, 22, 583-590.
[14] Li, R.L., Wang, S.J., Zhou, D.Q., Zhang, D.F., Li, F.Q., Zhou, Z.F. and Xiong, K.N. (2003) The Correlation between Rock Desertification and Lithology in Karst Area of Guizhou. Acta Geographica Sinica, 58, 314-320.
[15] Huang, Q.H. and Cai, Y.L. (2006) Assessment of Karst Rocky Desertification Using the Radial Basis Function Net-work Model and GIS Technique: A Case Study of Guizhou Province, China. Environmental Geology, 49, 1173-1179.
http://dx.doi.org/10.1007/s00254-005-0162-4
[16] Li, S., Wei, X.H., Zhang, S.H., Li, H.B., Wang, M.G., Luo, H.B., et al. (2010) The Processes of Land Rocky Deserti-fication in Typical Karst Mountain Area: A Case Study in the Karst Mountain Area of North Guangdong. Acta Ecolo-gica Sinica, 30, 674-684.
[17] Dan, W.H., Zhang, C., Song, J. and Wang, L. (2009) An Exploratory Analysis of Both Landscape Pattern and Land Use Model in Peak Cluster-Depressions Rocky Desertification Areas. Geographical Research, 28, 1615-1624.
[18] Xiong, K.N., Li, P., Zhou, Z.F. and Lan, A.J. (2002) The RS and GIS Representative Study on Karst Rock Desertifica-tion—An Example of Guizhou Province. Geology Press, Beijing, 23-28.
[19] Li, S., Dong, Y.X. and Wang, J.H. (2007) Re-Discussion on the Concept and Classification of Rocky Desertification.
Carsologoca Sinica, 26, 279-284.
[20] Yang, Q.Q., Wang, K.L., Zhang, C.H., Yue, Y.M., Tian, R.C. and Fan, F.D. (2011) Spatio-Temporal Evolution of Rocky Desertification and Its Driving Forces in Karst Areas of Northwestern Guangxi, China. Environmental Earth Science, 64, 383-393. http://dx.doi.org/10.1007/s12665-010-0861-3
[21] Jiang, Y.J., Li, L.L., Groves, C., Yuan, D.X. and Kambesis, P. (2009) Relationships between Rocky Desertification and Spatial Pattern of Land Use in Typical Karst Area, Southwest China. Environmental Earth Science, 59, 881-890.
http://dx.doi.org/10.1007/s12665-009-0083-8
[22] Wu, X.Q., Liu, H.M., Huang, X.L. and Zhou, T. (2011) Human Driving Forces: Analysis of Rocky Desertification in Karst Region in Guanling County, Guizhou Province. Chinese Geographical Science, 21, 600-608.
http://dx.doi.org/10.1007/s11769-011-0496-7
[23] Huang, Q.H. and Cai, Y.L. (2009) Mapping Karst Rock in Southwest China. Mountain Research and Development, 29, 14-20. http://dx.doi.org/10.1659/mrd.857
[24] Zhou, M.W., Wang, S.J. and Li, Y.B. (2007) Spatial Factor Analysis of Karst Rocky Desertification Landscape Pat-terns in Wangjiazhai Catchment, Guizhou. Geographical Research, 26, 897-905.
[25] Li, Y.B., Li, W.H., Wang, S.J., Luo, G.J. and Chang, A.Y. (2010) Dynamic Behavior Characteristics and Classification Assessment of Karst Rocky Desertification. Progress in Geography, 29, 335-341.
[26] Wang, J.H., Li, S, Li, H.X., Luo, H.B. and Wang, M.G. (2007) Classifying Indices and Remote Sensing Image Cha-racters of Rocky Desertification Lands: A Case of Karst Region in Northern Guangdong Province. Journal of Desert Research, 27,765-770.
426. http://dx.doi.org/10.1016/j.scitotenv.2013.04.048
[28] Wang, C.C. and Yang, Y.S. (2011) Review of Research on Mountainous Ecological Restoration Based on Farmer Household Livelihood Evolution. Journal of Natural Resources, 26, 344-352.
[29] Cao, S.X., Zhong, B.L., Yue, H.,Zeng, H.S. and Zeng, J.H. (2009) Development and Testing of a Sustainable Envi-ronmental Restoration Policy on Eradicating the Poverty Trap in China’s Changting County. Proceedings of the Na-tional Academy of Sciences of the United States of America, 106, 10712-10716.
![Table 1. The classification criterion and characteristic code of KRD types [24]-[26].](https://thumb-us.123doks.com/thumbv2/123dok_us/8061411.776527/4.595.89.538.601.721/table-classification-criterion-characteristic-code-krd-types.webp)