Clustering Algorithms for Moving Object Shape and
Time Constrains Basis
S. Santhosh Baboo
, Ph.DAssociate Professor, Postgraduate & Research, Department of Computer Applications, D.G.Vaishnav College, Arumbakkam,
Chennai-600106, India
K. Tajudin
, Assistant Professor,Department of Computer Science, The New College,
Royapettah, Chennai-600014, Tamilnadu, India
ABSTRACT
Clustering moving object trajectory data is an appealing research direction to fulfil the needs of many applications. In general, clustering is defined as the division of data into groups of similar objects. Each group, called as cluster, consists of objects that are similar among themselves and dissimilar to objects of other groups . Here to consider the moving object for clustering. The first section describes different object to flow in different directions, the clustering technique cluster object not only to the direction, time consideration and also cover with similar shape of object within the cluster window moving position. The objects flow in different way, different speed and different shape. Here the position or location of clustering and moving object directions are considered.
The second section deals with the maximum wind details are Hurricane/Tropical Data for Northern Indian Ocean. Here to concentrate the flow record of maximum wind time duration basis, starting from the year, 2001 to 2010, the maximum cyclone flow updated different duration i.e.,on hourly basis. The databases keep all records of data, to apply the clustering of four ways. First timely basis with limitation, second time and wind range basis, third exact time basis and fourth time limit with exact wind range.
Keywords
Spatial Temporal Database-Moving Object- Hiding Value-Location finding-Query analyzation
1. INTRODUCTION
Data mining uses large quantities of data to create models. These models can provide insights that are revealing, significant, and valuable. The field of spatial databases has been an active area of research. There are two common models of spatial information: field-based and object-based. The field-based model treats spatial information such as altitude, rainfall and temperature as a collection of spatial functions transforming a space partition to an attribute domain. The object-based model treats the information space as if it is populated by discrete, identifiable, spatially-referenced entities. Databases that store information about states of the real world across time are called temporal databases. Based on the issue of time in database systems, distinguish time as measured by the system and time as observed in the real world. The valid time for a fact is the set of time intervals during which the fact is true in the real world, independent of the recording of that fact in some databases. With many applications requiring support for temporal databases, extensive research has focused on temporal queries and reasoning.
Spatial-temporal data models and query languages are a topic of growing interest. A spatial-temporal database is a database that embodies spatial, temporal, and spatial-temporal database concepts and captures simultaneously spatial and temporal aspects of data. It deals with geometries that change with time. Moving objects are the objects of which spatial data is changed in sequence over time[3],[18]. The queries are related to path, direction, or distance of moving objects[11]. In this research to discuss about moving object clustering with shape and hurricane data movement clustering with time and data constrains.
2. LITERATURE REVIEW
Cluster stability is measured as the amount of variation in the cluster solution over different subsamples drawn from the input data (Lang et al., 2004).The performance of this classifier and the testing subset indicates the stability of the clustering algorithms (e.g. K-means or Gaussian mixture models). The distance between the models found for different subsample can be used to measure the stability(von Luxburg and David,2005).
The combination of visualization data mining techniques for spatial-temporal analysis[13](Di Martino et an 2006,Bertolotto et al 2007),implemented to clustering algorithms DBSCAN and CURE (kechdi et al 2007).The first algorithm is more suitable for similarity measure that can be represent by a distance measure each clustering represented by one data object. CURE accept any similarity measures and the cluster can be represented by more than one representative. It is very important to represent cluster of different space there are locations in the space that are highly similar to this are represented each of the small location groups.
3. RELATED WORK
3.1. Moving Object Cluster with Shape
Constrains
The equation (1) defines count all clustering filter object that is count similar object from the range of boundary specification.
a)Check Within the range (Moving the object either left to right or right to left)
CPL >=Left and CPR <=Right
CPT <=Top and CPB >= Bottom --eq(2)
Where CPL -Cluster Position Left Boundary;
CPR -Cluster Position Right Boundary;
CPT -Cluster Position Top Boundary;
CPB -Cluster Position Bottom Boundary
The equation (2) defines clustering position specification of left, right, top and bottom ranges. Here CPL, CPR, CPT and CPB
setting within the range of window left, right, top and bottom.
b) Check Clustering Object based on the constrains
CPL <=Obj<=CPR
And CPT<=Obj<=CPB --eq(3)
The equation (3) object constrains are satisfy count all similar objects.
3.2. Time Clustering with Different
Constrain Based Checking
The discussion of clustering is four different way.
a) Cluster the object only time limit
TS < WFT<TE --eq(4)
Where TS – Starting Time; TE – Ending
Time; WFT – Wind Flow Time
The equation (4) illustrates clustering object in the time limit only i.e., details of cluster consider only time consideration, here hurricane wind flow time compare with clustering time.
b) Cluster the object time and wind limit TS < WFT <TE And
--eq(5) WS<WV<WE
Where
WS – Starting Wind Limit; WE – Ending Wind Limit;
WV-Wind Value
The equation (5) illustrate cluster the hurricane wind flow in two basic checking, first to cluster compare with time limit and wind value limit.
c) Cluster the object Constant Time
WFT =TC --eq(6)
Where TC – Constant Time value
The equation (6) illustrate cluster only in prescribed time basis.
d) Cluster the object Constant Time and Constant Wind WFT =TC and Wv=WC --eq(7)
Where WC – Constant Wind Value
The equation (7) illustrate cluster only in prescribed wind value and time basis.
4. DATA ANALYSIS
The following section describes details of data analysation of moving object with shape clustering and time clustering.
4.1. Moving Object cluster with Shape
Constrains
1. Object 2. Timer 3. Window 4. Count 5. Direction Flow
The above attributes are used to cluster moving object. The object attribute is using the type of object, the timer is display timing when the object is taken to clustering, the window attribute is used to location of taken to clustering, the count attribute is used to count the similar shape of object within the limit of area and direction flow is used to object movement direction whether its right to left or left to right.
Fig.1: Cluster Object Based on Shape
The figure (1) shows the details of moving object within the area. The cluster1 is clustering all circle objects. The cluster2 is cluster ellipse objects and cluster3 is clustering all rectangle objects. The above clustering to cluster moving objects with similar type depends on the shape.
4.2. Time Clustering With Different
Constrain Based Checking
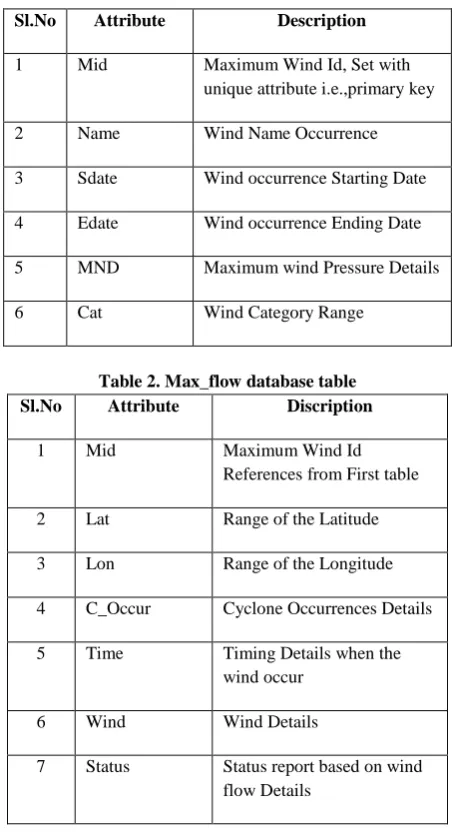
The database table is used to maximum wind details from the year of 2001 to 2010 Hurricane/Tropical Data for Northern Indian Ocean from the website of http://weather.unisys.com/hurricane/. The table (1) and (2) is used to store the information of above details.
i=Be
CFObj = ∑ Csob --eq(1)
i = Bs
Where
Csob –Clustering specified object
CFObj – Count All Clustering Filter
Object
i= Bs Boundary Start , i= Be Boundary
Table 1.Max_cyclone database table
Sl.No Attribute Description
1 Mid Maximum Wind Id, Set with unique attribute i.e.,primary key
2 Name Wind Name Occurrence
3 Sdate Wind occurrence Starting Date
4 Edate Wind occurrence Ending Date
5 MND Maximum wind Pressure Details
6 Cat Wind Category Range
Table 2. Max_flow database table Sl.No Attribute Discription
1 Mid Maximum Wind Id
References from First table
2 Lat Range of the Latitude
3 Lon Range of the Longitude
4 C_Occur Cyclone Occurrences Details
5 Time Timing Details when the wind occur
6 Wind Wind Details
7 Status Status report based on wind flow Details
5. RESEARCH FINDING
5.1. Moving Object Cluster with Shape
Constrains
The algorithm1 describe to clustering the moving object in same shape. The step1 used to create a different shape of object for clustering, the step2 and step3 explains move all the object with different direction and different speed to reach the destination, the step4 again to create two moving object for select clustering position i.e., the two object move from left to right and right to left. The step5 cluster the object based on constrain given to run time. The step6 to check different condition, a) check the direction of object is Left to Right then check the shape of the object 0 or 2 or 3 then count the specified object within the cluster window b) check the direction of object is Right to Left then check the shape of the object 0 or 2 or 3 then count the specified object within the cluster window.
Algorithm-1
Step1: Create different shape of object
Step2: Move all the object with different direction
Step3: Move the object with different speed and time limit to reach the destination
Step4: Move the two window object both the direction left to right and right to left
Step5: Check the object position within the range of eq(1) and eq(2)
Step5: Check the object within the window and check with constrains
a) If D=L to R then If obj= “0” then
Print “cluster time and number of object under 0 constrains”
Else if obj= “2” then
Print “cluster time and number of object under 2 constrains”
Else if obj= “3” then
Print “cluster time and number of object under 3 constrains”
endif
Else if D=R to L then If obj= “0” then
Print “cluster time and number of object under 0 constrains”
Else if obj= “2” then
Print “cluster time and number of object under 2 constrains”
Else if obj= “3” then
Print “cluster time and number of object under 3 constrains”
endif endif Step6: stop
Where 0-rectangle, 2-oval and 3- Circle; D-direction; obj-object indication; R to L – Right to Left; L to R – Left to Right
5.2 Time Clustering With Different
Constrain Based Checking
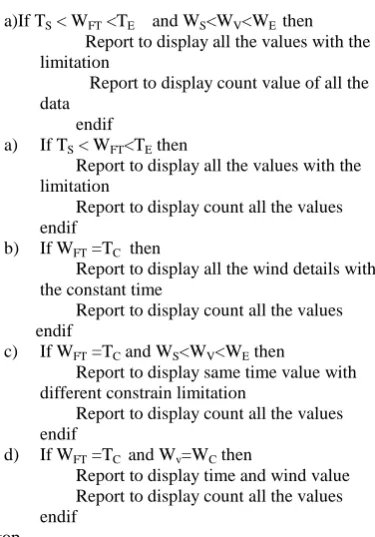
The algorithm2 describe time clustering with different constrain based checking. The step1 is used to create a database based on hurricane report 2001 to 2010. The step2 is used to create another table using reference key of first table update maximum wind flow in time basis. The step3 used to prepare chart based on the maximum wind time basis entry of table2. The step4 check constrains for clustering, a) if the cluster data within the specified range of time limit and specified limit of wind value limit then to display cluster output b) if the cluster data only time limit basis then to display cluster output c) To check cluster data constant time basis then display cluster output d) To check constant time and wind limit range then display cluster output e) To check constant time and constant wind value if it satisfy then display cluster output. The above condition (a) to (e) cluster first report output to generate aggregate value.
Algorithm-2
Step1: Create a database based on hurricane report 2001 to 2010
Step3: Prepare chart based on the maximum wind timely entry.
Step4: Generate the report based on the condition
a)If TS < WFT <TE and WS<WV<WE then
Report to display all the values with the limitation
Report to display count value of all the data
endif
a) If TS < WFT<TE then
Report to display all the values with the limitation
Report to display count all the values endif
b) If WFT =TC then
Report to display all the wind details with the constant time
Report to display count all the values endif
c) If WFT =TC and WS<WV<WE then
Report to display same time value with different constrain limitation
Report to display count all the values endif
d) If WFT =TC and Wv=WC then
Report to display time and wind value Report to display count all the values endif
Step6: Stop
6. EXPERIMENT RESULT
The following sections are discussed about experimental result of moving object cluster with shape and time constrains.
6.1. Moving Object Cluster with Shape
Constrains
[image:4.595.306.550.100.372.2]The figure (2) shows moving object with cluster in direction left to right, the cluster direction is chosen as left to right, the cluster data is chosen any one of three shape, the clustering time is defines taken time to cluster, the cluster output is defines total count value of similar type.
Fig.2: Moving object with clustering(L to R)
[image:4.595.88.276.118.387.2]The cluster direction is chosen as right to left, the cluster data is chosen any one of three shape, the clustering time is defines taken time to cluster, the cluster output is defines total count value of similar type.
Table 3. Sample Report Output Cluster data(L to R) Direction
Sl.No Object Cluster
Data
Cluster Time
Cluster Output
Moving Direction
(msec)
1 L to R Circle 50 1
2 L to R Oval 55 1
3 L to R Rectangle 101 2
4 L to R Oval 103 0
5 L to R Rectangle 124 2
6 L to R Rectangle 141 2
7 L to R Circle 155 0
8 L to R Rectangle 198 0
The table (3) gives the cluster output summary result. The column object moving direction defines which direction to flow the object i.e., left to right or right to left. The second column defines shape of clustering object and the last two columns define time and summary report of cluster output. There are sampling fourteen entries are taken to cluster, in that some of the cluster output result contains values but some of the cluster output result is zero such that category there is no object within that position in that specified shape.
[image:4.595.317.542.477.623.2]x-axis denote time; y-axis denote output count Fig.3: Moving object with clustering(L to R) Output
Result References of Table 3 data
The figure (3) shows the details of output result based on the references table 3 values. Here to sampling eight different time duration cluster the data with specified shape and also focused direction of moving object within the located area in run time. The output comes depends on the given input. In figure(3) x-axis denote as timing in millisecond, y-axis denote number of object inside the clustering position as well as similar shape only. Here there are eight different output, All the eight consider only moving object flow direction Left to Right, first consider the circle object for clustering for two
1
1
2
0
2 2
0
0
0
1
2
3
0
100
200
300
[image:4.595.53.283.536.684.2]different time duration i.e., 50msec and 155msec cluster output result 1 and 0, second to consider oval this also two different time duration i.e., 55msec and 103msec cluster output result 1 and 0. Third to taken for clustering Rectangle time duration 101,124 and 141 cluster output result 2,2 and 2.
Table 4. Sample Report Output Cluster data(R to L) Direction
[image:5.595.53.281.184.547.2]x-axis denote time; y-axis denote output count Fig.4: Moving object with clustering(R to L) Output
Result reference of Table4 data
The figure (4) shows the details of output result based on the references table 4 values. Here to sampling five different time duration cluster the data with specified shape and also focused direction of moving object within the specified location in run time. The output comes depends on the given input. In figure (4) x-axis denote as timing in millisecond, y-axis denote number of object inside the clustering position as well as similar shape only. Here there are five different output, All the five consider only moving object flow direction Right to Left, first consider the circle object for clustering for time duration 109 cluster output zero i.e., there is no circle object in that duration within that location. Second to taken for clustering Rectangle time duration 117,122 and 198 cluster output result 1, 1 and 0.Third to consider oval time duration 132 cluster output result 1.
6.2 Time Clustering for Different Constrain
Basis
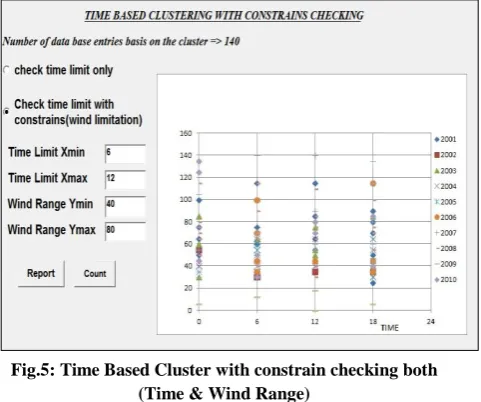
The figure (5) XMIN,XMAX,YMIN AND YMAX denote the
[image:5.595.316.557.272.473.2]minimum and maximum coordinate values of x and y as well as x denote time limit and y denote wind speed range limit. The screen shot to select two option basis first one check time limit only i.e., consider only two parameter only. Second check time limit with constrain i.e., taken four parameter for clustering. The run time to select any one option based on the requirement of clustering. The figure (5) select two options that means consider four parameters, time based clustering with constrains checking, the time limit Xmin denotes starting time value, ending value of timing denotes Xmax these two values are limitation of the time, wind range starting as denote Ymin and ending value of wind range denote Ymax. The above four attribute specification to cluster hurricane details.
[image:5.595.310.550.485.689.2]Fig.5: Time Based Cluster with constrain checking both (Time & Wind Range)
Table 5. Sample Report output for figure (5) constrain
Sl. No
Constrain Checking
Limit Range Total
Count
T
ST
EW
sW
E1
4
12
18
60
120
33
2
1
6
6
-
-
41
3
4
6
12
80
140
17
4
3
12
12
40
80
18
5
2
6
18
75
75
5
The table (5) shows details of constrain checking, Ts- Starting time limit, TE- Ending time limit, Ws – Wind value starting
time ,WE- Wind value ending time and Aggregate value of the
cluster report. The constrain checking of 4 indicate here to consider check all the specified values for cluster, 1 indicate only consider time limit, 2 indicate consider time limit but constant wind value and 3 indicate constant time value but
0
1
1 1
0
0
0.5
1
1.5
0
100
200
300
Cluster Output (R to L)
Sl.No Object Cluster
Data
Cluster Time
Cluster Output
Moving Direction
(msec)
1 R to L Circle 109 0
2 R to L Rectangle 117 1
3 R to L Rectangle 122 1
4 R to L Oval 132 1
limitation of wind value. The output of cluster based on the cluster constrain attribute.
Sample SQL Query
1.select * from max_flow where time>=? and time<=? and wind>=? and wind <=?
2.select *from max_flow where time>=? and time<=? 3.select count(mid) from max_flow where time>=? and time<=? and wind>=? and wind <=?
4.select count(mid) from max_flow where time>=? and time<=?
The above SQL query generates report of cluster data based on constrain specified in run time. The question mark indicates the output display given at the run time.
7. CONCLUSION
The above research describes two different ways of clustering. The first section discusses moving objects with different shapes and all directions of movement. The clustered time considered any one of the shape and also concentrated only one direction and finally the result of clustered output to display all details of cluster data, cluster direction, cluster time and count value of cluster. This will give knowledge of how to cluster specific moving object. The second section describes about real time data collection of hurricane data, here to cluster different types of constrain based, maximum to concentrate at time and wind value based, the clustered object displayed only these checking of constrains not to cluster all. Both the discussions gave details of moving object clustering with more knowledge.
8. REFERENCES
[1]ANTHONY DAVID VENESS A real-time spatio-temporal data exploration tool for marine research, Master of Applied Science University of Tasmania, October 2009.
[2] DIMITRIS PAPADIAS, YUFEI TAO, PANOS KALNIS, JUN
ZHANG, Indexing Spatio-Temporal Data Warehouses, Data Engineering, International Conference 2002
[3] D. LIN, C. JENSEN, B. OOI, AND S. SALTENIS.Efficient indexing of the historical, present, and future positions of moving objects. In MDM, pages 59–66, 2005.
[4]GHAZI H.AL-NAYMAT new methods for mining Sequential and time series Data, PhD thesis, the university of Sydney June 2009
[5] JIAWEI HAN AND MICHELINE KAMBER Data Mining Concepts and Techniques, second edition, Morgan Kaufmann Publishers an imprint of Elsevier
[6]KIMBALL, R. The Data Warehouse Toolkit John Wiley, 1996.
[7]M.PELANIS,S.ˇSALTENIS, AND C.JENSEN. Indexing the past, present, and anticipated future positions of moving objects. TODS, 31(1):255–298, 2006.
[8] N. ROUSSOPOULOS, S. KELLEY, F. VINCENT, Nearest neighbour Queries, Proceedings of ACM SIGMOD Conference, 1995.
[9] RALF HARTMUT GUTING AND MARKUS SCHNEIDER Moving Objects Databases, Elsevier publication, 2005
[10] S.SUDARSAN KRITHIRAMAMRITHAM DataWarehousing and Data mining, IIT Bombay, sudarsha@ cse.iitb.ernet.in,[email protected]
[11]SUBRAMANIAN ARUMUGAM efficient algorithms for spatiotemporal data management, PhD Thesis University of Florida, 2008
[12] TAHER OMRAN AHMED AND MARYVONNE MIQUEL Multidimensional Structures Dedicated to Continuous Spatiotemporal Phenomena Springer-Verlag Berlin Heidelberg 2005, pp 1-12
[13]Z.-H.LIU,X.-L.LIU,J.-W.GE, AND H.-Y.BAE. Indexing large moving objects from past to future with PCFI+-index.In COMAD, pages 131–137, 2005.
[14] KNOPR,E.M.,AND NG,R.T.Finding aggregated proximity relationships and commonalities in spatial data mining.IEEE Transaction on Knowledge and data Engineering 8.6(1996),884-897.
[15] LU,W.,HAN,J.,AND OOI,B.C.Discovery of general knowledge in large spatial database in 1993(singapor:1993),pp.275-289.
[16]SANCHEZ-DIAZ,G.,AND
RUIZ-SHULCLOPER,J.Midmining a logical combination pattern recognition approach to clustring in large data sets.
[17]FISHER,D.,AND LANGLEY,P.Approaches to conceptual clustering.In proceding 9th international joint conference ai(1985),pp.691-697.
[18] The website of http://weather.unisys.com/hurricane/.
ABOUT THE AUTHORS
Capt.Dr.S.Santhosh Baboo, has around Seventeen years of postgraduate teaching experience in Computer Science, which includes Six years of administrative experience. He is a member, board of studies, in several autonomous colleges, and designs the curriculum of undergraduate and postgraduate programmes. He is a consultant for starting new courses, setting up computer labs, and recruiting lecturers for many colleges. Equipped with a Masters degree in Computer Science and a Doctorate in Computer Science, he is a visiting faculty to IT companies. It is customary to see him at several national/international conferences and training programmes, both as a participant and as a resource person. He has been keenly involved in organizing training programmes for students and faculty members. His good rapport with the IT companies has been instrumental in on/off campus interviews, and has helped the post graduate students to get real time projects. He has also guided many such live projects. Lt.Dr. Santhosh Baboo has authored a commendable.