Munich Personal RePEc Archive
Civil-service pension schemes around the
world
Palacios, Robert
World Bank, Axia Economics
May 2006
Online at
https://mpra.ub.uni-muenchen.de/14796/
NO. 0602 S P D I S C U S S I O N P A P E R
Civil-service Pension
Schemes Around the
World
Robert Palacios
Edward Whitehouse
Civil-service pension schemes around the world
Robert Palacios and Edward Whitehouse
May 2006
P
E
N
S
IO
N
RE
FO
RM
PR
I M
ER
re-fo r´m
v.t. &
i.1. ma
ke (in stitu
tion, proc
edur e
etc.) b
etter by re
mova l or a
band onme
nt
of im perfe
ction s, fau
lts or erro
rs
prim ern.
1. ele men
tary b ook t
o
equip perso
n wi th in
Abstract
There are separate pension schemes for civil servants in about half of the world’s countries, including some of the largest developing economies, such as Brazil, China and India. In the higher-income, OECD countries, spending on pensions for public-sector workers makes up one quarter of total pension spending. In less developed countries, this proportion is usually higher. Yet, very little has been written on the design and reform of civil-service pension plans, especially when compared with the voluminous literature on national pension programs.
This paper compares civil service pension schemes across countries in terms of benefit provision and cost. We find that in many developing countries, these expenditures are a greater fiscal burden than in higher income countries where the tax base is larger. The paper also compares schemes within the same country covering private sector workers. Finally, we review key policy issues related to pension schemes covering civil servants as well as other public sector workers. In particular, we find that there is little justification for maintaining parallel schemes in the long run.
Civil-service pension schemes around the world
Robert Palacios and Edward Whitehouse
1May 2006
Edward Whitehouse works at the Social Policy Division of the OECD in Paris and Robert Palacios is Senior Pension Economist, Social Protection Department, World Bank. Correspondence: e-mail: Edward.Whitehouse@oecd.org and Robert Palacios, World Bank, 1818 H St NW,
Washington DC 20435; web-site: http://www.worldbank.org/pensions; e-mail: rpalacios@worldbank.org.
The authors are grateful to Larry Thompson of the Urban Institute and Robert Holzmann, Director of Social Protection at the World Bank for their helpful comments and advice. Montserrat Pallares-Miralles and Yvonne Sin of the World Bank have also provided valuable input. The paper has also benefited from comments at a seminar at the World Bank (July 2004), an Asian Development Bank/International Network of Pension Regulators and Supervisors meeting in Manila (March 2004), World Bank Institute workshops in Malta (June 2003) and Paris (September 2003) and a conference at the Centre for Pensions and Superannuation, University of New South Wales (March 2002). Initial research in this area by Whitehouse was financed by the Initiative for Policy Dialogue at Columbia University, New York.
PE
NS
I O
R
N
E
FO
R
M
P
R
IM
E
R
re-fo r´m v.t.& i.1. m ak
e (ins titu
tio n, pr
oced ure
etc
.) b ett
er by rem
ov al o
r aba nd
onm en
t of im
pe rfe
ctio ns
, fa ults o
r e rrors prim
er n. 1. ele
m en
tar y b
oo k to eq
uip p ers
on w ith in form ation pe´n sion n.1. perio
dic pa
yment
made
on re
tireme
nt or
abov
e spe
cified
Table of Contents
1. Introduction and overview...7
2. Key design features of civil service pension schemes ...10
2.1 Institutional arrangements ...11
2.2 Eligibility criteria: pension age and length-of-service conditions ...12
2.3 Replacement rates and indexation provisions ...15
2.4 Sources and method of financing...20
3. Reforming civil service pensions: key issues ...22
3.1 Fiscal impact ...23
3.2 Labor market impact ...40
3.3 Dualism and integration...57
4. Sub-national government, public enterprises and military personnel ...64
5. Conclusion ...73
6. Bibliography...76
Annex 1: Civil-service pension arrangements ...81
Annex 2: Notes on tables ...84
Tables
Table 1: Retirement age and service criteria for civil-service ...14
Table 2: Accrual rates and maximum pension replacement rates for civil servants versus replacement rate for national-scheme, full-career worker...16
Table 3: Indexation procedures for pensions in payment, civil-service schemes...17
Table 4: Accrual rates and indexation provisions for DB civil service pensions for full career workers in selected non-OECD countries, 2004 ...19
Table 5: Central government employment, 1980s and 1990s ...28
Table 6: Implicit pension debt of civil service and national schemes ...36
Table 7: Recent reforms to civil-service pension schemes in OECD countries...37
Table 8: Parametric reforms to national and civil service pension schemes ...40
Table 9: Vesting periods for civil service schemes in selected countries...44
Table 10: Portability and preservation of pension rights ...45
Table 11: Integration of civil service pension schemes ...61
Table 12: Structure of state pension schemes, United States ...65
Figures
Figure 1: Institutional arrangements for civil-service pensions by region ...12Figure 2: Financing of civil servant versus national schemes ...21
Figure 3: Expenditure on pensions of civil servants, high-income, OECD countries ...24
Figure 4: Expenditure on civil-service pensions, non-OECD countries...25
Figure 5: Expenditure on civil-service pensions, OECD countries ...26
Figure 6: Expenditure on civil-service pensions, non-OECD countries...27
Figure 8: Age distribution of pension scheme members...30
Figure 9: Spending on central-government wages and pensions, ...33
Figure 10: Spending on civil service pensions, share of GDP, Bangladesh, Mexico, Nepal, 1992-2004...34
Figure 11: Spending on civil service pensions ...34
Figure 12: Civil service wage compression, Nepal 1970-2003 ...42
Figure 13: Value of accrued pension rights by age, Mauritius...46
Figure 14: The pension cost of moving jobs, Mauritius...47
Figure 15: Value of accrued pension rights by years of service, Cape Verde...48
Figure 16: Pension cost of leaving a civil-service job, Cape Verde ...49
Figure 17: The pension cost of moving jobs, United Kingdom ...50
Figure 18: The pension cost of moving jobs, Germany...51
Figure 19: Job mobility in different sectors ...52
Figure 20: Pension spending for civil servants and military in India and Pakistan ...70
Civil-service pension schemes around the world
Robert Palacios and Edward Whitehouse
1. Introduction and overview
Civil servants and other public-sector employees — in the military, education,
publicly owned enterprises etc. — were often among the first groups of workers to be covered by government-sponsored pension schemes (see Box below). In a handful of
countries — including Bangladesh, Bhutan, Botswana, Eritrea, Lebanon and the Maldives —
public-sector employees are still the only group covered by a formal pension scheme.
The rationale for providing pensions for government employees was somewhat
different from that behind the creation of national pension schemes.2 Among the objectives
particular to schemes for government workers were the following:
• securing the independence of public servants;
• making a career in public service attractive;
• shifting the cost of remunerating public servants into the future; and
• retiring older civil servants in a politically and socially acceptable way.
When mandatory pension coverage was expanded to the private sector, there often
seemed little point in including civil servants — who already had their own arrangements —
in new national schemes. Civil servants have also proved powerful in protecting their own
financial interests. Furthermore, while civil-service pension schemes share some of the
social-policy goals of national pension programmes, they must also accommodate the
government’s human-resources policy as an employer. For these reasons, special
retirement-income schemes for the public sector have often persisted. The issue of
2 Throughout this paper, the term ‘national pension scheme’ is used to refer to plans that cover
‘dualism’3 — whether civil-service schemes are integrated with national schemes covering
private sector workers or are separate — is a central policy question in those countries where
parallel systems remain.
This paper focuses on countries with separate civil-service pension schemes (or
where only civil servants are covered). Although schemes covering sub-national
governments — local authorities and states in federal countries — and public-sector
enterprises are discussed, the focus is on federal level civil servants. Similarly, pension
arrangements for the military are sometimes integrated with other public-sector workers and
sometimes provided separately. Again, the focus is, where possible, on the civil-service
pension program.
The objective is, first, to review the data and information available on civil-service
pensions at a global level; and, second, to provide some guidance as to good policies and
practices. The main policy issues fall into three broad categories. First, what is the impact
of civil servant pensions on fiscal policy and how does it differ from other schemes? The
second is how civil-service pensions affect labor markets, which also touches on general
questions of civil-service remuneration and compensation. While both topics are also
relevant for a diagnosis of a national pension scheme, closer inspection reveals analysis and
reform of civil servants’ pensions pose special challenges. The third area of interest —
whether maintaining administratively separate schemes for public-sector workers is justified
— has already been noted. Our general conclusion is that the costs of ‘dualism’ generally
outweigh the benefits, especially in countries with small populations and/or limited
pension-system coverage. However, there are obstacles to integration, such as administrative
complexity, fiscal implications and the political economy of such a change.
The paper is structured as follows. Section 2 reviews the design of civil service
schemes around the world and compares them to national schemes where information is
available. The general finding is that civil service pension schemes offer more generous
terms, tend to have lower funding ratios and have higher per member liabilities than other
3 In practice, some countries have many more than two, parallel schemes. For example, some cover
schemes. In many countries, civil service pensions are becoming a major fiscal burden,
threatening to crowd out other programs, especially in low-income countries with limited tax
bases. Indeed, many of the lowest-income countries have already requested technical
assistance and financial support for reform of public-sector pension schemes from the
World Bank and other international organizations.
In Section 3, we address the three policy questions raised above: fiscal implications,
labor-markets effects and the rationale for dualism. The differences between analysis of
national pension schemes (for private-sector workers) and of civil-service programs have
important implications for the type of reforms — parametric and systemic — that can be
contemplated.
Section 4 discusses pension schemes that cover employees within the broadly
defined public sector other than federal civil servants. The most important of these are
those for the military, public-sector enterprises and sub-national government. We find that
many of the arguments regarding dualism apply here as well. This section argues that
customized solutions within an integrated system are possible, even for groups with risks
that are difficult to pool, such as the military.
Section 5 summarizes the results of the study and draws some tentative conclusions
Box. A brief history of early pension schemes
The military was typically the first to receive pension coverage, especially with regard
to disability and survivor benefits. The English and Spanish governments were already
providing pensions to their veterans in the 17th century and a naval pension was set up in the
United States before it had even ratified its Constitution in 1787.4
In his study of the origins of the British civil service pension scheme, Raphael (1964)
finds that the first provisions were made on a discretionary and individual basis.5 These
evolved into a more formal system with the first superannuation fund for public sector
workers introduced in 1712 for customs officials. In 1810, the foundation of the British civil
servants scheme was legislated by Parliament. While the parameters described in the original
Act would be changed many times subsequently, the underlying model of a generous and
non-contributory pension scheme survived nearly two centuries and was inherited by dozens
of former British colonies.
2. Key design features of civil service pension schemes
This section reviews the main rules and parameters of civil-service pension
programs. The parameters include eligibility criteria, the defined benefit formula and
contributions from the employee and from the government as employer. Where possible,
comparisons with the national scheme that covers other formal sector workers are
presented.
4 Clark, Craig and Wilson (1999).
5 According to his research, the first person awarded a civil service pension was Martin Horsham, an
2.1 Institutional arrangements
With information for 158 countries, a little more than half can be categorized as
having separate retirement-income arrangements for civil servants.6 (The Tables in Annex 1
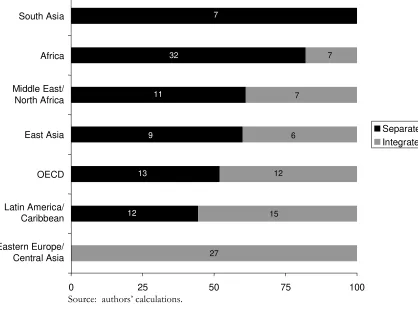
provide more details on individual countries.) Figure 1 shows substantial regional variation
in the prevalence of parallel schemes. They are found throughout South Asia (seven
countries) and in most of Africa (32 out of 39 countries). They are more common than
integrated schemes in the Middle East/North Africa and East Asia. Integrated schemes are
more common in Latin America and are universal in Eastern Europe/Central Asia. The
regional patterns mostly reflect historical differences. For example, Anglophone African and
South Asian scheme were inherited from British colonial rule. In contrast, integration was a
natural arrangement under socialism in Eastern Europe and the FSU.
There are, naturally, many gray areas in this analysis. This is because of the
complexity of most countries’ pension arrangements.
In 12 OECD countries, for example, civil servants are covered by the national
pension scheme but have their own, top-up retirement-income arrangements. These
countries are counted as ‘integrated’ in Figure 1. This group includes Canada, Ireland and
Spain — with additional defined-benefit pensions for civil servants — and the United States
— which has a top-up defined-contribution arrangement, known as the Thrift Savings Plan,
and a legacy system. In many of these countries, many private-sector workers have
voluntary top-up arrangements, often with similar rules to the civil-service scheme. In two
OECD countries — Australia and the United Kingdom — civil servants are covered by part
of the mandatory pension arrangements that cover private-sector workers. The integrated
model with special top up schemes is not common outside the OECD countries and we
cannot cite any examples.
Figure 1: Institutional arrangements for civil-service pensions by region (per cent of and number of countries with integrated or separate programs)
0 25 50 75 100
Eastern Europe/ Central Asia Latin America/ Caribbean OECD East Asia Middle East/ North Africa Africa South Asia
Separate Integrated
7
32 7
12 15
27
13 12
9 6
11 7
Source: authors’ calculations.
2.2 Eligibility criteria: pension age and length-of-service conditions
Table 1 shows the pension eligibility age in civil-service schemes; data for national
schemes are shown for comparison where available. The normal retirement age is found to
be the same or lower for civil servants in most countries. Furthermore, evidence for a range
of developing countries suggests that civil servants have a longer life expectancy than the
rest of the population. This further adds to the longer average duration of retirement of civil
servants compared with others arising from the earlier pension eligibility age.
The age criteria for pension receipt have often not changed over many years or even
national schemes.) However, a few countries have increased the age recently, as in the case
of Senegal where normal retirement age was increased from 55 to 60 in 2001.
The mean normal pension age for men in the civil service is 58.6. In some cases, the
age is lower for women. Again, different ages between the sexes are still often found in
national schemes.
Eligibility is sometimes tied only to length of service, but more rarely than in the
past. For example, Brazil introduced a pension eligibility age in 1998 and Turkey has been
phasing in such a condition since 1999. It is still the case in Mexico — where men can retire
at any age after 30 years of service and women after 28 years — and in Iran — where civil
servants can retire regardless of age after 20/30 years (women/men). In the Maldives,
individuals can receive pensions after 20 years without leaving active service. They can
receive a second or even third pension each time they meet the length of service condition.
Table 1: Retirement age and service criteria for civil-service versus national pension schemes, 2004
Civil-service scheme National scheme
Minimum Normal Years of service Minimum Normal Years of service
High-income OECD countries
Australia 55-60 55 65
Austria 60 56.5/61.5 60/65
Belgium 60 60 65
Canada 55 65 25 60 65
Denmark 60 67 67
Finland 60 63-65 60 65
France 60 56 60
Germany 62/63 65 63 65
Greece 60 57 65
Iceland 60 65 67
Ireland 65 66
Japan 65 25 55 65
Luxembourg 57 65
Netherlands 61 65 60 65
Norway 62 67 62 67
Portugal 60 36 55 65
Spain 60 30 60 65
Sweden 60 65 61 65
Switzerland 60 62 63 64/65
United Kingdom
50 60 65
United States 62 67
Latin America/Caribbean
Brazil 55/60
Mexico 55 15 60 65
Paraguay 50 60 30 60 25
Africa
Burkina Faso 53 60 55 15
Burundi 55/60 55 15
Cameroon 60 15
Cape Verde 60 60/65 3
Cote D’Ivoire 55/60
Ethiopia 55 10 no scheme
Kenya 50 55 10 50 55
Malawi 55 20 no scheme
Mauritius 60 15 60
Nigeria 50 60 10
Senegal 60 60
Togo 55 15
Zambia 50 55 10 55
Middle East/North Africa
Bahrain none 60 15-25 45 55/60 15/20-10/15
Iran none 60 20/30-0 none 60/55 20/30-10
Lebanon 60 25 no scheme
Morocco none 60 21/15-0 60 15
Tunisia 50 60 15 50 60 30-10
West Bank/Gaza none 60 20-15 no scheme
Yemen none 55/60 30-15 none 55/60 30/25-15
South Asia
Bhutan 60 no scheme
Nepal 50 58 20 no scheme
India 60 58
Maldives none no scheme
Pakistan 60
Sri Lanka 60 55
East Asia/Pacific
China 50/55 55/60 30 55/60 20
Indonesia 50 56 20
Korea 60 65
Malaysia 50 55 10
Philippines 60 65 15
Thailand 50 10 55 15
Note: where pension ages differ between men and women, the ages are shown F/M. Similarly, where the contribution requirement differs between men and women, they are shown F/M. Where the contribution requirement is stricter for early retirement than it is for claiming the pension at the normal pension age, the years are shown early-normal
Where there is a combination of age and service conditions, the service period
requirement is typically not binding. Some two-thirds of countries require service of 21
years or less. Most of these countries still operate a system of lifetime civil-service
employment with maximum ages of entry to the public sector. People will therefore have
typically reached the years-of-service requirement when they reach the pension age.
However, the years-of-service requirements and vesting rules may have an important impact
on flexibility, mobility and equity in certain cases. This is discussed later in Section 3.
2.3 Replacement rates and indexation provisions
The vast majority of civil service pension schemes are of the defined-benefit type.
This section looks at their benefit formulae and their provisions for uprating pensions in
Table 2 shows, first, the accrual rates in civil-service pension schemes in selected
OECD countries (including some schemes where there is a supplementary pension in
addition to the national scheme, i.e., partial integration). These are the pension entitlement (as a proportion of the relevant earnings base) that is awarded for each year of service.
Usually, these are linear: that is, a single rate applied to each year of service. The table also
gives the pension replacement rate for a full-career worker in the civil service. This averages
a little more than 75 per cent, with a range from 50 to 100 per cent. The table also gives the
replacement rate under the national pension scheme for a full-career worker earning the
economy-wide average.7
In EU countries, the terms of civil service schemes are in many respects similar to
those of national pension schemes. In Finland, the Netherlands and Sweden, for example,
occupational schemes for private-sector employees offer the same or very similar terms as
the public-sector scheme (in the first case by law and in the second and third, by collective
[image:18.612.108.507.403.643.2]agreements).
Table 2: Accrual rates and maximum pension replacement rates for civil servants versus replacement rate for national-scheme, full-career worker
Country Accrual rate
(civil service)
Maximum replacement rate
National scheme OECD countries
Australia 1.65-3.4 66-88 52
Austria 2 80 80
Belgium 1.667 75 60
Canada 2 90 56
Finland 1.5 60 60
France 2 75 71
Germany 1.875 75 46
Greece 1.714 69
Iceland 1.9 76 73
Italy — 80 66
Luxembourg 1.667 83 71
Norway 2.2 66 53
Portugal 2 80
Spain — 95 88
Sweden 0.33/2.17 73 76
Switzerland — 65 58
United Kingdom 1.25 67 37
Note: the accrual rate varies with the earnings level in Sweden
In a few countries, there are sizeable differences. In Germany, for example, a
full-career, private-sector worker on average earnings can expect a replacement rate of
around 40 per cent compared with 75 per cent for the civil-service plan. In the United
Kingdom, the replacement rate from the basic scheme plus the public, earnings-related
scheme for a similar worker would be around 35 per cent, compared with 67 per cent from
the civil service scheme. The former civil servant would receive the basic pension on top,
worth around 15 per cent of average earnings currently. The civil service scheme is also
more generous than the benefits arising from mandatory provision for private-sector
workers in Spain and Switzerland. In all these countries, some private-sector employers
offer occupational plans that can give replacement rates nearer to those applying in
civil-service pension schemes.
Indexation of pensions in payment tends to be more favourable in civil-service
schemes in OECD countries than those applied in the main national scheme. The latter are
nearly always based on prices (Table 3). Of the six countries that index pensions of civil
servants to wages, three have either price (France, Brazil and Mexico) or discretionary
adjustments (Turkey) in the other scheme. Naturally, this indexation is only more favourable
[image:19.612.133.484.464.596.2]than uprating in line with prices if real wages rise over time.
Table 3: Indexation procedures for pensions in payment, civil-service schemes
Prices Civil service earnings Economy-wide earnings
Combination
Australia Austria Norway Belgium
Canada France Denmark
Iceland Germany Finland
Italy Brazil Greece
Spain Mexico Luxembourg
Sweden Turkey Netherlands
Switzerland Portugal
United Kingdom
Table 4 compares accrual rates and indexation methods for schemes covering public
and private sector workers in 32 middle and low income countries. Again, the pattern is that
conditions in civil service schemes are more generous. Indeed, in several countries, there is
per cent lower for private workers in the formal sector than they are for civil servants.
These accrual rates are based on full career comparisons and therefore do not take into
Table 4: Accrual rates and indexation provisions for DB civil service pensions for full career workers in selected non-OECD countries, 2004
Civil service National scheme
Accrual rate (%) Indexation Accrual rate (%) Indexation Latin America/Caribbean
Brazil 2.86 D D
Honduras 2.25 D 1.875 D
Mexico 2.375 D DC P
Paraguay 3.1 D 2.5 D
Venezuela 2.5 W 1.375 D
Africa
Benin 2 D 1.71 D
Burkina Faso 2 P 1.33 P
Burundi 1.67 D 2 D
Cape Verde 2.9 W 2 D
Cote D’Ivoire 2 D 1.7 W
Gabon 2 D 1.57 D
Madagascar 2 D 2 D
Mali 2 D 1.67 P
Mauritius 2 W D
Nigeria 2 D 1.875 D
Senegal 2 D 1.0 D
Togo 2 W 1.33 P
Middle East/North Africa
Djibouti 2.25 D 2.0 D
Iran 3.3 D 3.3 D
Morocco 2.5 W 2.0 D
Tunisia 1.75 W 1.875 D
South Asia
Bangladesh 3.2 D None n.a.
Bhutan 2.0 W None n.a.
India* 1.52 P and D 1.52 D
Maldives 2.5 D None n.a.
Nepal 2.5 2/3 W DC n.a.
Pakistan 2.33 D 2.0 D
Sri Lanka 3.0 D DC n.a.
East Asia
Indonesia 2.5 D DC n.a.
Korea 2.3 n.a. n.a.
Malaysia 2.0 D DC n.a.
Philippines 2.18 D 2 D
Thailand
Note: D = discretionary; P = prices, W = wages, DC = defined contribution; n.a. = information not available. * India refers to old civil service pension scheme.
Comparisons of the effect of indexation procedures on pension benefits are
ad-hoc changes in benefit levels tend to reflect the financial condition of each pension fund or, in the case of public-sector workers, the budget situation more generally. Their level is
also influenced by the relative political strength of civil servants and their representative
organizations. Where automatic indexation is present, however, it usually favors former civil
servants over members of the national pension scheme.
In practice, lack of automatic indexation — in both civil-service and national pension
programs — leads to large and discrete changes in the real value of pensions. In the former
case, these are often tied to similarly dramatic changes in civil-service pay. In India, for
example, pension increases have been negotiated along with wages and other benefits for
civil servants every decade or so as part of the pay-commission system that has prevailed for
most of the last century. The result is an unpredictable income stream for pensioners and
large income differences between cohorts depending on the year that they happen to retire.
Another interesting indexation practice is differential adjustment in low and high
pension values. This can be achieved either by raising lower pensions with a higher
percentage adjustment or by increasing all pensions by flat amounts. This practice parallels
the wage compression that has been typical in many developing-country civil services in the
last few decades (see below).
2.4 Sources and method of financing
A third aspect of pension system design that often varies between public- and
private-sector schemes is the type of financing.
The first important distinction is the extent to which schemes accumulate reserves to
meet their future liabilities. Civil-service schemes are generally financed on a pure,
pay-as-you-go basis. Less than one in four plans has accumulated any reserves. In contrast, slightly
more than half of national schemes have some reserves.
As in the case of national schemes, recent reform trends have led to more funding in
the form of new defined contribution schemes. Recent examples include Thailand (1997),
Australia (2005). (Annex 3 lists the countries in which civil servants participate in either an
integrated or a parallel DC scheme.) The pattern of funding also reflects the fact that many
of the national schemes with fully funded components are found in Latin America and
Eastern Europe. In the case of Eastern Europe, national schemes already covered civil
servants albeit often with different rules for different groups of workers. The Latin
American reforms that introduced mandatory, defined-contribution plans integrated separate
civil service schemes during the reform process (with the exception of Mexico).
[image:23.612.104.487.300.489.2]
Figure 2: Financing of civil servant versus national schemes
Civil servant schemes
PAYGO/unfunded partially funded
fully funded
National schemes
fully funded
partially funded
PAYGO /unfunded
Source: authors’ calculations.
A second issue in the financing of the schemes is the role of contributions from
employers (i.e., the government in the case of civil-service schemes) and employees. Around one in four of the unfunded schemes are ‘non-contributory’8 in the sense that there are no
explicit contributions levied on either employer or employee. The government simply picks
up the bill for civil-service pensions. They are found almost exclusively in former British
colonies in the Caribbean, sub-Saharan Africa and South Asia.
To a certain extent, whether or not pension spending is financed through
contributions, as opposed to direct budget support, is immaterial. This is particularly clear
with employer contributions from the government where it would simply entail re-labeling
the flows with no impact on consolidated deficits. Even in the case of an employee
contribution, it can be argued that since civil service wages are not determined freely and
negotiations are based on net wages, the incidence of an employee contribution would still
fall on the budget. On the other hand, the lack of an earmarked contribution reduces
transparency and can make certain reforms more difficult – including integration of
civil-service and national schemes.
The important point to be taken from this brief look at financing arrangements is
that pre-funding of retirement-income liabilities is less common for civil servants’ pensions
than for national programs. Combined with the greater generosity that characterizes
civil-service schemes and the large share of the formal sector working in low-income
countries’ public sector, the burden of civil-service pensions on the budget may be
significant. Just how much so is explored in the next section.
3. Reforming civil service pensions: key issues
A growing number of countries with separate civil service pension schemes are
considering different reform options. These efforts are largely motivated by fiscal pressures.
Pay-as-you-go civil-service schemes are maturing, resulting in an increase in the ratio of
pensioners to workers. While there is significant variation across countries, there is a general
upwards trend in spending on civil service pensions. This section presents available figures
on the magnitude of the pension share in public spending and on the demographic
development of civil-service and national schemes. It also considers the options and the
arguments for reducing the cost of pensions to the government budget. It will become
apparent that there are important differences in how parametric reforms affect the fiscal
Likewise, changes to the pension scheme for civil servants must take into account
the specific labor-market and human-resource considerations that arise when the
government is both the employer and the plan sponsor. While private-sector workers are
typically mobile (between jobs), the emphasis in the public sector has been on stability:
ensuring that all workers remain in the public sector for a considerable period, if not their
whole career. More recently, the government has increasingly required a flexibility that
traditional pension arrangements cannot deliver: for example, in public-sector reform
(outsourcing, downsizing, divestiture, privatization etc.) and in making efficient use of scarce human capital (recruitment of private-sector expertise).
The third topic of this section is the institutional arrangements for civil-service
retirement incomes: specifically, ‘dualism’ in public-sector pension provision versus
integration with the national pension system. This section explores some of the practical
issues in a policy of integration, including fiscal and labor-market effects.
3.1 Fiscal impact
The last section provided evidence suggesting that civil servants’ pension benefits
were generous relative to those covering the private sector. They were also less likely to
have accumulated reserves to offset liabilities. The demographic position of civil-service
pension schemes are often less favorable than national programs (i.e., civil servants tend to
have a higher median age and the schemes are at a later stage of maturation). As a result, the
share of the budget devoted to civil-service pensions has grown rapidly in many countries.
This in turn has often motivated reform proposals.
Current spending levels
The OECD countries currently spend an average of nearly two per cent of GDP on
pensions for civil servants and other public-sector workers. But, as Figure 3 shows, there is
generosity of benefits. For example, expenditures are low despite high accrual rates in
[image:26.612.98.501.127.460.2]Canada and Spain. The relative size of the civil service is a better predictor.
Figure 3: Expenditure on pensions of civil servants, high-income, OECD countries
(per cent of GDP)
0 0.5 1 1.5 2 2.5 3 3.5 4
Ireland (00) Spain (00) Japan (00) Netherlands (00) Denmark (00) Canada (01) Australia (01) Germany (00) United States (01) Finland (00) United Kingdom (00) France (00) Belgium (98) Austria (00)
Source: OECD Social Expenditures Database
This ratio also varies greatly across low- and middle-income countries. Figure 4
shows a range from less than 0.5 per cent of GDP to more than two per cent of GDP. The
average spending on civil-service pensions is around 1.2 percent of GDP, or about 60 per
Figure 4: Expenditure on civil-service pensions, non-OECD countries (per cent of GDP)
0.0% 1.0% 2.0% 3.0% 4.0% 5.0%
Nepal (05) Bangladesh (02) Iran (01) Venezuela (01) Indonesia (02) Pakistan (03) Mexico (01) Korea (97) Philippines (97) Cameroon (01) Senegal (04) China (02) Benin (98) Morocco (02) Cape Verde (04) Kenya (02) Jordan (02) Nigeria (02) Malaw i (99) India (04) Mauritius (00) Sri Lanka (02) Turkey (03) Zimbabw e (01) Tunisia (02) Brazil (04)
per cent of GDP
Average 1.33
Source: World Bank pension database. India includes state level pension spending.
The ratio of spending to GDP provides an incomplete picture of the fiscal burden of
civil-service pension schemes. In OECD countries, tax revenues average nearly 37 per cent
of GDP.9 Revenues are more limited in most developing countries. Ultimately, both the
wage and pension bills of the public sector are constrained by the revenues available to the
government and its ability to borrow. It follows, therefore, that the opportunity cost of
paying civil-service pensions is more accurately captured by the share of available public
money that this expenditure consumes. A better indicator of the fiscal pressure of
civil-service pension spending than its ratio to GDP is therefore its ratio to government
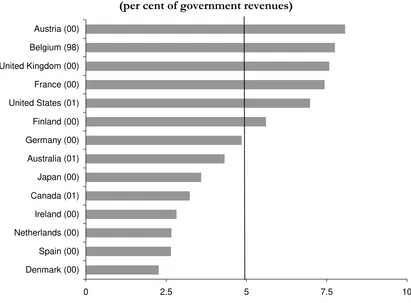
revenues. This is shown in Figure 5 and Figure 6. In the OECD countries, it varies between
2.5 and 7.5 per cent of general government revenues, with an average of five per cent.
In developing countries, the range is much larger: from two to 12 per cent of
revenues. The average is around six per cent: significantly higher than the average in the
OECD countries. In Brazil and Sri Lanka, one tenth or more of available revenues are used
to finance civil service pensions. (Note that the figure for India understates the fiscal burden
since it excludes state civil service pensions and Indian states depend heavily on federal
[image:28.612.100.511.290.593.2]transfers.)
Figure 5: Expenditure on civil-service pensions, OECD countries (per cent of government revenues)
0 2.5 5 7.5 10
Denmark (00) Spain (00) Netherlands (00) Ireland (00) Canada (01) Japan (00) Australia (01) Germany (00) Finland (00) United States (01) France (00) United Kingdom (00) Belgium (98) Austria (00)
Figure 6: Expenditure on civil-service pensions, non-OECD countries (per cent of government revenues)
0% 5% 10% 15%
Mexico (01) Nepal (05) Indonesia (02) Iran (01) Cameroon (01) Pakistan (03) Philippines (97) Nigeria (02) Morocco (02) Korea (97) Jordan (02) Bangladesh (02) Kenya (02) Cape Verde (04) Senegal (04) Mauritius (00) Benin (98) Tunisia (02) Malawi (99) Turkey (03) Sri Lanka (02) India (04) Brazil (04)
per cent of revenues
average = 6.8%
Source: World Bank pension database. Data for India apply to federal level only.
Age distribution and internal demographics
Table 5 shows that the growth in the number of civil servants has not kept up with
the growth of the population in the 1990s. In both developing and OECD countries,
central-government employment has fallen relative to population by a full percentage point.
This is equivalent to a decline (again, relative to population) of around a third in the OECD
Table 5: Central government employment, 1980s and 1990s (per cent of total population)
early 1980s early 1990s
Africa 1.8 1.1
Asia 2.6 1.1
Latin America 2.4 1.5 All developing countries 2.2 1.2
OECD 2.9 1.9
Source: Heller and Tait (1983) and Schiavo-Campo, de Tommaso and Mukherjee (1997b)
As a result of these growth patterns, we would expect that the internal demographics
of civil service schemes would diverge from that of the general population and from those of
the national pension scheme in particular. We would expect that in many countries civil
servants would be older, on average, than the national labor force and that the base of the
contributor pyramid may not be expanding over time. Finally, civil-service schemes often
started earlier than national schemes did.
Evidence of the age structure of the civil service is difficult to find. Here, we present
detailed age distribution from three countries – Brazil, Egypt and Iran – based on data
collected by the World Bank for the purposes of projecting pension spending.
Figure 7 and Figure 8 below compare the age distribution for members of the
pension schemes covering private sector workers with the age distribution of civil servants.
In Brazil and Egypt, the expected pattern emerges: the median age of civil servants is higher
by 10 and 5 years, respectively. The scheme covering private sector workers looks much
more like a pyramid with an expanding population base while the civil service bulges in the
40+ age brackets, probably reflecting past hiring expansions followed by more recent
stagnation.
Iran’s civil service and private formal sector in contrast, do appear to have similar age
profiles. The common feature in all three countries is that the private sector distribution has
longer tails at each end of the age range. This would be expected given the tendency for
governments to hire graduates and to place minimum age restrictions as well as mandated
Figure 7 Cumulative age distribution of civil servants and private-sector workers Brazil, 1998 0% 10% 20% 30% 40% 50% 60% 70% 80% 90% 100%
20 23 26 29 32 35 38 41 44 47 50 53 56 59 62 65 68 71 74 age c u m u lat iv e sh ar e o f m em b er s civil servants private sector Iran, 2001 0% 10% 20% 30% 40% 50% 60% 70% 80% 90% 100%
1 4 7 10 13 16 19 22 25 28 31 34 37 40 43 46 49 52
Egypt, 2005 0% 10% 20% 30% 40% 50% 60% 70% 80% 90% 100%
18 21 24 27 30 33 36 39 42 45 48 51 54 57 60 63
age c u mu lt a tiv e % o f me mb e rs civil servants private sector
[image:32.612.169.490.77.315.2]Source: Authors’ calculations
Figure 8: Age distribution of pension scheme members
Iran, 2001 0.0% 0.5% 1.0% 1.5% 2.0% 2.5% 3.0% 3.5% 4.0% 4.5% 5.0%
20 24 28 32 36 40 44 48 52 56 60 64
Age % o f m e mb e rs civil servants
Brazil, 1998
0.0% 1.0% 2.0% 3.0% 4.0% 5.0% 6.0%
19 22 25 28 31 34 37 40 43 46 49 52 55 58 61 64 67 70 age
pe
r
c
e
nt of m
e
m
b
e
rs civil servants
private sector
Egypt, 2005
0.0% 1.0% 2.0% 3.0% 4.0% 5.0% 6.0%
18 21 24 27 30 33 36 39 42 45 48 51 54 57 60 63
age
p
er
cen
t o
f m
em
b
er
s
Civil servants private sector workers
Both of these factors — late entry and early retirement — are likely to affect the
internal demographics of many civil service schemes in countries with dual pension systems.
In addition, as civil service jobs are more stable, it is likely that ‘contribution densities’ are,
on average, higher in civil service schemes.10 In defined benefit schemes, a higher average
contribution period will generally translate into higher benefits and will allow the worker to
meet the vesting requirements at an earlier age. Both of these factors would lead to earlier
retirement. Finally, some countries have used early retirement as part of a civil service
downsizing exercise. This too would also tend to reduce the proportion of older members
relative to the private sector scheme.
Recent spending trends
While growth in the civil service, along with wage bills has often slowed or even
stopped in developing countries, the pension bill for public-sector employees has often
continued to grow rapidly. This is not surprising, given the long lag between the reduction
in employment and the reduction in the number of retired civil servants (and their
survivors). This ‘inertia’ in pension spending can even be exacerbated when the pension
scheme is used to facilitate ‘downsizing’ (for example, through special incentives to retire
early).
Figure 9: Spending on central-government wages and pensions, Brazil 1987-1998
0 50 100 150 200 250 300 350 400 450 500
1987 1988 1989 1990 1991 1992 1993 1994 1995 1996 1997 1998
In
d
ex
198
7=
100
wage bill pension bill
Source: World Bank (2004).
Data on trends in civil-service pension spending in some of the larger developing
countries shows a rapid increase compared to wages, the government budget and national
income. An extreme example can be seen in Figure 9. This shows the pattern in Brazil
between 1987 and 1998. In this case, spending on pensions grew twice as fast as wages.
Recall from Figure 6 above, that Brazil ranked first in civil service pension spending for the
countries where data are available. The pension burden contributed significantly to fiscal
woes faced by Brazil and has been the target of reforms for almost a decade. Despite
attempts to rein in spending however, little progress has been made.
Figure 10 shows civil service pension spending rising in Bangladesh, Mexico and
Nepal in the 1990s. (Note that Mexican state government employees are almost double the
federal figure and as such these figures are a significant underestimate of the total burden of
public-sector pensions.) Although data are not available for many countries, we would
anticipate this pattern to be repeated elsewhere. Figure 11 shows the same indicator for
India from 1990-2004. Most growth is due to spending on pensions for state level civil
Figure 10: Spending on civil service pensions, share of GDP, Bangladesh, Mexico, Nepal, 1992-2004
0.0% 0.1% 0.2% 0.3% 0.4% 0.5% 0.6%
1990 1991 1992 1993 1994 1995 1996 1997 1998 1999 2000 2001 2002
p e r c e nt of G D P Nepal
Mexico - federal only Bangladesh
Source: Government budget data; IMF IFS statistics. Data for Bangladesh includes military pensions that represented on average about ten per cent of total spending.
Figure 11: Spending on civil service pensions as share of GDP, India 1990-2003
0.0% 0.5% 1.0% 1.5% 2.0% 2.5% 1990 -91 1991 -92 199 2-93 1993 -94 1994 -95 199 5-96 1996 -97 199 7-98 1998 -99 19 99-2000 20 00-2001 200 1-20 02 20 02-2003 2003 -2004 pe r c e n t of G D P Total states central defense
[image:36.612.144.483.401.635.2]Unfunded liabilities
Pension policy has a long lead time: the rules and parameters today will affect
members’ benefits and so governments’ liabilities for decades to come. Periodic reviews of
the long-term financial position of pension schemes — particularly those financed on a
pay-as-you-go or partially funded basis — are an essential input to the policy-making
process. Some countries have not carried out such reviews either of their national or
public-sector pension programs. Others assess the financial situation of the national pension
scheme but not the civil-service plan. Many countries have therefore called on the World
Bank and other international organizations to help in preparing long-term projections of the
finances of both national and civil-service pension schemes.
Table 6 shows a number of financial indicators for four countries’ national and
civil-service pension plans. The second indicator, shown for a larger range of systems above,
is the current spending as a proportion of GDP.
However, this indicator does not capture the ‘inter-temporal’ nature of the pension
promise. Nor does it reflect the demographic challenges that will be faced by pension
systems in the future. Projections of future spending, based on today’s policies over
parameters and rules, can be summarized in a single number. This is essentially the net
present value of future pension spending commitments. It is commonly known as the
‘implicit pension debt’, or IPD. 11
The IPD name is designed to show that pension commitments are a kind of debt
with some characteristics in common with conventional public-sector debt, such as
government bonds. Unlike conventional debt, however, the implicit debt accruing in
pension promises is not reported on the government’s balance sheet. But it can still place
important limits on fiscal policy. Indeed, the IPD is often large relative to conventionally
defined public debt. While the estimates in Table 6 are sensitive to discount rates and other
assumptions, the magnitudes of the IPD are striking under any reasonable values for these
variables. For example, Turkey and Brazil have liabilities for civil service schemes equivalent
Table 6: Implicit pension debt of civil service and national schemes (selected countries)
Implicit pension debt (% of GDP)
Current spending (% of GDP)
Coverage (% of labor
force)
IPD/coverage
Civil
service
National Civil service
National Civil service
National Civil service
National
Brazil 1998 92 284 1.7 6.2 2 27 46.0 10.5 Iran 2001 38 64 0.5 0.7 8 32 4.1 2.0 Korea 1995 7 33 0.2 0.3 1 23 7.0 1.4 Philippines 1997 17 90 0.2 0.8 3 40 5.7 2.3 Turkey 1997 75 71 1.7 2.5 5 25 15.0 2.8
Source: Holzmann et al. (2004); Robalino (2006).
The IPD of national pension programs is three times that of the civil-service scheme
in Brazil and around five times higher in Korea and the Philippines. However, national
schemes in all four cases cover many more workers than the civil-service scheme does, as
shown by the third indicator in Table 6. The IPD divided by the coverage rate shown as the
final indicator in Table 6, adjusts for the number of workers. By this measure, the average
IPD per civil servant covered is more than double that of the average private sector worker
in Iran and the Phillipines and four-to-five times higher in the other three countries.
Improving civil service scheme finances
The measures that can be taken to reduce civil service pension liabilities are broadly
the same as those that can be applied for national schemes. Table 7 illustrates most of the
alternatives through the changes adopted in a range of OECD countries. It is clear that
most are motivated by fiscal pressures, since they either reduce the generosity of pensions,
reduce the number of beneficiaries by increasing retirement age or increase contribution
revenues.
Table 7: Recent reforms to civil-service pension schemes in OECD countries
Reform Countries
Increase in pension age Finland, Sweden Restrictions on early retirement Germany, Italy, Sweden Reduced pension generosity or increased
service requirement
Austria, France, Germany, Greece, Finland, Portugal
Change in uprating procedure Italy, Sweden Integration of civil-service with general state
scheme
Austria, Greece, Spain
Increase in contribution rates Austria, Finland, Greece, Italy, Netherlands, Portugal, Sweden
Introduction of some form of pre-funding Belgium, Denmark, Finland, Italy, Sweden
Source: authors.
Some ‘parametric reforms’ will almost certainly reduce pension liabilities regardless
of the type of pension scheme. Less generous indexation and reductions in accrual rates are
prime examples. On the other hand, the impact of measures intended to increase the
effective retirement age have more complex effects. If, for example, the relationship
between contributions and benefits implies an unsustainably high rate of return, a higher
retirement age may simply add to the liability as the worker accrues more years of service
towards his or her benefit calculation. Short term finances improve, but the intrinsic
imbalance over the long term still results in an increase in the total liability. Even when the
direct impact is clearly positive (due to the combined impact of having a greater number of
contributions and fewer years of pension), there may be indirect effects in terms of spending
on other programs such as disability, unemployment and social assistance that offset savings
from the overall fiscal perspective.
The ultimate fiscal impact of an increase in the retirement age for civil service
pension schemes is even more difficult to measure. Intuitively, the government can either
pay a wage or a pension to the same individual. Since a pension is normally lower than the
salary, later retirement would lead to higher spending. However, this assumes that there is
no link between retirement and the decision to hire new civil servants. If the retiring
employee was replaced by a new hire, the fiscal effect would be equivalent to the difference
worker’s pension. The equation becomes even more complicated when measured over time
in which case the age-earnings profiles and pension indexation experience would have to be
taken into account and a present value calculated.12
The discussion bears close resemblance to the literature on public sector
downsizing.13 In both cases, the ultimate fiscal impact depends on the government’s hiring
policy and a reasonable assumption about the counterfactual in the absence of any changes.
In the case of downsizing, the changes might involve severance payments or early retirement
options while in a standard parametric reform the typical option considered would be
increasing effective retirement age. Regardless of the chosen route, the ultimate fiscal effect
will depend on government hiring practices. In many cases, if not the majority , downsizing
exercises were eventually undermined by new hiring. We are not aware of similar studies
that look at the aftermath of an increase in the civil service retirement age, although casual
observation would suggest a similar outcome.14
A final consideration is how changes to the contribution rate affect civil service
versus national pension plans. Obviously, when the contribution rate is increased for a
national plan, the direct impact is to improve the finances of the pension scheme. There
may be indirect negative effects due to the distortionary effects of a higher tax on labor, but
in general, the consolidated fiscal deficit will be reduced.
In contrast, an increase in the contribution rate for a civil service pension scheme has
an ambiguous effect, especially with regard to the employer share. It could be argued that an
increase in the employee contribution improves both the finances of the scheme and the
overall fiscal situation. However, for this to be the case, the net wage would have to be
permanently reduced. Most incidence analysis of labor taxes in the private sector finds that
workers bear most of the burden due to the relative elasticities of labor demand and supply.
This framework does not apply to civil service wage structures, however. To the extent that
the net wage of civil servants is the product of negotiation and bears little relation to a
12 Note that this analysis is focused only on fiscal aggregates and says nothing with regard to the productivity of the civil service which may be significantly affected by a change in the age composition. We return to the human resource considerations in the Section 3.1.
market-determined outcome, the increase in the employee contribution to a civil service
pension scheme may not actually result in fiscal savings.
At the same time, an increase in the employer contribution may improve the pension
schemes finances, but it achieves nothing from the overall fiscal perspective. This simply
re-labels the part of the budget used to finance civil service pensions. In a national scheme,
in contrast, the fiscal impact is unambiguously positive (ignoring any general equilibrium
effects).
Table 8 summarizes the comparison of parametric reforms as applied to national
versus civil-servant pension schemes. In the case of retirement age, the wage-bill effect
implies a different sustainability effect when compared to the national scheme. Raising the
retirement age while continuing to hire at the same rate in the civil service will result in a
larger wage-plus-pension bill. It is also important to note that contributions from the
government as employer may make the pension scheme more sustainable, but at the cost of
fiscal sustainability more generally.. In the case of national schemes collecting contributions
from private, formal-sector workers, any increase in contributions will raise revenues and
increase sustainability (albeit at a potential cost in terms of demand and supply for labor as
the tax wedge grows).
Table 8: Parametric reforms to national and civil service pension schemes
Reform National CS
Accrual rate Same effect
Indexation Same effect
Retirement age disability, social assistance etc. can undermine gains
effect on accruals (same as national?), CS pay bill Employee contributions positive (ex. notional accounts,
DC)
positive (but can be undermined by pay changes) Employer contributions positive (ditto) relabelling only
Source: authors.
We conclude this section with the following observations:
• The fiscal burden of civil service pensions is significant and growing;
• The implicit pension debt attributable to civil servants is disproportionately large when compared to their importance in the covered labor force;
• Special considerations must be made when assessing parametric changes to civil service pension schemes, especially with regard to the broad fiscal impact of changing the retirement age; and
• Defined contribution schemes are becoming more popular as a way of introducing some fiscal discipline for civil service pension schemes. India’s reform of 2004 is the most important example at the moment. They also promise advantages in terms of the labor market issues discussed in the next section.
3.2 Labor market impact
Two issues stand out with regard to the interaction between civil-service pensions
and the labor markets. Both are related to the human-resource policy of the public sector:
attracting productive workers to the civil service and retaining them. The first issue is the
relative compensation of civil servants vis à vis their private-sector counterparts. The second is the incentives and disincentives that pensions can generate for moving between public-
Differences in compensation
Pensions are an important part of the compensation package offered to civil
servants. At typical replacement rates and pension eligibility ages, the pension promise is
worth around 30-35 per cent of earnings. The question as to whether this generous pension
promise attracts high-quality staff is an empirical one.
There are numerous studies of differentials in earnings between the public and
private sectors for a range of countries. These use econometric tests to estimate the
difference in wages for individuals with similar characteristics that can be attributed to being
in the public or the private sector.
Unfortunately, these studies have generally not taken account of the differences in
pension values and eligibility conditions.15 Nevertheless, they do shed light on the question
of whether additional benefits, such as a more generous pension scheme, are needed to
address disparities between remuneration in the two sectors. The short answer to this
question is ‘no’.16
In developing countries, public-sector employees with the same human capital and
experience generally earn more than their private sector counterparts.17 This suggests that
any further advantage provided to civil servants through pension or other benefits are not
needed in order to compete with the private sector. In fact, the additional compensation
would only exacerbate unjustified compensation differentials and unnecessarily increase the
cost of government.
The main exception to this finding is reserved for those civil servants with the most
human capital. Several studies have found that highly educated workers tend to earn less
than their private-sector equivalents. While an interesting finding with important public
15 Pensions are only one of a host of other non-wage benefits that often differ between public and private sectors as noted in Schiavo-Campo, de Tommaso and Mukherjee (2003). Nevertheless, it will generally be quantitatively most important.
16 A World Bank study prepared as part of technical assistance to the Government of Pakistan in 2005
did include pensions in a public-private compensation differential analysis. It found that the more generous pension benefits of the civil servants exacerbated positive wage differentials for the vast majority of civil servants. See World Bank (2006).
policy implications, the fact is that only a small share of the civil service falls into this
category, perhaps five to 10 per cent.18
This finding is undoubtedly linked to ‘wage compression’ in the civil service.
Compression was observed during the 1970s and 1980s due to more rapid wage increases
for lower-ranking civil servants. Figure 12 provides a dramatic example of this
phenomenon. Salaries of the lowest grade civil servants grew three times as fast as the
higher echelons between 1970 and the early 1990s. Since then, the ratio has stabilized.
Public-sector pensions — in their current form — are a very ineffective way of
dealing with this problem. While pensions do increase the remuneration of the workers with
the highest human capital, they also increase the compensation of the vast majority. Since
pensions are directly related to wages through the benefit formula, they simply reinforce the
[image:44.612.140.475.384.622.2]compression of wages.
Figure 12: Civil service wage compression, Nepal 1970-2003
0.0 1.0 2.0 3.0 4.0 5.0 6.0 7.0 8.0 9.0
1970 1973 1976 1979 1982 1985 1988 1991 1994 1997 2000 2003
Ratio of salaries of second highest grade officers to lowest ranking civil servants in Nepal
Source: World Bank internal data.
To conclude, the evidence rejects the proposition that more generous pensions are
justified in order for the public sector to compete for human resources. There are wage
differentials favoring the private sector, but mainly among the most educated civil servants.
Even when the case could be made to the contrary, a wage increase, rather than a
distortionary and parallel pension-scheme would seem to be the appropriate tool to address
the disparity.
Mobility
The second possible human-resource issue is the tenure of civil servants.
Governments, once they have attracted the correct staff, will wish to retain them. They
might also want to prevent conflicts of interest involving staff using information and
experience from public service in the private sector.19
The pension system penalizes mobile workers relative to those with full civil-service
careers in two ways. The first is through long vesting periods. People who leave the civil
service before their pension rights are ‘vested’ receive nothing from the system. The
minimum length of service to qualify for a pension benefit is shown for a range of countries
in Table 9. It varies enormously: from one year or less to 25 years.
Table 9: Vesting periods for civil service schemes in selected countries
Length of service required OECD countries Non-OECD countries
Zero/
less than one year
Canada Finland Netherlands Sweden Switzerland United Kingdom
Iran Morocco
Five years Belgium Germany Ireland Italy
10 years Cape Verde
Hong Kong 15 years Austria
France Portugal Spain
Bahrain Mauritius Senegal Tunisia Philippines West Bank/Gaza Yemen
20 years India
25 years Djibouti
Lebanon
Source: authors.
Notes: India pays a partial pension after 10 years’ service. Mauritius pays a lump sum of one year’s salary after 10 years’ service. Senegal pays a partial pension after 15 years and a full pension after 30 years. Hong Kong pays a ‘short service gratuity’ to civil servants leaving with less than 10 years’ service
The second way in which the pension system impedes mobility is through the
treatment of ‘early leavers’. These are people whose pension rights are vested but who leave
the civil service before retirement. Table 10 shows how different countries treat such
workers. In Finland, the Netherlands and Sweden, for example, there is full transferability.
Workers move to private-sector mandatory (or quasi-mandatory) occupational plans with
similar benefits to the civil-service plan. In France, there is full ‘preservation’ of rights.
Workers’ accrued rights are indexed in line with civil service pay between leaving and
retirement. In other cases, moving jobs entails a pension ‘cost’. The following sections aim