A Comparative Analysis of CBO over MVG to
Improve Quality of Software
Dharmendra Lal Gupta
Deptt. of Computer Science & Engg. KNIT Sultanpur, UP, India
Member IEEE
Vikash Chauhan
Deptt. of Computer Science & Engg. KNIT Sultanpur, UP, India
ABSTRACT
This paper describes the relationship between two metrics CBO (Coupling between Objects) and MVG (McCabe's Cyclomatic Complexity). CBO is the object oriented CK metric and MVG is the complexity metric. Here authors have analysed three projects with different complexity level. Authors also have calculated CBO and MVG metrics of these projects and found the correlation between these two metrics. We have found that on increasing CBO, MVG also increases in polynomial form. This correlation study provides an optimal value of CBO up to that value, software will be a quality software.
Keywords
CBO, MVG, Correlation between CBO and MVG.
1.
INTRODUCTION
Delivering high quality and highly reliable software is a mandatory goal for software development companies. Basically quality of software depends on its source code. If source code of any software is written in good way then its quality will increase. Thus in this way the amount of resources needed to support the software will reduce. So today’s focus is on enhancing the software development process [1].
There is an critical need for presenting the of various statistics for evaluating the change-proneness for knowing what is wrong with ones projects in progress so that there is no burn out between the stakeholder working in the life cycle of the application. Since, components of software are like organic compounds that change internally and externally with multiple environmental and business reasons. The major concern is maintenance and further development of the software without conflicts, issues and bugs. Changeability and upgradeability in software is very risky so to reduce this risk and to measure of impact of changes one have to maintain ones source code.
Changeability is the ease with which a source code can be changed. It is evaluated through metrics calculated from the history of changes made. These metrics reflect how well or bad is the change for the project in terms of it degree however, the optimal of these metrics is matter of real concern as they must be chosen in such a manner that they must measure the true image and state of the software components with respect to the basic principles of software stability with openness for further change [2].
The testing stage plays very important role to ensure the quality of the software products in software development life cycle model, but it is the most resource consuming step in
terms of time, effort, and costs. This testing activity represents 50 to 70 percent of the total costs of a project [3]. To reduce these resources one has to maintain our source code and also maintain its metrics.
These resources also depend on complexity of source code. If program is very complex, it will be difficult to understand by the programmer. Complexity plays a very important role to decide the effort, costs, and time of any project or software. Sometimes complex program can be understood easily by the computer or machine but it may be hard to understand by the programmer.
The main goal of this analysis study is to improve the quality of software. Improving the quality of this software implies a reduction in development and maintenance costs, hence a reduction in the costs of the whole company. Higher quality software might also increase customer satisfaction and assurance in the company and its products [4]. To carry out this improvement this study will focus on computing software metrics over the software’s source code and relationship among these metrics. This correlation study of metrics will help ones to measures the strength of relationships between two metrics, to regression analysis, which determines the mathematical expression of the relationship [5].
2.
SYSTEM DESCRIPTION
Data were collected from three projects P0, P1, and P2 developed by us in JAVA programming language which is object oriented programming language and compiled [6] as well as tested on different tools and other details of these projects are given below.
2.1
LOC Details of System
In project P0 authors used 10 classes, 375 Source Lines Of Code (SLOC), 163 lines for comments, 115 blank lines, and this total is 653.
Table 1. Detail description of system
Projects SLOC Comments Blank Lines
Total
LOC Classes
P0 375 163 115 653 10
P1 433 168 118 719 20
P2 494 168 168 830 30
Subtotal 1302 499 401 2202 60
analysed 60 classes and 2202 Lines of Code in their whole system. This analysis report is depicted in Table 1.
2.2
Functional Details of System
2.2.1
Project P0
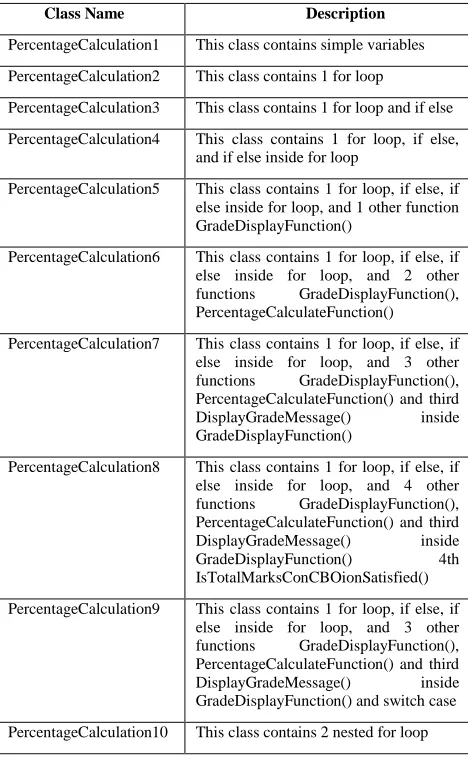
[image:2.595.50.284.177.560.2]This project has 10 classes. There is no inheritance in any class. Every class has different complexity level. The detail description of these classes is given in Table 2.
Table 2. Detail description of project P0
Class Name Description
PercentageCalculation1 This class contains simple variables
PercentageCalculation2 This class contains 1 for loop
PercentageCalculation3 This class contains 1 for loop and if else
PercentageCalculation4 This class contains 1 for loop, if else, and if else inside for loop
PercentageCalculation5 This class contains 1 for loop, if else, if else inside for loop, and 1 other function GradeDisplayFunction()
PercentageCalculation6 This class contains 1 for loop, if else, if else inside for loop, and 2 other functions GradeDisplayFunction(), PercentageCalculateFunction()
PercentageCalculation7 This class contains 1 for loop, if else, if else inside for loop, and 3 other functions GradeDisplayFunction(), PercentageCalculateFunction() and third DisplayGradeMessage() inside GradeDisplayFunction()
PercentageCalculation8 This class contains 1 for loop, if else, if else inside for loop, and 4 other functions GradeDisplayFunction(), PercentageCalculateFunction() and third DisplayGradeMessage() inside GradeDisplayFunction() 4th IsTotalMarksConCBOionSatisfied()
PercentageCalculation9 This class contains 1 for loop, if else, if else inside for loop, and 3 other functions GradeDisplayFunction(), PercentageCalculateFunction() and third DisplayGradeMessage() inside GradeDisplayFunction() and switch case
PercentageCalculation10 This class contains 2 nested for loop
2.2.2
Project P1
[image:2.595.51.551.618.765.2]This project has 10 classes. There is single level inheritance. Every class has different complexity level. The detail description of these classes is given in Table 3.
Table 3. Detail description of project P1
Class Name Description
I1PercentageCalculation1 This program has single level inheritance
I1PercentageCalculation2 This program has single level inheritance and 1 for loop
I1PercentageCalculation3 This program has single level inheritance and 1 for loop and if else
I1PercentageCalculation4 This program has single level inheritance and 1 for loop, if else,
and if else inside for loop
I1PercentageCalculation5 This program has single level inheritance and 1 for loop, if else, if else inside for loop, and 1 other function GradeDisplayFunction() I1PercentageCalculation6 This program has single level
inheritance and 1 for loop, if else, if else inside for loop, and 2 other functions GradeDisplayFunction(), PercentageCalculateFunction() 2 function in parent class
I1PercentageCalculation7 This program has single level inheritance and 1 for loop, if else, if else inside for loop, and 3 other functions GradeDisplayFunction(), PercentageCalculateFunction() and 3rd DisplayGradeMessage() inside GradeDisplayFunction(); 3 function in parent class
I1PercentageCalculation8 This program has single level inheritance and 1 for loop, if else, if else inside for loop, and 4 other functions GradeDisplayFunction(), PercentageCalculateFunction() and 3rd DisplayGradeMessage() inside GradeDisplayFunction(),
IsTotalMarksConCBOionSatisfied; 4 function in parent class
I1PercentageCalculation9 This program has single level inheritance and 1 for loop, if else, if else inside for loop, and 4 other functions
GradeDisplayFunction(),
PercentageCalculateFunction() and 3rd DisplayGradeMessage() inside GradeDisplayFunction(),
IsTotalMarksConCBOionSatisfied; 4 function in parent class and switch cases
I1PercentageCalculation10 This program has single level inheritance and 2 nested for loops
2.2.3
Project P2
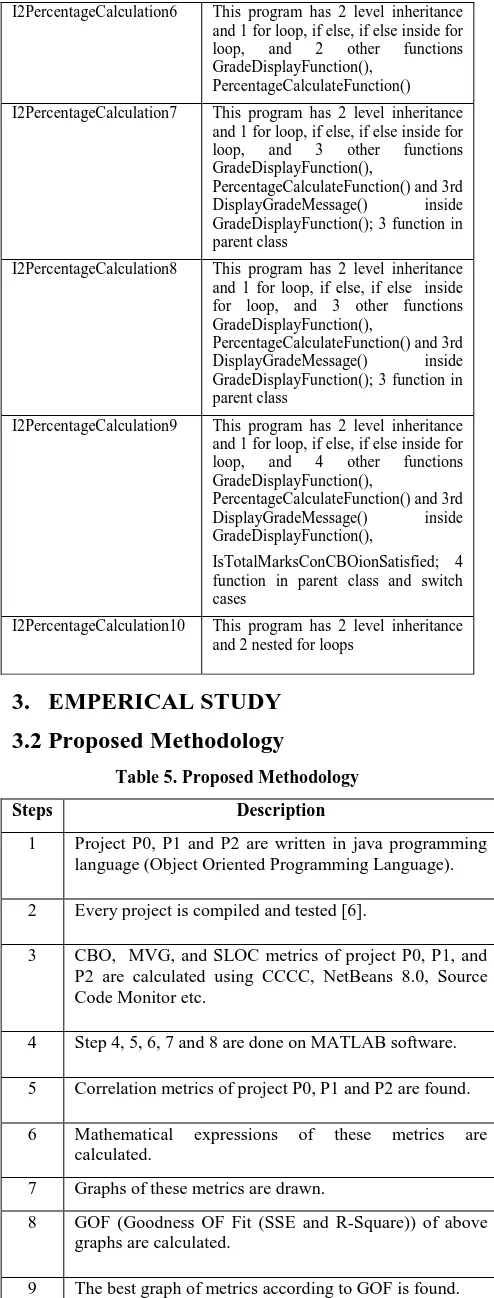
This project has 10 classes. There are two level inheritances. Every class has different complexity level. The detail description of these classes is given in Table 4.
Table 4. Detail description of project P2
Class Name Description
I2PercentageCalculation1 This program has 2 level inheritance
I2PercentageCalculation2 This program has 2 level inheritance and 1 for loop
I2PercentageCalculation3 This program has 2 level inheritance and 1 for loop and if else
I2PercentageCalculation4 This program has 2 level inheritance and if else, and if else inside for loop
I2PercentageCalculation6 This program has 2 level inheritance and 1 for loop, if else, if else inside for loop, and 2 other functions GradeDisplayFunction(),
PercentageCalculateFunction()
I2PercentageCalculation7 This program has 2 level inheritance and 1 for loop, if else, if else inside for loop, and 3 other functions GradeDisplayFunction(),
PercentageCalculateFunction() and 3rd DisplayGradeMessage() inside GradeDisplayFunction(); 3 function in parent class
I2PercentageCalculation8 This program has 2 level inheritance and 1 for loop, if else, if else inside for loop, and 3 other functions GradeDisplayFunction(),
PercentageCalculateFunction() and 3rd DisplayGradeMessage() inside GradeDisplayFunction(); 3 function in parent class
I2PercentageCalculation9 This program has 2 level inheritance and 1 for loop, if else, if else inside for loop, and 4 other functions GradeDisplayFunction(),
PercentageCalculateFunction() and 3rd DisplayGradeMessage() inside GradeDisplayFunction(),
IsTotalMarksConCBOionSatisfied; 4 function in parent class and switch cases
I2PercentageCalculation10 This program has 2 level inheritance and 2 nested for loops
3.
EMPERICAL STUDY
[image:3.595.58.497.68.769.2]3.2
Proposed Methodology
Table 5. Proposed Methodology
Steps Description
1 Project P0, P1 and P2 are written in java programming language (Object Oriented Programming Language).
2 Every project is compiled and tested [6].
3 CBO, MVG, and SLOC metrics of project P0, P1, and P2 are calculated using CCCC, NetBeans 8.0, Source Code Monitor etc.
4 Step 4, 5, 6, 7 and 8 are done on MATLAB software.
5 Correlation metrics of project P0, P1 and P2 are found.
6 Mathematical expressions of these metrics are calculated.
7 Graphs of these metrics are drawn.
8 GOF (Goodness OF Fit (SSE and R-Square)) of above graphs are calculated.
9 The best graph of metrics according to GOF is found.
10 Threshold value of metrics is calculated according to above graphs.
3.3
Calculation of CBO Metric
Authors calculated CBO of these three projects separately using CCCC software [7]. There are following three tables in this subsection which consist of CBO values of each project.
[image:3.595.48.295.71.720.2]3.3.1
Average CBO analysis of project P0
Table 6. CBO of project P0
Module Name CBO
PercentageCalculation1 1
PercentageCalculation10 1
PercentageCalculation2 1
PercentageCalculation3 1
PercentageCalculation4 1
PercentageCalculation5 1
PercentageCalculation6 1
PercentageCalculation7 1
PercentageCalculation8 1
PercentageCalculation9 1
AVERAGE 1
3.3.2
Average CBO analysis of project P1
Table 7. CBO of project P1
Module Name CBO
ChildI1PercentageCalculation1 2
ChildI1PercentageCalculation10 2
ChildI1PercentageCalculation2 2
ChildI1PercentageCalculation3 2
ChildI1PercentageCalculation4 2
ChildI1PercentageCalculation5 2
ChildI1PercentageCalculation6 2
ChildI1PercentageCalculation7 2
ChildI1PercentageCalculation8 2
ChildI1PercentageCalculation9 2
I1PercentageCalculation1 1
I1PercentageCalculation10 1
I1PercentageCalculation2 1
I1PercentageCalculation3 1
I1PercentageCalculation4 1
I1PercentageCalculation5 1
I1PercentageCalculation6 1
I1PercentageCalculation7 2
I1PercentageCalculation8 2
I1PercentageCalculation9 2
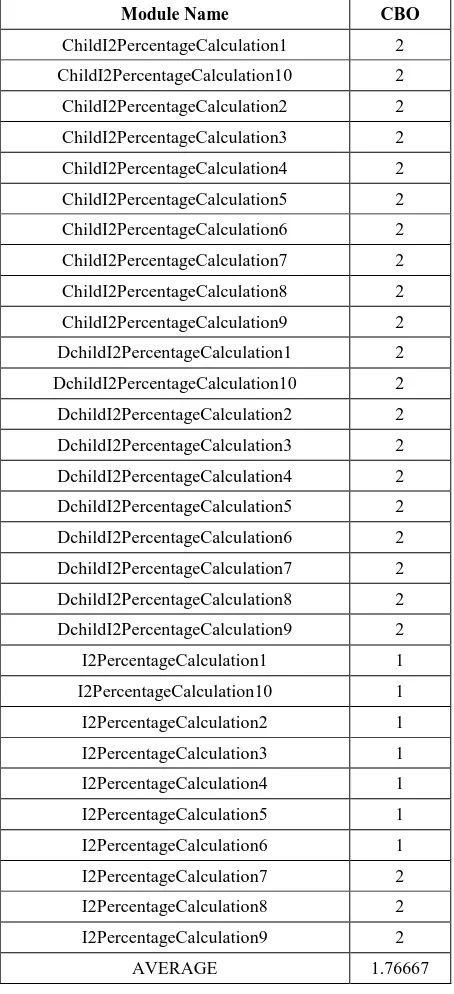
[image:3.595.318.537.129.732.2]3.3.3
Average CBO analysis of project P2
Table 8. CBO of project P2
Module Name CBO
ChildI2PercentageCalculation1 2
ChildI2PercentageCalculation10 2
ChildI2PercentageCalculation2 2
ChildI2PercentageCalculation3 2
ChildI2PercentageCalculation4 2
ChildI2PercentageCalculation5 2
ChildI2PercentageCalculation6 2
ChildI2PercentageCalculation7 2
ChildI2PercentageCalculation8 2
ChildI2PercentageCalculation9 2
DchildI2PercentageCalculation1 2
DchildI2PercentageCalculation10 2
DchildI2PercentageCalculation2 2
DchildI2PercentageCalculation3 2
DchildI2PercentageCalculation4 2
DchildI2PercentageCalculation5 2
DchildI2PercentageCalculation6 2
DchildI2PercentageCalculation7 2
DchildI2PercentageCalculation8 2
DchildI2PercentageCalculation9 2
I2PercentageCalculation1 1
I2PercentageCalculation10 1
I2PercentageCalculation2 1
I2PercentageCalculation3 1
I2PercentageCalculation4 1
I2PercentageCalculation5 1
I2PercentageCalculation6 1
I2PercentageCalculation7 2
I2PercentageCalculation8 2
I2PercentageCalculation9 2
AVERAGE 1.76667
3.4
Calculation of MVG Metric
[image:4.595.54.281.108.605.2]Authors calculated MVG [8] of these three projects using NetBeans 8.0 IDE [6] software. Here MVG is the cyclomatic complexity of project P0, P1, and P2. Table 9 depicts the MVG of each project separately.
Table 9. MVG of project P0, P1, and P2
Projects MVG
P0 75
P1 86
P2 101
4.
CORRELATION ANALYSIS
4.1
Correlation between MVG and CBO
Table 10. MVG of project P0, P1, and P2
Projects Avg CBO MVG MVG
Increased %
P0 1 75
P1 1.65 86 14.66
P2 1.766667 101 34.6667
4.2
Graphs between MVG and CBO
Authors found the graphs between MVG and CBO using the above given data in Table 10. There may be different graphs like polynomial, exponential, power, and sin etc. These graphs are given below one by one which has been drawn on MATLAB (Matrix Laboratory) [9].
[image:4.595.319.559.267.657.2]i. Exponential 1 (Number of terms= 1)
Fig 1: Exponential graph between MVG and CBO
ii. Gaussian 1 (Number of terms= 1)
Fig 2: Gaussian 1 graph between MVG and CBO
[image:4.595.315.560.281.451.2]iii. Polynomial 1 (Degree 1)
Fig 3: Polynomial 1 graph between MVG and CBO
[image:4.595.317.561.654.757.2] [image:4.595.85.248.689.762.2]Fig 4: Polynomial 2 graph between MVG and CBO
v. Power 1 (Number of terms= 1)
Fig 5: Power 1 graph between MVG and CBO
vi. Power 2 (Number of terms= 2)
Fig 6: Power 2 graph between MVG and CBO
vii. Rational 0 1 (Numerator degree= 0 Denominator degree=1)
Fig 7: Rational 0 1 graph between MVG and CBO
viii. Rational 0 2 (Numerator degree= 0 Denominator degree=2)
Fig 8: Rational 0 2 graph between MVG and CBO
ix. Rational 1 1 (Numerator degree= 1 Denominator degree=1)
Fig 9: Rational 1 1 graph between MVG and CBO
x. Sin 1 (Number of terms= 1)
Fig 10: Sin 1 graph between MVG and CBO
xi. Weibull
Fig 11: Weibull graph between MVG and CBO
xii. Custom Equation
Fig 12: Custom Equation graph MVG and CBO
xiii. Mix Graphs
Fig 13: Mix graphs between MVG and CBO
4.3
Correlation between MVG and CBO
4.3.1
Analysis of graphs
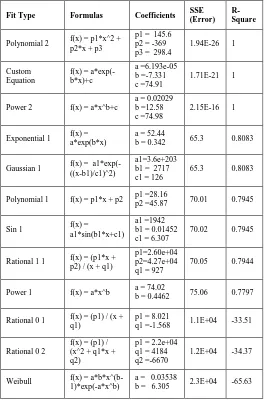
Here authors have calculated mathematical formulas between MVG and CBO. In Table 11 f(x) represents the MVG and x represents the CBO of the system [10]. Here Table 11 represents the statistical result of graphs which are sorted in lower error (SSE) to higher error.
Table 11. Statistical Result of MVG and CBO metrics
Fit Type Formulas Coefficients SSE (Error)
R-Square
Polynomial 2 f(x) = p1*x^2 + p2*x + p3
p1 = 145.6 p2 = -369 p3 = 298.4
1.94E-26 1
Custom Equation
f(x) = a*exp(-b*x)+c
a =6.193e-05 b =-7.331 c =74.91
1.71E-21 1
Power 2 f(x) = a*x^b+c
a = 0.02029 b =12.58 c =74.98
2.15E-16 1
Exponential 1 f(x) = a*exp(b*x)
a = 52.44
b = 0.342 65.3 0.8083
Gaussian 1 f(x) = a1*exp(-((x-b1)/c1)^2)
a1=3.6e+203 b1 = 2717 c1 = 126
65.3 0.8083
Polynomial 1 f(x) = p1*x + p2 p1 =28.16
p2 =45.87 70.01 0.7945
Sin 1 f(x) = a1*sin(b1*x+c1)
a1 =1942 b1 = 0.01452 c1 = 6.307
70.02 0.7945
Rational 1 1 f(x) = (p1*x + p2) / (x + q1)
p1=2.60e+04 p2=4.27e+04 q1 = 927
70.05 0.7944
Power 1 f(x) = a*x^b a = 74.02
b = 0.4462 75.06 0.7797
Rational 0 1 f(x) = (p1) / (x + q1)
p1 = 8.021
q1 =-1.568 1.1E+04 -33.51
Rational 0 2
f(x) = (p1) / (x^2 + q1*x + q2)
p1 = 2.2e+04 q1 = 4184 q2 =-6670
1.2E+04 -34.37
Weibull f(x) = a*b*x^(b-1)*exp(-a*x^b)
a = 0.03538
b = 6.305 2.3E+04 -65.63
5.
OBSERVATIONS
Here authors discussed about the regression analysis of CBO metric with respect to MVG (complexity). It is measured that when one increase CBO, MVG also increases in polynomial form. This paper provides an optimal value of CBO at which one can have quality software after that value of complexity will increases exponentially.
6.
CONCLUSION AND FUTURE SCOPE
This regression analysis provides us a monitoring alarm that provides a limit of CBO at which complexity will increase exponentially. Authors also described graph and mathematical expression between MVG and CBO.
One can do the following work in future.
1. There are many metrics available one can make different combinations and after making the combinations they can find the correlation among those metrics.
2. One can make a system which tells them the relationship among those metrics.
3. One can take our project as reference for various predictions of quality software.
7.
REFERENCES
[1] S. Dick and A. Kandel. “Fuzzy clustering of software metrics”. In Fuzzy Systems, 2003. FUZZ ’03. The 12th IEEE International Conference on, volume 1, pages 642 – 647 vol.1, May 2003.
[2] A. Urvashi, and A. Chhabra. “Change-Proneness of Software Components”. IOSR Journal of Computer Engineering (IOSR-JCE) Volume 16, Issue 2, Ver. VIII PP 45-48 (Mar-Apr. 2014).
[3] H. Jie Lee, L. Naish, and K. Ramamohanarao. “Study of the relationship of bug consistency with respect to performance of spectra metrics”. In 2nd IEEE International Conference on Computer Science and Information Technology, 2009. ICCSIT 2009., pages 501 –508, Aug. 2009.
[4] C. Jin, Shu-Wei Jin, Jun-Min Ye, and Qing-Guo Zhang. “Quality prediction model of object-oriented software system using computational intelligence”. In Power Electronics and Intelligent Transportation System (PEITS), 2009 2nd International Conference on, volume 2, pages 120 –123, Dec. 2009.
[5] C. Zhang; Budgen, D., “What Do We Know about the Effectiveness of Software Design Patterns?” Software Engineering, IEEE Transactions on, vol.38, no.5, pp.1213, 1231, Sept.-Oct. 2012.
[6] NetBeans IDE 8.0, Available at:
“https://netbeans.org/downloads/start.html?platform=win dows&lang=en&option=javaee”.
[7] C and C++ Code Counter, Available at: “http://sourceforge.net/projects/cccc/”.
[8] T.McCabe, “A complexity measure”, IEEE Transactions on Software Engineering, Vol. 2, pp. 308-320, Dec 1976.
[9] MathWorks Products, Available at:
“http://www.mathworks.in/downloads/web_downloads”. [10]Harrison, R. Counsell, S. Nithi, R. “Coupling metrics