http://dx.doi.org/10.4236/ojce.2015.53030
Use of Waste Plastic in Flexible
Pavements-Green Roads
Yash Menaria
1, Rupal Sankhla
21Poornima Institute of Engineering and Technology, Jaipur, India 2Centre for Environmental Planning & Technology, Ahmedabad, India
Email: yash07menaria@gmail.com, rupal.sankhla71@gmail.com
Received 24 June 2015; accepted 6 September 2015; published 9 September 2015
Copyright © 2015 by authors and Scientific Research Publishing Inc.
This work is licensed under the Creative Commons Attribution International License (CC BY). http://creativecommons.org/licenses/by/4.0/
Abstract
Wrappers of betel nuts, chocolates, chips, hand bags, cold drink bottles and all other forms of plas-tic create significant environmental and economic problem. They consume massive energy and other natural resources, depleting the environment in various ways. In manufacturing firms, con-struction industries and products delivery services, use of plastic is a priority to handle and pack things comfortably due to its light weight, cost effectiveness and strength. Plastics cannot be banned as it will result in usage of natural resources like paper, wood at a great extent. It is made up of various chemical elements and is regarded as a highly pestilent material which does not eas-ily degrade in the natural environment after its usage. Waste plastics are made up of Polyethylene, Polystyrene and Polypropylene. Temperature varying between 120˚C - 160˚C gives the softening point of these plastics [5]. They do not produce any toxic gases during heating but the softened plastics have tendency to form a lamination or coating over the aggregate, when it is sprayed over the hot aggregate at 160˚C. The main objective of this paper is to discuss the significance of plastic in terms of cost reduction, increase in strength and durability when these plastics are heated and coated upon the aggregates (160˚C) to compensate the air voids with plastic and binds with ag-gregate to provide stability.
Keywords
Municipal Plastic Waste, Aggregates, Shredded Plastic, Stripping, Marshel Stability, Optimum Bitumen Content, Flexible Pavement
1. Introduction
due to which these materials pose environmental pollution and problems like breast cancer, reproductive prob-lems in humans and animals and genital abnormalities [2].
If a ban is put on the use of plastics on emotional grounds, the real cost would be much higher, the inconve-nience much more, the chances of damage or contamination much greater… Hence the question is not “plastics vs no plastics” but it is more concerned with the judicious use and re-use of plastic-waste.
Both the issues when taken together lead to a single solution that we can use this waste plastic in Flexible Pavements in such a manner that it gets coated over the surface of aggregate by heating (140˚C - 160˚C) because plastics like PE, PS, PP used in PET Bottles, disposal glasses, handbags, covers of various appliances etc. soften up to 160˚C. The experiments conducted in the laboratory depict fruitful results can substantially increase the stability and durability of roads plus, making it a very effective step towards eco-friendliness compared to con-ventional and traditional techniques of flexible pavements construction.
1.1. Literature Review
Since many years the utilization of plastic in flexible pavements has been done to increase the stability, durabil-ity of roads and reduce the cost of construction of roads by replacing some percentage of bitumen with that of the waste plastic. The LDPE can only be used in this technique as it gets softened at the desired temperature i.e., 160˚C and coated over the aggregates. There is no modification in the plant is required because plastic is mixed at the same time when aggregates are poured into Hot Mix Plant for 30 - 50 secs, hence no fuel consumption takes place. There is a consistent research still going on to attain the optimality and many have stated to use the plastic in road construction [8].
Prof. C.E.G Justo states that addition of 8% percent by weight of processed plastic is desirable in saving 0.4% bitumen by weight of mix [4].
Dr. R. Vasudevan has also stated that use of waste plastic in bitumen increase the binding property as com-pared to the conventional bitumen [3]. It improves the properties of bitumen resulting in increase in Softening Point and decrease in Penetration value thus improving the durability [6].
1.2. Objectives of the Study
Basic intention is to efficiently utilize the waste plastic in constructive way so that it can be beneficial to society. Main objectives of current project work are:
1) To identify the optimum proportion of waste plastic to be added in the bitumen mix for getting the required strength.
2) To compare the experimented results with the conventional pavement details and perform the economic analysis.
3) To prepare statistical model for optimum utilisation of plastic waste.
1.3. Experimental Programme
1.3.1. Materials and Its Physical Properties
Bitumen-VG-30 penetration grade bitumen was used for the present study. Table 1 shows the test results and permissible limits of the tests carried out to check the physical properties of bitumen.
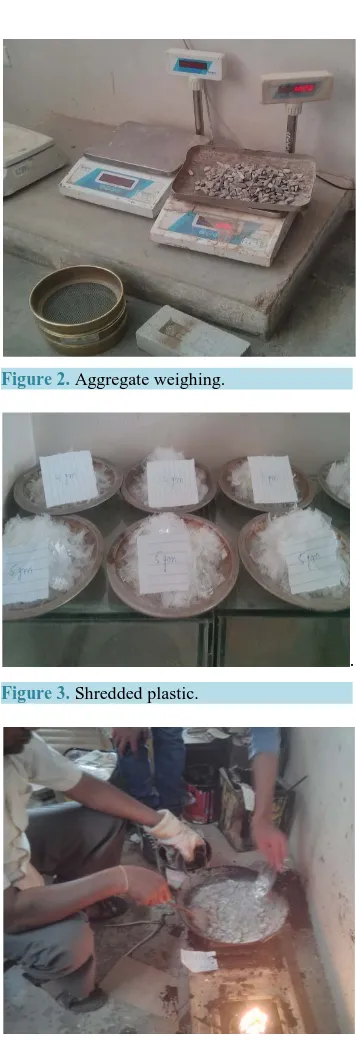
Aggregates: 20 mm, 10 mm, 6 mm and stone dust were used for the present study whose sieve analysis is shown in Table 2.
Table 3 shows the test results and permissible limits of the tests carried out to check the physical properties of aggregates.
Aggregate Gradation DBM-II (50 - 75 Mm Thickness): Grading of the aggregates is done in the DBM layer as shown in Figure 1.
1.3.2. Process [7]
DRY PROCESS (Lab test-D.B.M II Grade)
1) Plastic wastes are cleaned and dried (For ex: disposed carry bags, glasses etc) with a thickness of 60 mi-crons is shredded into small pieces (2.36 mm - 4.75 mm size).
Table 1. Physical properties of bitumen as IS 73:1992 [1].
DESIGNATION TEST RESULT PERMISSIBLE LIMIT TEST METHOD
Specific gravity of bitumen 1.025 0.99 min IS: 1202 - 1978
Softening point of bitumen 54.35˚C 47 ˚C (min) IS: 1205 - 1978
Flash point of bitumen 272˚C 220 ˚C (min) IS: 1209 - 1978
Fire Point of Bitumen 300˚C 270 ˚C (min) IS: 1209 - 1978
Bitumen Penetration Test 50 mm 45 (min) IS: 1203 - 1978
Ductility test 94 cm 100 IS: 1208 - 1978
Table 2. Sieve analysis.
SIEVE SIZE UPPER LIMITS LOWER LIMITS MID LIMITS RESULTS
37.5 100 100 100 100.00
26.5 100 90 95 100.00
19 95 71 83 93.89
13.2 80 56 68 71.29
4.75 54 38 46 42.69
2.36 42 28 35 29.41
0.3 21 7 14 10.53
0.075 8 2 5 4.18
Table 3. Aggregate test results.
DESIGNATION TEST RESULT (MORTH SPECIFICATION) PERMISSIBLE LIMIT TEST METHOD
Aggregate Impact Value Test 23.80 Max 30% IS: 2386 Part IV
Specific Gravity of Aggregates (20 mm) 2.68 - IS: 2386 Part III
Specific Gravity of Aggregates (10 mm) 2.71 IS: 2386 Part III
Specific Gravity of Aggregates (6 mm) 2.69 IS: 2386 Part III
Specific Gravity of Aggregates (stone dust) 2.74 IS: 2386 Part III
Stripping Value of Aggregates 45% 5% Physical appearance
Water Absorption 0.40 Max 2% IS: 2386 Part III
Figure 1. Aggregate gradation. 0 10 20 30 40 50 60 70 80 90 100
0.01 0.1 1 10
%
P
assi
ng
Sieve Size in mm DBM
Upper Limit Lower Limit
3) Shredded plastic as shown in Figure 3 is added to the hot mix. The plastic gets softened and coated over the surface of the aggregate in 30 - 60 seconds as shown in Figure 4.
4) Hot Bitumen (heated up to a maximum of 160˚C) is added immediately and the contents are mixed thor-oughly.
5) As the plastics are heated to a maximum temperature of 165˚C, there is no evolution of any gas as shown in the above Table 4. When heated above 270˚C, the plastics get decomposed and above 750˚C they get burnt and produce harmful noxious gases.
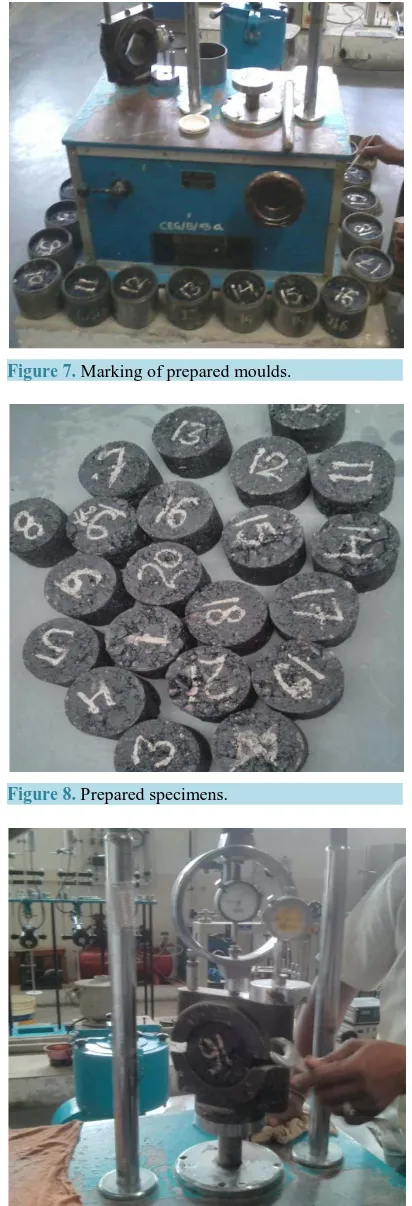
[image:4.595.224.402.185.705.2]6) The moulds are preheated as shown in Figure 5 and then the mix is poured in the preheated moulds as shown in Figure 6.
Figure 2. Aggregate weighing.
.
Figure 3. Shredded plastic.
Figure 5. Pre heating of moulds.
Figure 6. Mould filling.
Table 4. Characteristics of waste plastic [9].
Polymer Softening Temp. (˚C) Products Reported Decomposition Temp. (˚C) Examples
Polyethylene (PE) 100 - 120 No gas 270 - 350 Bags, sacks, detergent bottles etc.
Polypropylene (PP) 140 - 160 No gas 270 - 300 Film wrapping of biscuits, chips
Polystyrene (PS) 110 - 140 No gas 300 - 350 Disposable glasses
7) The moulds are marked as shown in Figure 7 and kept for 24 hours in air and weighed.
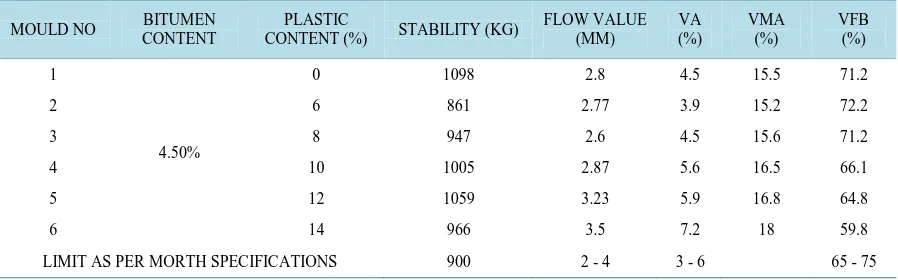
8) Then the prepared moulds as shown in Figure 8 are poured in water and weight of SSD (saturated surface dry sample) is taken.
9) Then after SSD weight, samples are kept in 60˚C hot water bath and then tested for Marshall Stability and Flow value just after taking out from water bath as shown in Figure 9.
The results and analysis mentioned below are attained by considering D.B.M Grade IIratio of aggregates and VG-30 grade Bitumen whose minimum value of bitumen that should be taken according to I.S code is 4.25%.
Firstly, conventional moulds are tested at 4.25%, 4.5%, 4.75% and the optimum solution is obtained at 4.5% as shown in Table 5.
Thus taking optimum reading into consideration and varying % of Plastic in Bitumen (4.50%) at 0%, 8%, 10%, 12%, 14%, the results are as follows:
[image:5.595.217.412.82.445.2]Figure 7. Marking of prepared moulds.
Figure 8. Prepared specimens.
Table 5. Characteristic values at different bitumen contents.
Mould no Bitumen content Stability (kg) Average stability (kg) Flow value (mm) Avg. Flow value (mm)
1 4.25% 822 822 2.8 2.93
2 931.6 3
3 712.4 3
4 4.50% 822 949.87 4 3.26
5 1013.8 2.4
6 1013.8 3.1
7 4.75% 685 785.67 3.2 3.17
8 808.3 3.4
9 863.1 3.2
Table 6. Characteristic values of the specimens at 4.5% bitumen content.
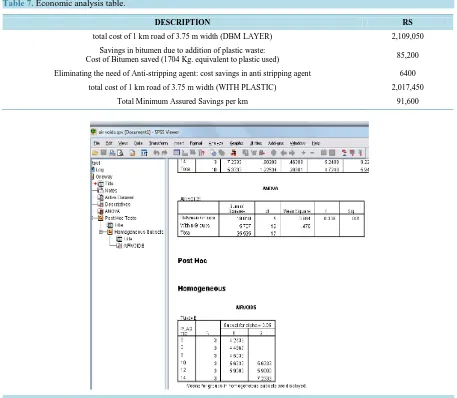
MOULD NO CONTENT BITUMEN CONTENT (%) PLASTIC STABILITY (KG) FLOW VALUE (MM) (%) VA VMA (%) VFB (%)
1
4.50%
0 1098 2.8 4.5 15.5 71.2
2 6 861 2.77 3.9 15.2 72.2
3 8 947 2.6 4.5 15.6 71.2
4 10 1005 2.87 5.6 16.5 66.1
5 12 1059 3.23 5.9 16.8 64.8
6 14 966 3.5 7.2 18 59.8
LIMIT AS PER MORTH SPECIFICATIONS 900 2 - 4 3 - 6 65 - 75
1.4. Data Collection
Characteristics Curves Based on Experiments Conducted in Lab for D.B.M II Grade (4.5% Net Content of Bitumen and Plastic)
1) Figure 10 shows the plot between % plastic in bitumen and Stability (KN).
2) Figure 11 shows the bar graph between % Air Voids (Va) and % of plastic in bitumen. 3) Figure 12 shows the bar graph between Bulk Density (gm/cc) and % Plastic in bitumen. 4) Figure 13 shows the plot between Flow value (mm) and % of Bitumen Content.
5) Figure 14 shows the plot between % Voids filled with Bitumen (VFB) and % plastic content.
1.5. Analysis
1.5.1. Economic Analysis per Km of Flexible Pavement (Dbm)
A huge quantity of plastic waste has been used as modifying agents. However, the high cost of these polymers compared to bitumen means that the amount of polymer needed to improve pavement performance should be as small as possible. This major restriction could be avoided by using waste materials like plastics. From an envi-ronmental and economic standpoint, the use of waste plastic as a bitumen-modifying agent may contribute to solving a waste disposal problem and to improving the quality of road pavements.Table 7 shows the economic analysis of pavement and the total savings due to use of plastic waste.
1.5.2. SPSS Analysis
[image:7.595.89.538.297.437.2]Figure 10. % Plastic in bitumen and stability (KN).
Figure 11. % Air Voids (Va) and % of plastic.
Figure 12. Bulk density (gm/cc) and % plastic in bitumen.
900 900 900 900 900 900
189 0 47 105 159 66
0 500 1000 1500
0 6 8 10 12 14
sta b il ity (% )
% plastic content
STABILITY V/S PLASTIC CONTENT
0 1 2 3 4 5 6 7 8
0 8 10 12 14
%
A
IR
VOI
DS
% PLASTIC CONTENT
Air void V/S plastic content
%Air void 2.24 2.26 2.28 2.3 2.32 2.34 2.36
0 8 10 12 14
Bu lk D en sit y, G b
% of plastic in bitumen
%of plastic in bitumen v/sBulk density, Gb
[image:8.595.145.484.483.702.2]Figure 13. Flow value (mm) and % of bitumen content.
[image:9.595.161.471.301.431.2]Figure 14. % Voids filled with bitumen (VFB) and % plastic content.
Figure 15. Analysis sheet. 2.8
2.5 2.77
2.87 3.23 3.5
0 0.5 1 1.5 2 2.5 3 3.5 4
0 6 8 10 12 14
FLOW
VA
LU
E
(m
m
)
% PLASTIC CONTENT
FLOW VALUE v/s PLASTIC CONTENT
FLOW VALUE
71.2 72.2 71.2 66.1 64.8
59.8
0 20 40 60 80
0 6 8 10 12 14
VFB
% PLASTIC
VFB v/s plastic content
[image:9.595.174.461.454.708.2]a) Figure 16 shows the SPSS window carrying out one way annova test, keeping plastic content as independent factor and air voids in dependent list.
b) Figure 17 shows the SPSS window carrying out one way annova test, keeping plastic content as factor and stability in dependent list.
c) Figure 18 shows the SPSS window carrying out one way annova test, keeping plastic content as factor and flow in dependent list.
d) Figure 19 shows the SPSS window carrying out one way annova test, keeping plastic content as factor and VFB in dependent list.
e) Figure 20 shows the SPSS window carrying out one way annova test, keeping plastic content as factor and VMA in dependent list.
2. Results and Discussion
1) Utilisation of waste plastic improves the binding property of mix.
2) The optimum result of waste plastic came out to be 8% from the experiments conducted.
3) The properties of bitumen such as penetration, softening point improved with the addition of the waste fibre. 4) Plastic roads can also be constructed in the areas having high temperatures (50˚C).
5) Waste plastic in roads increases the stability value and durability to a great extent.
Table 7. Economic analysis table.
DESCRIPTION RS
total cost of 1 km road of 3.75 m width (DBM LAYER) 2,109,050
Savings in bitumen due to addition of plastic waste:
Cost of Bitumen saved (1704 Kg. equivalent to plastic used) 85,200
Eliminating the need of Anti-stripping agent: cost savings in anti stripping agent 6400
total cost of 1 km road of 3.75 m width (WITH PLASTIC) 2,017,450
[image:10.595.84.541.313.711.2]Total Minimum Assured Savings per km 91,600
Figure 17. SPSS analysis.
Figure 19. SPSS analysis.
6) This technique is very eco-friendly as it uses the waste plastic which is being disposed in oceans, landfills etc.
7) Replacement of bitumen with plastic reduces the cost of construction significantly.
8) When durability and stability of roads will improve, then its future maintenance cost will be saved too.
References
[1] Guidelines for the Use of Plastic Waste in Rural Roads Construction by Dr. V. Vasudevan, TEC, Madurai, and CRRI, New Delhi. National Rural Roads Development, Agency Ministry of Rural Development.
[2] Verma, S.S. (2008) Roads from Plastic Waste. The Indian Concrete Journal, November, 43-44.
[3] Rajasekaran, S., Vasudevan, R. and Paulraj, S. (2013) Reuse of Waste Plastics Coated Aggregates-Bitumen Mix Composite for Road Application—Green Method. American Journal of Engineering and Research, 2, 1-13.
[4] Justo, C.E.G. and Veeraragavan, A. (2002) Utilization of Waste Plastic Bags in Bituminous Mix for Improved Per-formance of Roads. Banglore University, Bengaluru.
[5] Swami, V., et al. (2012) Use of Waste Plastic in Construction of Bituminous Roads. International Journal of Engi-neering Science and Technology (IJEST), 4, 2351-2355.
[6] Punith, V.S (2010) Study of the Effect of Plastic Modifier on Bituminous Mix Properties.
[7] Bale, A.S. (2011) Potential Reuse of Plastic Waste in Road Construction: A Review. International Journal of Advances in Engineering & Technology (IJAET), 2, 233-236.
[8] Vasudevan, R., Nigam, S.K., Velkennedy, R., Ramalinga, A., Sekar, C. and Sundarakannan, B. (2007) Utilization of Waste Polymers for Flexible Pavement and Easy Disposal of Waste Polymers. Proceedings of the International Con-ference on Sustainable Solid Waste Management, Chennai, 5-7 September 2007, 105-111.
![Table 1. Physical properties of bitumen as IS 73:1992 [1].](https://thumb-us.123doks.com/thumbv2/123dok_us/8072770.780073/3.595.85.541.93.547/table-physical-properties-bitumen.webp)
![Table 4. Characteristics of waste plastic [9].](https://thumb-us.123doks.com/thumbv2/123dok_us/8072770.780073/5.595.165.534.78.548/table-characteristics-waste-plastic.webp)