http://dx.doi.org/10.4236/ojce.2014.42013
How to cite this paper: Park, S. and Trieu, V. (2014) Transit Bus and Pedestrian Safety Analysis in the Context of Operator Improvements and Traffic Volume Assessment. Open Journal of Civil Engineering, 4, 147-158.
http://dx.doi.org/10.4236/ojce.2014.42013
Transit Bus and Pedestrian Safety Analysis
in the Context of Operator Improvements
and Traffic Volume Assessment
Seri Park
*, Vanvi Trieu
Department of Civil and Environmental Engineering, Villanova University, Villanova, USA Email: *Seri.Park@villanova.edu
Received 11 April 2014; revised 11 May 2014; accepted 18 May 2014
Copyright © 2014 by authors and Scientific Research Publishing Inc.
This work is licensed under the Creative Commons Attribution International License (CC BY).
http://creativecommons.org/licenses/by/4.0/
Abstract
Pedestrian safety related to public bus transit is an integral part of promoting sustainability espe-cially in the urban setting. This concept has received significant attention within the last decade as transit agencies strive to make their systems more sustainable and safer at the same time. This study examined pedestrian collisions related to public transit buses in Philadelphia over a three-year study period from 2008 to 2011. The objective is to perform a detailed analysis on crash records, which provides the foundation on statistics for bus-pedestrian collision to allow for future studies in modeling work in this field. Results of this research provided insights on bus- pedestrian collisions in terms of bus maneuver, cause of crash, impact point of bus, and relation to hourly traffic volume. A strong correlation was found between traffic volume and bus-pedestrian collision rate in terms of hours of the day. For any given hour, an increase in collision frequency was found if the traffic volume exceeds a threshold of 5% of its average annual daily traffic. This serves as an indicator of locations that pedestrians are vulnerable at. Analyses were conducted to the fullest extent allowable by the limited dataset. This study presents findings that can be future developed and investigated in future studies. Additionally, countermeasures are recommended in each section that presents a critical area to address.
Keywords
Pedestrian Safety, Intersection Safety, Public Transit Bus, Countermeasures, Hourly Traffic Volume
1. Introduction and Background
Within the last decade, society has become increasingly aware and conscious of the sustainability. Even though
the nation is still heavily dependent and focused on private vehicles, sustainability efforts and initiatives have had an effect on alternative transportation modal choice [1]. These choices include public transit, bicycle use, and walking as societal development becomes more people-centered. Transit agencies are also promoting the use of public transit that benefits the environment and city in many ways like reducing congestion, air pollution, and energy consumption. To comply with these changes, metropolitan planning organizations and various agen-cies are recommended to make adjustments and changes to create more walkable zones, improve pedestrian safety, and promote the use of public transit. The nation’s Moving Ahead for Progress of the 21st Century [2] surface transportation bill enacted in 2012 places a great emphasis on sustainability. To achieve this, it is critical that the safety of public transit systems is maintained and that their impact on the environment and other modal users is minimized.
Pedestrian travel has always been a major component of traffic flow and can be expected to increase in the future. In 2010, there were 4280 pedestrian fatalities and 70,000 injuries as a result of vehicle-related crashes in the United States [3]. Any type of crash can result in reduction in quality of life, emotional impact, temporary or permanent disability, pain, and economic loss. Greater importance of pedestrian safety must be considered for urban areas that accounted for 73% of pedestrian fatalities in 2010 [3]. Safety issues that relate transit to pede-strian have not received significant attention in research and planning. For instance, pedepede-strian movement analy-sis often neglects travel between transit hubs and major trip generators and attractors, which can significantly increase the crash statistics [4]. One reason for the exclusion may be the low number of crashes directly involv-ing public transit in comparison to other crash types. Despite this fact, the presence alone of public transit was found to increase the risk of crashes for other road users [5]. This is especially true` in densely populated areas with large transit systems to maintain efficient traffic flow on a daily basis.
2. Research Objectives
The city of Philadelphia is a metropolitan area that exhibits many of the qualities aforementioned. The Sou-theastern Pennsylvania Transportation Authority (SEPTA) is the city’s primary public transit provider and is in-terested in reducing pedestrian risk associated with their transit buses. Transit crashes are often costly for agen-cies due to liability claims, property damage, and replacement of service, personnel, and equipment [6]. An en-gineering study was conducted to identify crash pattern and statistics related to transit safety for pedestrians. This includes greater insight on the causes and types of bus-pedestrian collisions, its relation to traffic volume, and plausible countermeasures to address these collisions. This study essentially provides preliminary and foun-dational results in this field for greater future studies such as model development. The analyses of this research fully exhausted the details of the dataset provided by SEPTA and data gathered from other sources such as traf-fic volume.
3. Literature Review
Due to the limited resources directly relating pedestrian to transit safety, the literature review primary focuses on pedestrian safety at intersection and midblock crossings from all types of collisions. The scope of the literature review is divided into four sections: pedestrian behavior and roadway characteristics, transit characteristics, modeling and exposure, and countermeasures. Studies that pertain to countermeasures for transit safety im-provement were also examined.
3.1. Pedestrian Behavior and Roadway Characteristics
observe for on-coming traffic, wait for traffic to stop, and/or cross slowly [10]. Balk et al.[11] examined human factors and developed a model to predict where pedestrians are more likely to cross road. Since bus stops and transit hubs are major trip generators, additional attention in modeling traffic flow at these locations is essential for safe pedestrian travel. For instance, bus stops located at the middle of a block versus intersection can have a significant impact on pedestrian flow. The study concluded that countermeasures can more easily be imple-mented in areas with a target demographic such as children at a school or older adults at a retirement communi-ty.
An investigation on pedestrian crossing decision revealed that the speed of vehicles, pedestrian density, and traffic density were the top variables in impacting the decision [12]. Other contributing factors to pedestrians crossing against red are long cycle lengths [5] [8] and the influence of other pedestrians, especially on crowded sidewalks [13]. In terms of traffic characteristics, low volume roads experience high midblock crossing as op-posed to high volume roads where crossing occur more frequently at intersections [7]. Often times, the physical appearance, quality, and geometry of a sidewalk affect a pedestrian’s development of “balance of power” [14]. Through this thought process, pedestrians determine how likely it is for a driver to yield or slow down.
3.2. Transit Related Characteristics
In retrospect, bus operators experience greater mental workload from cognitive, perceptual, and physical tasks than passenger vehicle drivers do, especially when merging back into traffic and making left-turns [15]. The workload includes being aware of on-coming vehicle traffic from different directions, watching for crossing pe-destrians, and various driving-related functions. Bus operators also have the additional workload of controlling a significantly larger vehicle and tending to passenger needs such as collecting fares. From a design perspective, transit crashes were found to be greatly affected by stop density, percentage of far or near-sided stops, posted speed, Annual Average Daily Traffic (AADT), bus route frequency, and on-street parking [6].
3.3. Modeling and Exposure
To assist agencies in the decision making process, several studies developed collision models for transit safety by specifically incorporating transit characteristics [16] [17]. These models allow for network screening in safe-ty management and provide valuable assistance in the planning and evaluation of transit routes. The amount of exposure to traffic that pedestrians receive directly impacts their risk of collisions. A study found that exposure risk and crossing behavior as reviewed earlier share a set of common parameters: road width, traffic volume, walking speed, and presence and type of traffic signals [18]. By exerting greater effort in the design and consid-eration of these variables, pedestrian safety can be improved upon.
According to the 2009 Manual on Uniform Traffic Control Devices (MUTCD) [19], the average walking speed is a critical variable in determining certain traffic signal’s minimum green time. The default pedestrian walking speed is 4 feet per second but by reducing this variable to 3 feet per second, which is more applicable to the elder population, the minimum green time can be increased by up to 6 seconds [20]. Designing in the context of actual site conditions and scenarios is important since the elder population often use public transit; on the contrary, designing in the inappropriate context can increase exposure and crash rates.
3.4. Countermeasures
transit stops can have an impact on crash frequency as well; the relocation of near-sided stops with far-sided stops was found to result in fewer crashes [6].
A study on automatic pedestrian detection devices and smart lighting proved to be effective in increasing pe-destrian safety at lowly lit roadways [22]. These devices showed positive benefits by increasing the pedestrians’ operational behavior and the likelihood of vehicles yielding to the pedestrians. Since pedestrian collisions often occur at night, this countermeasure may be effective in reducing bus operators’ workload as well.
An assessment was conducted on equipping transit buses with yield-to-bus warning signs [23]. These signs, ranging from simple decals to high-tech, electronic devices with flashing diodes, were found to have potential in decreasing bus-vehicle collisions and improving reentry time when merging into traffic.
The effectiveness of these countermeasures varies depending on site location. Therefore, it is necessary to examine the context of each site in terms of cause of crash and feasibility of each mitigation technique as it ap-plies. This research contributes to pedestrian safety by specifically focusing on collisions with transit buses. In addition to risk assessment of bus operations and contributing factors, collisions at hotspot locations were also examined in relation to traffic volume as a predictor. Countermeasures examined in the literature review will also be assigned as appropriate to findings of this research, which provides preliminary findings for future stu-dies in transit and pedestrian safety.
4. Methodology
4.1. Data and Study Locations
The data for this research included approximately 10,400 collision records from 2008 to 2011 provided by SEPTA. Details of each crash event included the date, time, bus route identification, accident code used by SEPTA to identify accident type, and operator comments. Crash details of each case are very limited and com-ments were filled in by the bus operator, not a police officer. Therefore, interpretation of additional crash infor-mation not previously coded was determined based on the researcher’s best interpretation possible of the com-ments. As a result, certain elements presented in the results section are condensed, such as grouping together the following collision cause as one: jaywalking pedestrian and inattention of either party. It should be noted that the researchers made full effort to make the greatest use of the data and information available.
All crashes occurred in the greater area of Philadelphia, Pennsylvaniawith transit bus service. Presented in Figure 1is a map of the city [24]; note that lines do not indicate exact boundaries of bus route service. Figure 2 provides a flowchart of the overall methodology, which includes the initial data processing step and analysis framework. Prior to analysis, all transit bus crashes were separated into four collision types: with vehicles, pede-strians, other SEPTA buses, and objects. In the scope of this research, only the pedestrian-related collisions were examined after this initial step. These collisions were further categorized by detailsto appropriately conduct the analysis. The following categories were identified for all the pedestrian-related collisions:
• Impact point of transit bus • Transit bus maneuver during crash • Primary cause of crash
• Location of crash
These categories were selected based on context and the quality of the comments provided for each case. If the data allows, more categories should be examined, such as traffic signal phase, demographics of pedestrians involved, bus operator experience, and weather. This categorization allows for further investigation of crash types that are common and specific to each category to allow for countermeasure recommendations.
4.2. Hotspot Identification and Traffic Volume Analysis
Hotspots were identified by examining and ranking the frequency of collisions at each location; this is the only suitable method for hotspot identification given the data available. From all the pedestrian-related collisions, any particular location that exhibited two or more counts was designated as a hotspot. Two was selected as the thre-shold because any number higher will have generated too few hotspots to conduct a proper analysis.
Figure 1. Map of study location—Philadelphia County area.
well with the use of analysis of variance (ANOVA). The traffic volume collected in closest proximity to the study period was used for each pedestrian collision hotspot. Due to the variation of hourly traffic volume for the different locations, hourly percentage composition was examined rather than actual hourly counts. This analysis examined the relationship between transit bus-pedestrian collision occurrences and hourly traffic volume to de-termine the statistical correlation degree between these two variables.
5. Data Analysis and Discussion
In categorizing the crashes by collision types, 209 (2.0%) were pedestrian-related, 8686 (83.3%) were ve-hicle-related, 152 (1.5%) were with other SEPTA vehicles, and 1385 (13.2) were identified as other types. Even though pedestrian collisions, the focus of this research, accounted for a much small percentage of total crashes compared to vehicle-related crashes, its severity is often more significant since the pedestrian involved makes direct contact with the bus. Additionally, the lack of research conducted in this category poses as a limitation for strategies and plans that transportation officials such as SEPTA can implement to reduce collision frequency. The majority of this analysis will focus on the top contributing causes and common factors associated with pe-destrian collisions for which countermeasures are presented for.
5.1. Bus Maneuver and Cause Analysis
Figure 2. Methodology flowchart.
vehicle, especially bus operators. It is expected that left-turning buses will contribute greatly to pedestrian colli-sions. These two top contributing causes were examined in greater details in the next two sub-sections to deter-mine specific countermeasures that can actually be implemented. Collisions classified for bus being stationary was third highest at 10%. Reported cases of this type include doors closing early and resulting in injury and pe-destrians rushing towards a bus to board it. Buses making right-turns made up only 3% of the collisions as right-turns are not as mentally demanding as left-turns due to the nature of the roadway. Braking was fifth at 2% followed by other at 1%. Due to the small percentage of collisions that the lower four categories made up, a greater portion of this study will focus on the top two: forward and left-turn.
5.2. Bus Maneuver—Traveling Forward
Presented in Table 1 are causes of collisions associated with buses traveling forward, which represent 58% or 122 of the 209 reported cases. Jaywalking pedestrians or inattention from either parties contributed to about half of the cases. Due to the high percentage, this cause was further investigated and will be presented later. The next leading cause is the category “other” that constitutes a variety of reasons followed by bicycle-related collisions at 15%. The majority of these collisions were found to be on either sides of the bus with no reports of error caused by the bus operator. The comment provided for each case shows that it was the mere presence of the bus traveling next to or near the bicyclist that caused the bicyclist to collide with an object or fall over. This obser-vation offers evidence that the presence of transit buses can increase the risk of other modal users, which are bi-cyclists in this case. There may even be many instances in which the risk of on-foot pedestrians increased as well, but there is no confident measure to assess this from the data. A recommendation to bus operators is to use caution on roads that are shared with bicyclists. At locations with narrow streets and/or no bicycle lanes, bus operators and bicyclists can be encouraged to prevent traveling side-by-side and, instead, travel directly in front of or behind one another. For bicyclists, the recommended strategy is more of an educational approach by rais-ing their awareness on the issue. By addressrais-ing operational safety in this area, it also promotes the aspect of sustainability by encouraging more people to select biking as an alternative transportation mode within the city.
Table 1. Cause of collision for bus traveling forward.
Cause Count Percentage
Jaywalking and Pedestrian/Operator Inattention 60 49%
Other 19 16%
Bicycle Related 18 15%
Pedestrian or Bus Too Close to Curb 8 7%
Pedestrian Clumsiness 6 5%
Unknown 5 4%
Pedestrian Under Influence 3 2%
Bus Operator’s Blind Spot 3 2%
Total 122 100%
(a) (b)
Figure 3. Collision for jaywalking and/or inattention distributed by (a) bus im- pact point and (b) street location.
may be due to the fact that the operator is situated on the left side, which increases the awareness in that general direction. Therefore, it is reasonable to propose the implementation of bus operator educational programs to en-courage additional attention to the right side of the bus. This may be assisted by electronic sensors or additional mirrors for support. It is important to note that the impact point of 27% of this type of collision is unknown. The amount in this uncertainty can certainly skew the actual findings and is a limitation in this examination. As for locations that experience this type of collision, it is about an even split between intersection/bus stop and mid-block with no significant findings.
To assist SEPTA in operation improvement, identifying and ranking bus routes with a history of high colli-sion frequency under this causation were also performed. However, it should be noted that exposure in terms of total route length, traffic volume of all major and minor streets, frequency of schedule, and ridership were not examined in this study. These factors are interrelated and affect a route’s collision rate but due to data limita-tions, these factors were not considered in the analysis. The list of the top ten routes for this bus maneuver was generated for the transit authority to consider providing additional training for their bus operators.
5.3. Bus Maneuvering—Left Turn
Collisions associated with the left-turn maneuver made up 25% of all collisions with 53 reported cases. Overall, this maneuver only contained three categories of reported causes: jaywalking with inattention of pedestrian or bus operator at 75%, pedestrian being in the bus operator’s blind spot at 23%, and 2% being unknown. Due to the mental workload required to make a left-turn, training, education, and operator assistance equipment should be provided to reduce this type of collision. Specifically at intersections where bus route(s) frequently make left-turns, it is appropriate to install protected left-turn signal phasing to alleviate the mental demand on the bus operator. Not only is this beneficial and in line with what the transportation authority desires in safety, drivers of other vehicle types can benefit from this signal redesign as well. Even if pedestrians choose to cross against red, drivers can respond more efficiently due to the overall reduction in their mental load.
[image:7.595.92.537.93.349.2]may underestimate or incorrectly judge the blind spot range of bus operators and should take precaution in pro-tecting themselves on public streets.
As for impact point of buses making left-turns, 37% were on the left side, 35% were unknown, 23% were on the right side, and 5% were at the front. For the unknown category, it was not specified which side of the bus was the impact point. This makes up about one-third of the cases and can affect the actual distribution if known. Therefore, recommendations and conclusions cannot be drawn.
5.4. Bus Maneuver and Collision Count
It is known that exposure is directly related to collision rate because if there are more vehicles and pedestrians on the road, then the time of interaction between them and buses increases. Exposure for the two top contribut-ing causes previously examined (forward and left-turn) is presented inFigure 4 along with all pedestrian-related collisions for each hour of the day. This figure shows the distribution of crashes for each maneuver in relation to all crashes.
To determine if there is a statistical relationship, an ANOVA was used to compare the hourly collision distri-bution of the total with each maneuver individually. At 95% confidence interval, results for forward and left-turn collisions exhibited a p-value less than 0.05 meaning the difference compared to all collisions is statis-tically significant. In other words, collisions associated with buses traveling forward and making a left-turn is significant in the context of time or exposure level to traffic volume especially during the day where the peak occurs. Table 2 summaries the ANOVA results for all maneuver types. Results indicate that collisions asso-ciated with the other four bus maneuvers are not statistically correlated with the time of day in which they occur. The examination of actual traffic volume was then investigated through the use of hotspot locations.
5.5. Hot Spot and AADT Analysis
To determine how AADT relates to collision frequency, citywide representative traffic volume information was necessary since the bus provides service throughout the city. This was obtained by examining the traffic volume at hotspot locations throughout the city. For this study, locations are considered hotspots if they experienced two or more collisions during the three-year study period. This number was used because if hotspots were selected as locations with three or more collisions, the total will only sum to four hotspots as presented inTable 3.
From DVRPC, traffic volume was available and obtained for 13 of the 18 hotspots identified. Each location’s hourly percentage composition was taken and averaged across all hours where n is the number of hotspots fol-lowing Equation (1).
1
Hourly Volum 100 Total Volume Hotspot Hourly Traffic Percentage
n i
e n
= ×
=
∑
(1)Similarly, the hourly percentage composition of all pedestrian collisions was determined as well following Equation (2).
Hourly Pedestrian Collision
Hourly Pedestrian Crash Percentage 100
Total Pedestrian Collision
= × (2)
Figure 4. Frequencies of all collisions compared to forward and left-turn collisions by hour of day.
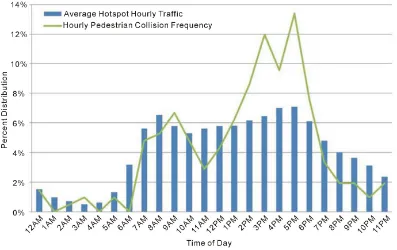
Figure 5. Average traffic volume and collision percentage by hour of day.
Table 2. ANOVA results of hourly collision distribution.
Bus Maneuver P-Value
Forward 0.000
Left-Turn 0.019
Right-Turn 0.312
Braking 0.372
Stopped 0.121
Table 3. Location distribution per collision frequency.
Collision Frequency Collision Count
1 165
2 14
3 2
4 1
5 0
6 1
Table 4. Summary of collisions at hotspots per hourly traffic.
Average Hotspot Hourly Traffic 0% - 1% 1% - 2% 2% - 3% 3% - 4% 4% - 5% 5% - 6% 6% - 7% 7% - 8%
Hotspot Collision Count 0 2 0 1 1 10 14 4
rage jaywalking or using distractions such as mobile devices during certain times of the day.
6. Summary and Recommendations
Since all trips begin and end with walking, pedestrian safety is an area of significant importance for research. This assessment on transit bus and pedestrian collisions provide greater insight into the collisions and their rela-tion to traffic volume. In this research, bus maneuver, cause, impact locarela-tion, and time of collision were ex-amined in relation to traffic volume. The overall findings of this research are as follows:
• Traveling forward and making a left-turn are the primary bus maneuvers that contribute to pedestrian colli-sions;
• Bus maneuver: traveling forward:
o Jaywalking pedestrians and/or inattention of either parties are the primary causes
o Bus operators need to be more cautious of the right side of the bus
o Bus operators and bicyclists should prevent traveling side-by-side on narrow streets • Bus maneuver: making left-turns:
o Jaywalking pedestrians and/or the inattention of either parties are the primary causes of collisions
o The other major cause is pedestrians being in bus operator’s blind spot
• Traffic volume of hotspots (locations with two or more collisions) is representative in relation to all bus-pe- destrian collisions;
• Hourly traffic volume composition can be used as an indicator of bus-pedestrian collision frequency; when the percentage surpass a threshold of 5%, a significant increase was observed.
This study was conducted to determine recurring trends, provide greater insights on these collisions, and de-velop potential relationships with traffic volume. The most important finding of this research is that hourly traf-fic composition can dictate the increased risk of bus-pedestrian collisions. Confirmation of this finding is sug-gested with transit systems of other major cities. Also, it is important to note that transit bus collisions can be caused by many factors such as bus operator error, pedestrian behavior, roadway geometry, traffic signal phas-ing, etc., which should be examined as future research topics. Findings presented in this study fully utilized the extent allowable by the limited data. This study provides preliminary findings for bus-pedestrian collisions. These results can be applied as a basis to develop a pedestrian-transit collision model given analysis data availa-bility and comprehensiveness.
Acknowledgements
The authors of this paper would like to acknowledge SEPTA for the crash data provided for this study. The con-tents of this paper reflect the views of the authors who are responsible for the facts and the accuracy of the data presented herein. The contents do not necessarily reflect the official views or policies of SEPTA.
References
Protec-tion, Washington DC.
[2] US Department of Transportation, Federal Highway Administration. Moving Ahead for Progress of the 21st Century. [3] Department of Transportation (2010) Traffic Safety Facts: 2010 Data. US Department of Transportation, National
Highway Traffic Safety Administration, Washington DC.
[4] Schneider, R.J. and Pande, S. (2012) How Common Is Pedestrian Travel to, from, and within Shopping Districts. Transportation Research Record: Journal of the Transportation Research Board, No. 2299, Transportation Research Board of the National Academies, Washington DC, 11-21.
[5] Shahla, F., Shalaby, A.S., Persaud, B.N. and Hadayeghi, A. (2009) Analysis of Transit Safety at Signalized Intersec-tions in Toronto, Ontario, Canada. Transportation Research Record: Journal of the Transportation Research Board, No. 2102, Transportation Research Board of the National Academies, Washington DC, 108-114.
http://dx.doi.org/10.3141/2102-14
[6] Qi, Y. and Yuan, P. (2012) Pedestrian Safety at Intersections under Control of Permissive Left-Turn Signal. Transpor-tation Research Record: Journal of the TransporTranspor-tation Research Board, No. 2299, TransporTranspor-tation Research Board of the National Academies, Washington DC, 91-99.
[7] Baltes, M.R. and Chu, X. (2002) Pedestrian Level of Service for Midblock Street Crossings. Transportation Research Record: Journal of the Transportation Research Board, No. 1818, Transportation Research Board of the National Academies, Washington DC, 125-133. http://dx.doi.org/10.3141/1818-19
[8] Cui, Z. and Nambisan, S.S. (2003) Methodology for Evaluating the Safety of Midblock Pedestrian Crossings. Trans-portation Research Record: Journal of the TransTrans-portation Research Board, No. 1828, TransTrans-portation Research Board of the National Academies, Washington DC, 75-82.
[9] Cooper, J.F., Schneider, R.J., Sherry, R. and Co, S. (2012) Documenting Targeted Behaviors Associated with Pede-strian Safety. Transportation Research Record: Journal of the Transportation Research Board, No. 2299, Transporta-tion Research Board of the NaTransporta-tional Academies, Washington DC, 1-10. http://dx.doi.org/10.3141/2299-01
[10] Hatfield, J. and Murphy, S. (2007) The Effects of Mobile Phone Use of Pedestrian Crossing Behavior at Signalized and Unsignalized Intersections. Accident Analysis & Prevention, 39, 97-205. http://dx.doi.org/10.3141/2299-01
[11] Balk, S.A., Bertola, M.A., Shurbutt, J. and Do, A. (2014) Human Factors Assessment of Pedestrian Roadway Crossing Behavior. Report No. FHWA-HRT-13-098. US Department of Transportation, Federal Highway Administration, Washington DC.
[12] Montel, M., Brenac, T., Granie, M., Millot, M. and Coquelet, C. (2013) Urban Environments, Pedestrian Friendliness, and Crossing Decisions. Proceedings of the 92nd Transportation Research Board Annual Meeting, France.
[13] Mullen, B., Cooper, C. and Driskell, J.E. (1990) Jaywalking as a Function of Model Behavior. Personality and Social Psychology Bulletin, 16, 320-330. http://dx.doi.org/10.1177/0146167290162012
[14] Tiwari, G., Bangdiwala, S., Saraswat, A. and Gaurav, S. (2007) Survival Analysis: Pedestrian Risk Exposure at Signa-lized Intersections. Transportation Research Part F, 10, 77-89. http://dx.doi.org/10.1016/j.trf.2006.06.002
[15] Wei, C., Becic, E., Edwards, C. and Manser, M. (2013) Bus Driver Intersection Task Analysis: Investigation of Bus-Pedestrian Crashes. Center for Transportation Studies. University of Minnesota, Minneapolis.
[16] Jovanis, P.P., Schofer, J.L., Prevedouros, P. and Tsunokawa, K. (1991) Analysis of Bus Transit Accidents: Empirical, Methodological, and Policy Issues. Transportation Research Record: Journal of the Transportation Research Board, No. 1322, Transportation Research Board of the National Academies, Washington DC, 17-28.
[17] Cheung, C., Shalaby, A.S., Persaud, B.N. and Hadayeghi, A. (2008) Models for Safety Analysis of Road Surface Tran-sit. Transportation Research Record: Journal of the Transportation Research Board, No. 2063, Transportation Re-search Board of the National Academies, Washington DC, 168-175. http://dx.doi.org/10.1016/j.trf.2006.06.002
[18] Papadimitriou, E., Yannis, G. and Golias, J. (2012) Analysis of Pedestrian Exposure to Risk in Relation to Crossing Behavior. Transportation Research Record: Journal of the Transportation Research Board, No. 2299, Transportation Research Board of the National Academies, Washington DC, 79-90. http://dx.doi.org/10.3141/2299-09
[19] Federal Highway Administration, Manual of Uniform Traffic Control Devices (MUTCD), 2009 Edition.
[20] Kim, H.K. and Hunter, M.P. (2005) Effect of Pedestrian-Related Factors on Intersection Performance. Transportation Research Record: Journal of the Transportation Research Board, No. 1920, Transportation Research Board of the Na-tional Academies, Washington DC, 65-73. http://dx.doi.org/10.3141/1920-08
[21] Nabors, D., Robert, S., Leven, D., Lieberman, K. and Mitchell, C. (2008) Pedestrian Safety Guide for Transit Agencies. US Department of Transportation, Federal Highway Administration, Washington, DC.
DC, 27-34.
[23] Fabregas, A., Lin, P., Gonzalez-Velez, E., Datz, A. and Zhou. H. (2009) Safety and Operation Assessment of Yield-to-Bus Electronic Warning Signs on Transit Buses. Transportation Research Record: Journal of the Transporta-tion Research Board, No. 2218, TransportaTransporta-tion Research Board of the NaTransporta-tional Academies, Washington DC, 1-9.