Comparison between transrectal and transperineal prostate
biopsy for detection of prostate cancer: a meta-analysis and
trial sequential analysis
Jianxin Xue1,2,*, Zhiqiang Qin2,*, Hongzhou Cai3,*, Chuanjie Zhang4, Xiao Li3,
Weizhang Xu5, Jingyuan Wang6, Zicheng Xu3, Bin Yu3, Ting Xu3, Qin Zou3
1Department of Urology, The Second Affiliated Hospital of Southeast University, Nanjing, 210003, China 2Department of Urology, The First Affiliated Hospital of Nanjing Medical University, Nanjing, 210029, China
3Department of Urologic Surgery, The Affiliated Cancer Hospital of Jiangsu Province of Nanjing Medical University, Nanjing, 210009, China
4First Clinical Medical College of Nanjing Medical University, Nanjing, 210029, China
5Department of Thoracic Surgery, Nanjing Medical University Affiliated Cancer Hospital, Jiangsu Key Laboratory of Molecular and Translational Cancer Research, Cancer Institute of Jiangsu Province, Nanjing, 210009, China
6Department of Gastrointestinal Oncology, Key Laboratory of Carcinogenesis and Translational Research (Ministry of Education), Peking University Cancer Hospital and Institute, Beijing 100142, China
*These authors have contributed equally to this work
Correspondence to: Bin Yu, email: yubin_urology@sina.com
Ting Xu, email: xuting_urology@sina.com
Keywords: transperineal, transrectal, prostate biopsy, prostate cancer, meta-analysis
Received: October 25, 2016 Accepted: December 01, 2016 Published: February 03, 2017
ABSTRACT
To systematically assess the efficacy and complications of transrectal (TR) versus transperineal (TP) prostate biopsy in the detection of prostate cancer (PCa). A meta-analysis was performed by searching the databases Pubmed, Embase and Web of science for the relevant available studies until September 1st, 2016, and thirteen studies met the inclusion criteria. The pooled odds ratios with 95% confidence intervals were calculated to evaluate the differences of TR and TP groups in PCa detection rate. Then, trial sequential analysis was performed to reduce the risk of type I error and estimated whether the evidence of the results was reliable. Overall, this meta-analysis included a total of 4280 patients, who had been accrued between April 2000 and Aug 2014 and randomly divided into TR group and TP group. Prostate biopsies included sextant, extensive and saturation biopsy procedures. Patients who received TP prostate biopsy had no significant improvement in PCa detection rate, comparing TR group. Moreover, when comparing TR and TP studies, no significant difference was found in abnormal DRE findings, serum PSA level measurement, Gleason score, prostate volume. Besides, this meta-analysis showed no obvious differences between these two groups in terms of relevant complications. Therefore, this meta-analysis revealed that no significant differences were found in PCa detection rate between TP and TR approaches for prostate biopsy. However, with regard to pain relief and additional anesthesia, TR prostate needle biopsy was relatively preferable, compared to TP prostate biopsy.
INTRODUCTION
Prostate cancer (PCa) was the most frequently diagnosed malignancy among the male population in the western countries [1]. Although the data from the American Society showed that the estimated 5-year
survival rate was 98.9%, PCa remained second leading cause of cancer-related death among men in USA [1, 2]. Therefore, there is an urgent need for a better diagnostic technology for early detection of PCa. The elevated serum prostate-specific antigen (PSA) level measurement, abnormal digital rectal examination (DRE) finding
www.impactjournals.com/oncotarget/ Oncotarget, 2017, Vol. 8, (No. 14), pp: 23322-23336
and transrectal ultrasonography (TRUS), as widely opportunistic screening tools, have been widely used to diagnose patients at a high risk of PCa [3]. Moreover, since the systematic sextant prostate biopsy was firstly introduced to detect PCa by Hodge et al. [4] by TRUS guidance, prostate biopsy had become a widely-accepted and routinely-performed technology to detect PCa [5]. However, the optimal biopsy strategy for PCa detection remained to be completely defined.
Transperineal (TP) biopsy and Transrectal (TR) biopsy are the two primary approaches in the detection of PCa by obtaining prostate tissue specimen. There are a lot of differences between the two, such as puncture site, puncture route and the TRUS transducer. Currently, lack of standardization lies in the differences of TP and TR approaches in the rates of PCa detection. In TR biopsy, the needle punctures through the anterior rectal wall under the guidance of an end-fire transducer. But in TP biopsy, the needle punctures through skin of perineum under the guidance of a bi-planar transducer [6]. Early studies have reported that TP biopsy was superior to TR biopsy with regard to detecting PCa [7]. That was probably because that TP biopsy was targeted to the lateral, apico-dorsal peripheral and transition zones in the routine biopsy might increase PCa detection rates [8–11]. In addition, previous studies had recommended an increase in the number of biopsy cores [12–14]. However, the number of biopsies required for optimizing the diagnosis of PCa was still controversial. With the increased number of biopsy cores, more and more studies involved deemed that they were equivalent, compared to TP and TR approaches in PCa detection rate [15, 16]. Besides, with respect to the associated complications, it seemed that no significant differences were detected between the two.
To date, several clinical randomized trials have investigated the detailed efficacy and complications in the patients with a high risk of PCa in the comparison between TR and TP biopsy. However, the results remained inconsistent or even contradictory. In addition, lack of further researches in various relevant complications systematically illustrated comprehensive understanding of the differences about TR and TP approaches in patients with high-risk PCa in previous meta-analyses [17]. Hence, in order to compare PCa diagnostic accuracy and complications of TP and TR biopsies, an updated meta-analysis was conducted by including all individual patient data from eligible studies to identify this statistical evidence. Furthermore, trial sequential analyses (TSA) were for the first time used to clarify whether the evidence for the results was sufficient.
RESULTS
Studies characteristics
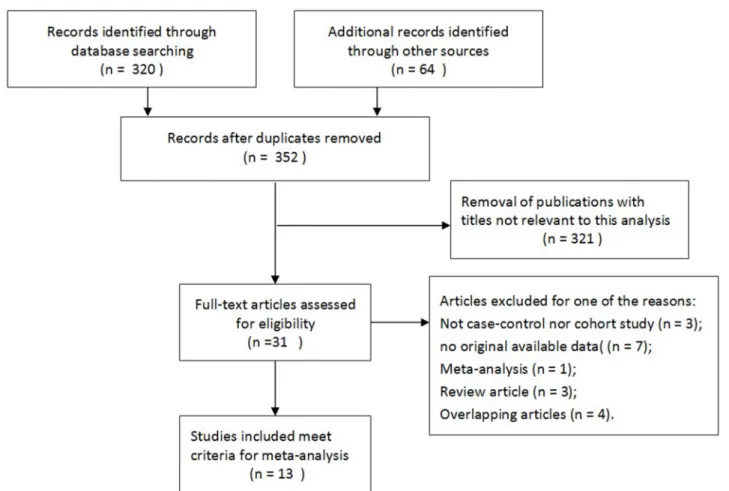
A total of thirteen studies including 4280 patients met the inclusion criteria and were involved in the present
meta-analysis [6, 15, 18-25], which had been accrued between April 2000 and Aug 2014. All of the baseline characteristics of the studies involved are comprehensively listed in Table 1. Besides, patients were randomly divided into TR group and TP group. In this meta-analysis, these trials were divided into three groups: the sextant biopsy group (four studies) [18, 22, 25], extensive biopsy group (seven studies) [15, 19–21, 23] and saturation biopsy group (one study) [24]. In addition, one study by Guo et al. [6] mentioned two kinds of biopsy groups including sextant biopsy and extensive biopsy approaches. Figure 1 shows the flowchart of literature search and screening process.
Quantitative synthesis results
Overall, patients who received TP prostate biopsy had no significant improvement in PCa detection rate, comparing TR group. Moreover, when comparing TR and TP studies, no significant differences were found in abnormal DRE findings, serum PSA level measurement, Gleason score, prostate volume. Besides, this meta-analysis showed no obvious differences between these two groups in terms of related complications.
prostate cancer detection rate
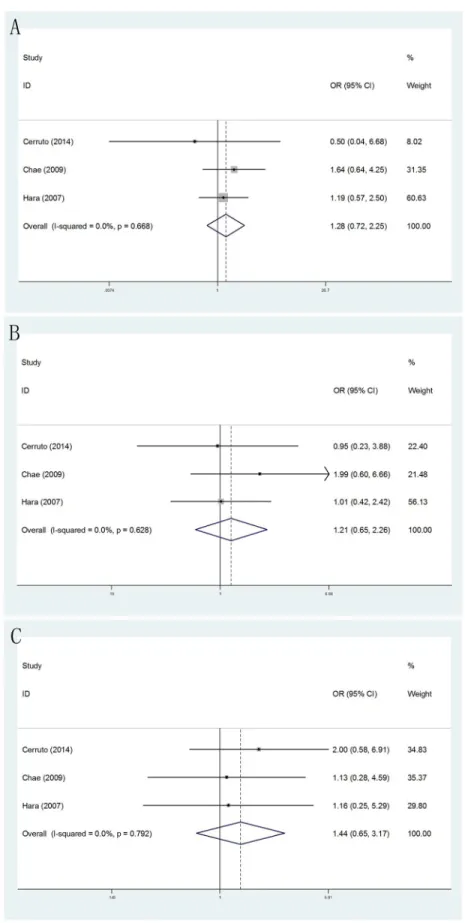
No significantly differences were found in PCa detection rate of TR versus TP prostate biopsy (OR = 1.11, 95% CI = 0.92–1.34). (Figure 2A). When the studies were stratified by number of biopsy cores, the results were still no significantly differences whether in extensive biopsy group (OR = 1.14, 95% CI = 0.89–1.45), sextant biopsy group (OR = 0.99, 95% CI = 0.70–1.39) or saturation biopsy group (OR = 1.32, 95% CI = 0.79–2.23). (Figure 2B) Moreover, in the stratified analysis by ethnicity, no significant results were detected in both Asian population (OR = 1.15, 95% CI = 0.90–1.47) and Caucasian population(OR = 1.06, 95% CI = 0.79–1.41). (Figure 2C)
abnormal DRE findings
Meanwhile, patients who received TP prostate biopsy had no obvious improvement in abnormal DRE findings, compared with TR prostate biopsy group (OR = 1.07, 95% CI = 0.88–1.32). (Figure 3A) In the subgroup analysis by number of biopsy cores, the results were no significant in extensive biopsy group (OR = 1.22, 95% CI = 0.93–1.60), in sextant biopsy group (OR = 0.87, 95% CI = 0.62–1.23) and in saturation biopsy group (OR = 1.08, 95% CI = 0.51–2.27). (Figure 3B) Besides, when the studies were stratified by ethnicity, we detected no significantly differences in both Asian population (OR = 1.20, 95% CI = 0.95–1.52) and Caucasian population (OR = 0.78, 95% CI = 0.53–1.16). (Figure 3C)
serum prostate-specific antigen (PSA) level measurement
According to different PSA levels (PSA≤4ngml-1,
Table 1: Characteristics of individual studies included in the meta-analysis
Year Surname Country Ethnicity Patients (n) Mean age (years) PSA (ng/ml) Total prostate volume (mL) No. of cores Biopsy group Design TR
group groupTP TR group TP group TR group TP group TR group TP group groupTR groupTP
2015 Guo China Asian 166 173 67.35±7.28 67.18±6.76 10.48 (6.2–69.0) 8.81(3.6–56.0) 45.9(20.0–98.0) (12.9–97.7) 12 or 8† 12 or 8†47.2 Mixed RCT
2014 Cerruto Italy Caucasian 54 54 67.30±8.05 66.50±8.87 12.36±39.65 15.95±41.04 61.49±33.39 56.29±31.33 14 14 Extensive PCS
2014 Yuan China Asian 97 59 66.1 65.4 19.7 (7.8–362.0) 21.2(8.9–235.0) 35.8(19.8–93.6) (21.3–87.5)33.7 6 + 2‡ 6 + 2‡ Sextant CCS
2014 Miano Italy Caucasian 255 278 64.0±6.2 64.6±5.8 8.6±4.1 8.6±5.3 42.3±16.7 38.9±29.7 12 12 Extensive CCS
2012 Hossack Australia Caucasian 718 414 NM NM NM NM 50.8±18.4 52.4±17.2 12 12 Extensive CCS
2011 Abdollah Italy Caucasian 140 140 (47.6–82.1)66.2 (52.0– 79.0) 9.7 (2.1–26.2)66.4 10 (0.9–31.5) 65.4 (15.0–193.0) (17.0–198.0)62.3 24 24 Saturation CCS
2009 Chae Korea Asian 100 100 66.6±9.03 64.4±9.76 13.8±20.39 23.1±103.67 NM NM 12 12 Extensive RCT
2008 Takenaka Japan Asian 100 100 72.1±7.42 71.1±7.53 19.6±43.2 17.1±30.1 37.2±19.7 34.5±18.9 12 12 Extensive RCT
2007 Kawakami Japan Asian 231 243 68 (64–73) 68 (64–72) 7.7 (5.3–12) 7.6 (5.3–12) 29 (23–42) 29 (22–40) 12 14 Extensive CCS
2008 Hara Japan Asian 120 126 71.7±7.55 71.0±7.29 8.48±3.90 8.34±3.44 36.0±17.1 33.2±15.2 12 12 Extensive RCT
2005 Watanabe Japan Asian 161 166 72.5 (41–98) 10.3 (0.6–460.0) NM NM 6 6 Sextant CCS
2005 Miller Australia Caucasian 103 75 66.9±1.5 69.5±1.4 58.5±38.0 19.1±5.4 NM NM 6 6 Sextant CCS
2003 Emiliozzi Italy Caucasian 107 68 (52–88) 8.2(4.1–240) NM NM 6 6 Sextant CCS
NM: not mentioned;
†:12 cores were sampled from the prostate with volume > 50ml, whereas 8 cores from prostate with volume < 50 ml; ‡:On the basis of the 6 needle prostate puncture, Plus 1 needles on both sides of the prostatic peripheral zone.
Figure 2: Forest plots of PCa detection rate compared with TR and TP prostate biopsy. A. Forest plots of efficacy of TR versus TP prostate biopsy in the PCa detection rate; B. Forest plots of subgroup analysis by number of biopsy cores in the PCa detection rate compared with the two; C. Forest plots of subgroup analysis by ethnicity in the PCa detection rate compared with the two.
Figure 3: Forest plots of abnormal DRE findings compared with TR and TP prostate biopsy. A. Forest plots of efficacy of TR versus TP prostate biopsy in abnormal DRE findings; B. Forest plots of subgroup analysis by number of biopsy cores in abnormal DRE findings compared with the two; C. Forest plots of subgroup analysis by ethnicity in abnormal DRE findings compared with the two.
PSA>20ngml-1), no significant results were detected in
any subgroup (Figure 4). Furthermore, through subgroup analyses by different serum PSA level measurement (PSA≤10ngml-1 and PSA>10ngml-1), the result showed no
obvious differences between PSA≤10ngml-1 (OR = 1.02,
95% CI = 0.77–1.33) (Figure 5A) and PSA>10ngml-1 (OR
= 1.09, 95% CI = 0.83–1.44) (Figure 5B). In addition, whether in PSA≤10ngml-1 group (Figure 5C) and
PSA>10ngml-1 group (Figure 5D), no significant results
were detected in both extensive biopsy group and sextant biopsy group in the stratified analysis by number of biopsy cores.
Gleason score
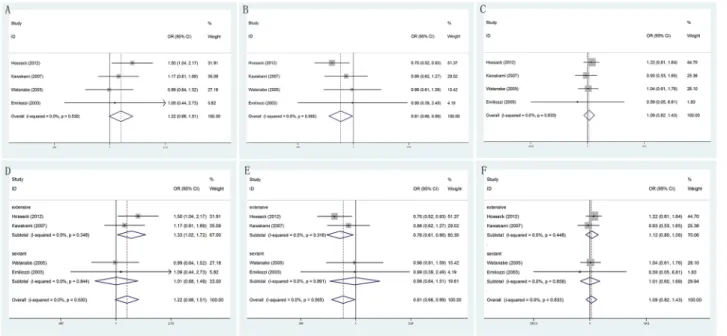
When comparing TR and TP biopsy groups in biopsy Gleason score ≤6 (OR = 1.22, 95% CI = 0.98– 1.51) and ≥8 (OR = 1.09, 95% CI = 0.82–1.43), there were no statistically significant differences in two groups of patients. Besides, statistically significant was found only among biopsy Gleason score =7 (OR = 0.81, 95% CI = 0.66–0.99). Moreover, in the extensive biopsy group, subgroup analysis showed that significant results increased risk in TR prostate biopsy group in Gleason score ≤6 (OR
= 1.33, 95% CI = 1.02–1.72). However, when Gleason score was equal to 7 (OR = 0.76, 95% CI = 0.61–0.96), we found statistically significant differences decreased risk in TR prostate biopsy group. Meanwhile, no statistically significant differences were found in any other groups (Figure 6).
Prostate volume
No matter how size of prostate volume, we did not still find there were significantly differences when comparing TR and TP biopsy approaches. (Figure 7)
Complications
In current meta-analysis, results of relevant complications comparing TR versus TP biopsies were showed in Table 2. Outcomes showed that there were no significantly differences in all complications involved, including hematuria (20.6% vs17.1%; OR = 1.14, 95% CI = 0.85,1.53), rectal bleeding (10.2% vs1.5%; OR = 4.49, 95% CI = 0.51,39.22), hematospermia (0.7% vs1.2%; OR = 0.59, 95% CI = 0.14,2.47), sepsis (0.4% vs0.4%; OR = 0.93, 95% CI = 0.15,5.82), fever (1.6% vs0.2%; OR = 5.46, 95% CI = 0.84,35.58), urinary retention (3.8%
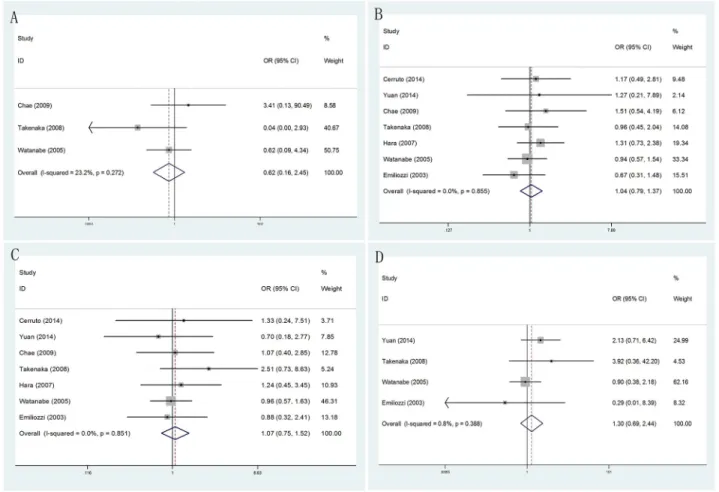
Figure 4: Forest plots of different PSA levels compared with TR and TP prostate biopsy. A. Forest plots of efficacy of TR versus TP prostate biopsy in PSA≤4ngml-1; B. Forest plots of efficacy of TR versus TP prostate biopsy in 4ngml-1<PSA≤10 ng ml-1;
C. Forest plots of efficacy of TR versus TP prostate biopsy in 10ngml-1<PSA≤20ngml-1; D. Forest plots of efficacy of TR versus TP prostate
vs2.4%; OR = 1.39, 95% CI = 0.57,3.37), vasovagal event (1.5% vs0.9%; OR = 1.57, 95% CI = 0.51,4.82), post-dural puncture headache (0.0% vs3.1%; OR = 0.03, 95% CI = 0.00,2.44).
Test of heterogeneity
Heterogeneity between studies was observed in PCa detection rate of TR and TP approaches respectively, but the heterogeneity was decreased through subgroup analyses. In addition, there was no prominent heterogeneity (P = 0.778), and the pooled OR for PCa detection rate was performed using Fixed-effort model.
Sensitivity analysis
Sensitivity analysis was utilized to detect the influence of each study on the pooled OR by repeating the meta-analysis while omitting one single study each time. The sensitivity analysis for the results of TR and
TP approaches in PCa detection rate demonstrated that no individual study affected the pooled OR significantly. Thus, sensitivity analysis showed that our results were statistically robust.
Publication bias
The Begg’s funnel plot was applied to assess the publication bias of the literature, and the shapes of them seemed no evidence of obviously asymmetrical, indicating no significant publication bias, which was also confirmed according to funnel plot (Begg’s test, P = 0.835; Egger’s test, P = 0.606). (Figure 8) Therefore, the overall outcomes indicated that our findings were reliable.
Trial sequential analysis results
In our current study, the cumulative Z-curve (the blue line) did not exceed the information size (vertical red line) (Figure 9) in both PCa detection rate and abnormal
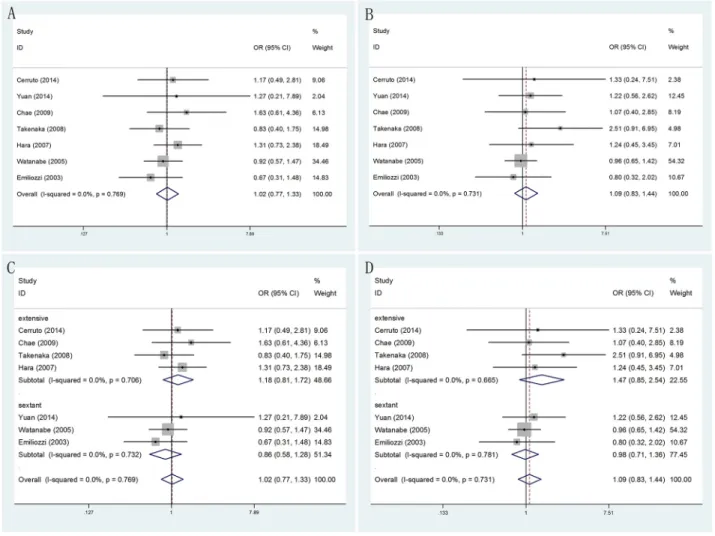
Figure 5: Forest plots of different PSA levels (PSA≤10ngml-1 and PSA>10ngml-1) compared with TR and TP prostate
biopsy. A. Forest plots of efficacy of TR versus TP prostate biopsy in PSA≤10ngml-1; B. Forest plots of efficacy of TR versus TP prostate
biopsy in PSA>10ngml-1; C. Forest plots of subgroup analysis by number of biopsy cores in PSA≤10ngml-1 compared with the two; D. Forest
DRE findings, suggesting in-sufficient evidence of efficacy of TR versus TP biopsy. Therefore, our results need to be further checked with a sufficiently large number of participants to certify the previously reported differences in well-designed studies.
DISCUSSION
With the widespread clinical use of opportunistic screening tools, such as PSA, DRE and TRUS, prostate biopsy has become one of the most commonly performed urological technologies. Systematic biopsy of the prostate has been considered as the golden standard for the diagnosis of PCa, confirming the grading of PCa and stratifying tumor aggressiveness. The reason for this is because that the definite detection of PCa depends on the histopathological verification of cancer in prostate biopsy cores or surgical specimens. Likewise, in recent years, the number of cores taken on baseline biopsy has increased from six to twelve, while in the repeat biopsy setting more extended and saturation protocols are regularly applied. The two major techniques for prostate biopsy are the TR and TP biopsy respectively. Though the two approaches seem to have the same PCa detection rate and overall complication rate, it is interesting to note that TR biopsy is more popular globally [26]. That is because that compared to TP approach, TR prostate biopsy have some advantages including more time-saving, relatively simple operation as well as the non-essential for high-grade anesthesia. Therefore, Either American Urology Association and
European Association of Urology recommends that TR biopsy is used as the most common method, while TP biopsy is a useful alternative [27].
Recently, increasing relevant studies researched clinical efficacy and complications of TR and TP prostate biopsy in the detection of PCa. To the best of our knowledge, this was an updated meta-analysis that systematically and comprehensively investigated the efficacy and adverse events in two kinds of prostate biopsy approaches, in order to elucidate such differences. Nevertheless, the outcomes remained inconsistent or unclear. The conflict among them might partially own to the relatively small sample size of individual studies, the different ethnicities and the possible limited effect of individual patient data in prostate biopsy. All these contributed to the limited statistical power in the published studies. Moreover, TSA was adopted to test for the first time in the present meta-analyses. Therefore, we needed a better method to assess the efficacy and complications of TR and TP prostate biopsy in the detection of PCa. On the one hand, further researches in different stratified analysis were necessary in these meta-analyses. On the other hand, for the first time, we applied TSA to reduce the risk of type I error and testify whether the evidence of our results was sufficient. Moreover, quiet a few meta-analyses explored results of TR and TP prostate biopsy [17], but the results in early articles involved differed a lot. What’s more, lack of further researches by different stratified analysis in these meta-analyses prevented comprehensive understanding of the disparity and different between two groups.
Figure 6: Forest plots of biopsy Gleason score compared with TR and TP prostate biopsy. A. Forest plots of efficacy of TR versus TP prostate biopsy in Gleason score ≤6; B. Forest plots of efficacy of TR versus TP prostate biopsy in Gleason score =7; C. Forest plots of efficacy of TR versus TP prostate biopsy in Gleason score ≥8; D. Forest plots of subgroup analysis by number of biopsy cores in Gleason score ≤6 compared with the two; E. Forest plots of subgroup analysis by number of biopsy cores in Gleason score =7 compared with the two; F. Forest plots of subgroup analysis by number of biopsy cores in Gleason score ≥8 compared with the two.
Figure 7: Forest plots of prostate volume compared with TR and TP prostate biopsy. A. Forest plots of efficacy of TR versus TP prostate biopsy in prostate volume <30ml; B. Forest plots of efficacy of TR versus TP prostate biopsy in 30 ml≤prostate volume ≤50 ml
Furthermore, additional studies about such distinction had been published since the previous meta-analysis, which might generate great influence on the results. All these factors contributed to the development of the current meta-analysis.
This meta-analysis of individual patient data confirmed that, compared with TR approach, using TR approach did not markedly increase rates of PCa detection, and relieve adverse events in patients with prostate biopsy. Meta-analysis as a powerful tool could provide more reliable results than a single study especially in explaining controversial conclusions [28]. As a consequence, we took advantage of meta-analysis to clarify which was an advanced method in the diagnosis of PCa. To the best of our knowledge, meta-analysis could also provide the most comprehensive information by different subgroup analysis. In addition, in the stratified analysis by number of biopsy cores and ethnicity, the results showed there were no significantly differences in both two groups. Thus, findings of our current meta-analysis suggested that TP prostate biopsy was no superior to TR prostate biopsy.
Patients who received TP prostate biopsy had no improvement in PCa detection rate, comparing TR group. Likewise, in the stratified analysis by number of biopsy cores and ethnicity, no significant results was still detected. Moreover, to further compare the differences between the two methods, we performed statistical analysis in abnormal DRE findings, serum PSA level measurement, Gleason score, prostate volume. But, the results of meta-analysis showed that no significantly differences were found except when Gleason score =7 or Gleason score ≤6 in the extensive biopsy group. It was likely that limited number of trials and the insufficient data of articles included might result in such conclusions. Therefore, further high-quality researches were needed to confirm these findings in subsequent years.
In current meta-analysis, the results confirmed that no significantly differences in all complications
were detected comparing TR versus TP prostate biopsy, including hematuria, rectal bleeding, hematospermia, sepsis, fever, urinary retention, vasovagal event and post-dural puncture headache. In a recent review, a higher risk of infection was arisen in TR biopsy because the faecal carriage bacteria can easily enter the blood from puncture sites [29]. Besides, compared with TP group, rectal bleeding and infection-related complications were more frequently observed in the TR group. Thus, they raised the risk of major complications in the TR group. Though the major complications appeared to be rare, sometimes they might be also life-threatening. From another aspect, previous studies suggested that some shortcomings of TP prostate biopsy including consumption of longer time, training and financial constraints, relatively higher rate of sampling failure as well as the need for additional high-grade anesthesia [30]. Indeed, the above-mentioned factors might limit the use of TP approach; however, as far as we know, no previous studies have been carried out to compare TP group with TR group on the above-mentioned factors in prostate biopsy directly. In addition, according to our experience, complications of rectal bleeding or infection in TP group could relatively decrease because of its uniqueness in puncture route that rectum was not involved. However, in present meta-analysis there were no significant differences in rectal bleeding, fever and sepsis between these two groups. Moreover, specifically, patients with increased risk of rectal bleeding or infection suffered from disease, such as known hemorrhoids, antibiotic resistance or some other situations, TP approach might be a safer alternative. Hence, further studies were needed to clarify this point. Nevertheless, our analysis indicated that the profile of complications between TR versus TP biopsy was equivalent, and all the adverse effects were tolerable and manageable.
TSA is a powerful and useful approach in the goal of summarizing evidence and provided the required information size in meta-analyses [31, 32]. In order
Table 2: Outcomes of Related complications comparing transperineal and transrectal prostate biopsy
Complications Trials TR group TP group Heterogeneity OR (95% CI) P-value P-value I2 (%) Hematuria 6 143/694 108/633 0.817 0 1.14 (0.85,1.53) 0.366 Rectal bleeding 7 76/748 10/687 0.001 74.0 4.49 (0.51,39.22) 0.174 Hematospermia 4 3/436 5/407 0.441 0 0.59 (0.14,2.47) 0.475 Sepsis 4 2/497 2/474 0.765 0 0.93 (0.15,5.82) 0.936 Fever 4 7/435 1/447 0.789 0 5.46 (0.84,35.58) 0.073 Urinary retention 4 14/371 8/339 0.907 0 1.39 (0.57,3.37) 0.465 Vasovagal event 5 8/551 5/528 0.872 0 1.57 (0.51,4.82) 0.432 Post-dural puncture headache 2 0/220 7/226 0.842 0 0.03 (0.00,2.44) 0.117
to reduce the risk of type I error and estimate whether further trials are needed, TSA is introduced to calculate the required information size for the meta-analysis with the adaptation of monitoring boundaries [33]. However, the meta-analyses not reaching the required sample size are analyzed with trial sequential monitoring boundaries, which is similar to interim monitoring boundaries in a single trial [32, 34–36]. Compare to the traditional meta-analysis, TSA show the potential to be more reliable. If the sufficient information size is not reached, false positive results are early eliminated due to random errors and repeated significance testing in meta-analyses [32, 34, 37]. Besides, when reliable evidence is obtained by TSA, other researchers can stop implementation of remainder studies. Otherwise, this makes it necessary to re-estimate the additional number of patients required to obtain reliable results in the meta-analyses, thereby guiding experimenter in subsequent trials [38, 39]. In the present meta-analysis, the number of cases and controls included were less than the required information size, which meant that our results needed to be further firm evidence of effect.
To a certain extent, some limitations in our meta-analysis should be taken into consideration when interpreting the data. Firstly, with limiting numbers of published studies and insufficient number of patients, the results were based
on unadjusted estimates. As a consequence, inclusion criteria about data of each patient in previous articles was difference a lot. So as to the relatively high heterogeneity, which could be reduced by subgroup analysis. Secondly, many factors could affect the accuracy of prostate puncture, such as different puncture site, the number of cores in different zones of the prostate and the proficiency of a particular physician, but these were not considered in our subgroup analysis. Exploring more better puncture strategy was required by more researches in the future. In addition, in the stratified analyses, sample size of some subgroups was relatively small, without enough statistical power to explore the efficacy of TR versus TP biopsy. What’s more, no available data of some adverse events in TR versus TP biopsy were not assessed in all included trials. Thus, further exploration in these complications might be conducted in subsequent years. Last but not least, the majority studies used were investigated in Caucasian and Asian population, suggesting analysis result might exist some merits. Hence, to guaranty reliability of our meta-analysis, more researches should focus on the influence of different factors in subsequent articles. Accordingly, it was required that further studies could be performed to elucidate the differences in the effectiveness of prostate puncture in comparison with TR and TP groups if individual data were available.
Figure 8: Begg’s funnel plot of publication bias test in the PCa detection rate compared with TR and TP prostate biopsy.
CONCLUSION
In summary, the results of the current meta-analysis indicated that no significant differences were found in terms of efficiency and complications between TP and TR approaches for prostatic biopsy. However, with regard to pain relief and additional anesthesia, TR prostate needle
biopsy was relatively preferable, compared to TP prostate biopsy. Hence, TP prostate biopsy should be available to urologists as an alternative procedure. As a result, taking into account the current limited data in the included studies, patients with prostatic biopsy, additional high-quality and multicentre studies are needed to further to elaborate such differences in subsequent articles.
Figure 9: Trial sequential analysis of efficacy of TR versus TP prostate biopsy. A. TSA of PCa detection rate compared with TR and TP prostate biopsy; B. TSA of abnormal DRE findings compared with TR and TP prostate biopsy. The required information size was calculated based on a two side α= 5%, β= 20% (power 80%), and a relative risk reduction of 20%.
MATERIALS AND METHODS
A comprehensive search was conducted in the databases PubMed, EMBASE and Web of Science for relevant articles, covering all the literatures published until September1st, 2016, and no language restrictions were applied. Through the literature retrieval, combinations of the following sets of keywords were included: “transperineal”, “transrectal” or “prostate biopsy”, “detection” or “diagnosis” and “prostate cancer” or “prostatic neoplasms”. In addition to electronic search original papers, relevant review articles were hand-searched from reference lists of original articles or reviews to find additional eligible studies. Besides, abstract booklets and presentations were also checked from the annual academic conferences. Furthermore, we not only sent emails to the corresponding author to obtain desired information if more data was needed, but also asked participating trialists if they were aware of studies not retrieved by the trial search. Last but not least, if more than one article had been published using the same series of study subjects, only the study with the most recent or complete data was selected.
Articles involved had to meet the following inclusion criteria: (1) Randomized controlled trials, case-control studies and cohort studies were included; (2) The patients were suspicious of PCa who previously underwent prostate biopsy; (3) Efficacy and complications of trails compared with TP and TR prostate biopsies; (4) Sufficient data from the included studies could be extracted. The major exclusion criterion was as follows: (1) No available information or complete data; (2) Non-original research; (3) Patients with a previous history of PCa, acute prostatitis or proven urinary tract infection; (4) Duplicates of previous publication.
Data extraction
The identified studies were reviewed carefully by two co-authors (Qin ZQ and Li X) independently to determine whether an individual study met inclusion criteria. All data was centrally extracted from the eligible publications and the disagreement was resolved by a discussion with a third reviewer. The following extracted information was recorded in a standardized form and all the data were selected from included articles: year of publication, first author’s name, nationality, ethnicity, study design, number of patients, mean age (years) and range, serum concentration of PSA, mean size of total prostate volume, number of biopsy cores and some relevant complications.
Statistical analysis
The pooled odds ratios (ORs) with 95% confidence intervals (CIs) were utilized to evaluate
the strength of differences in TR and TP approaches. Heterogeneity assumption was verified by calculating the Chi-square test and I-square test. The fixed-effects model (Mantel-Haenszel method) and the random-effects model (DerSimonian-Laird method) were respectively used in the meta-analysis. If the presence of heterogeneity was detected, the random-effects model would be conducted. Otherwise, fixed-effects model would be used. Besides, the sources of heterogeneity were explored if there was significant heterogeneity among studies. Thus, subgroup analysis was further carried out by different number of biopsy cores and ethnicity. In addition, sensitivity analysis was performed with the method of appraising the stability of results by omitting one single study each time. Moreover, publication bias was examined by Begg’s funnel plot and further checked by Egger’s linear regression test between the studies. P values were all two-sided and were considered statistically significant when less than 0.05 [40]. All statistical data were conducted by using Stata software (version 12.0; StataCorp LP, College Station, TX).
Trial sequential analysis
Outcomes of meta-analysis may result in type I errors due to repetitive testing of accumulated data and are prone to systematic or random errors with sparse data collected [32, 37]. Therefore, TSA was introduced, which estimated the required information size by adjusting threshold for significance level with dispersed data and confirmed more statistical reliability of the data than that of the traditional meta-analysis [37, 41–43]. In the current meta-analysis, TSA was performed by maintaining a 95% CIs, a 20% relative risk reduction, an overall type-I error of 5%, and a statistical test power of 80%, which the required information size was calculated and the trial sequential monitoring boundaries was constructed. If the cumulative Z-curve (the blue line) crossed the trial sequential monitoring boundary (sloping red line) or exceeded the required information size (vertical red line), a significant result had been reached and no further studies were needed. Otherwise, if the cumulative Z-curve did not cross the boundary or the information size required had not been reached, we needed additional clinical trials to reach the adequate information size required to obtain sufficient evidence [32, 35–37, 44]. The trial sequential analysis software (TSA, version 0.9; Copenhagen Trial Unit, Copenhagen, Denmark, 2011) was performed in this study.
CONFLICTS OF INTEREST
Authorʼs contributions
Yu.B, Xu.T, and Zou.Q conceived protocol/ project development. Xu.ZC and Xue.JX performed data collection or management. Xu.WZ, Zhang.CJ and Wang JY performed data analysis. Li.X, Qin.ZQ and Cai. HZ drafted the initial manuscript. All authors read and approved the final version of the manuscript.
REFERENCES
1. Siegel RL, Miller KD, Jemal A. Cancer statistics, 2016. CA Cancer J Clin. 2016; 66:7–30.
2. Eeles RA, Olama AA, Benlloch S, Saunders EJ, Leongamornlert DA, Tymrakiewicz M, Ghoussaini M, Luccarini C, Dennis J, Jugurnauth-Little S, Dadaev T, Neal DE, Hamdy FC, et al. Identification of 23 new prostate cancer susceptibility loci using the iCOGS custom genotyping array. NAT GENET. 2013; 45:385-391, 391e. 3. Schröder FH, Hugosson J, Roobol MJ, Tammela TL, Ciatto S,
Nelen V, Kwiatkowski M, Lujan M, Lilja H, Zappa M, Denis LJ, Recker F, Berenguer A, et al, and ERSPC Investigators. Screening and prostate-cancer mortality in a randomized European study. N Engl J Med. 2009; 360:1320–28. 4. Hodge KK, McNeal JE, Terris MK and Stamey TA.
Random systematic versus directed ultrasound guided transrectal core biopsies of the prostate. J Urol. 1989; 142:71-74, 74-75.
5. Heidenreich A, Bastian PJ, Bellmunt J, Bolla M, Joniau S, van der Kwast T, Mason M, Matveev V, Wiegel T, Zattoni F, Mottet N, and European Association of Urology. EAU guidelines on prostate cancer. part 1: screening, diagnosis, and local treatment with curative intent-update 2013. Eur Urol. 2014; 65:124–37.
6. Guo LH, Wu R, Xu HX, Xu JM, Wu J, Wang S, Bo XW, Liu BJ. Comparison between Ultrasound Guided Transperineal and Transrectal Prostate Biopsy: A Prospective, Randomized, and Controlled Trial. Sci Rep. 2015; 5:16089. 7. Emiliozzi P, Corsetti A, Tassi B, Federico G, Martini M, Pansadoro V. Best approach for prostate cancer detection: a prospective study on transperineal versus transrectal six-core prostate biopsy. Urology. 2003; 61:961–66.
8. Mazal PR, Haitel A, Windischberger C, Djavan B, Sedivy R, Moser E, Susani M. Spatial distribution of prostate cancers undetected on initial needle biopsies. Eur Urol. 2001; 39:662–68.
9. Kojima M, Hayakawa T, Saito T, Mitsuya H, Hayase Y. Transperineal 12-core systematic biopsy in the detection of prostate cancer. Int J Urol. 2001; 8:301–07.
10. Yamamoto S, Ito T, Aizawa T, Noda K, Umezu K, Ohtsuru N, Hata K. Does transrectal ultrasound guided eight-core prostate biopsy improve cancer detection rates in patients with prostate-specific antigen levels of 4.1-10 ng/mL? Int J Urol. 2004; 11:386–91.
11. Stamey TA. Making the most out of six systematic sextant biopsies. Urology. 1995; 45:2–12.
12. Eskew LA, Bare RL and McCullough DL. Systematic 5 region prostate biopsy is superior to sextant method for diagnosing carcinoma of the prostate. J Urol. 1997; 157:199-202, 202-203.
13. Presti JJ, Chang JJ, Bhargava V and Shinohara K. The optimal systematic prostate biopsy scheme should include 8 rather than 6 biopsies: results of a prospective clinical trial. J Urol. 2000; 163:163-166, 166-167.
14. Ravery V, Goldblatt L, Royer B, Blanc E, Toublanc M, Boccon-Gibod L. Extensive biopsy protocol improves the detection rate of prostate cancer. J Urol. 2000; 164:393–96. 15. Takenaka A, Hara R, Ishimura T, Fujii T, Jo Y, Nagai A, Fujisawa M. A prospective randomized comparison of diagnostic efficacy between transperineal and transrectal 12-core prostate biopsy. Prostate Cancer Prostatic Dis. 2008; 11:134–38.
16. Hara R, Jo Y, Fujii T, Kondo N, Yokoyoma T, Miyaji Y, Nagai A. Optimal approach for prostate cancer detection as initial biopsy: prospective randomized study comparing transperineal versus transrectal systematic 12-core biopsy. Urology. 2008; 71:191–95.
17. Shen PF, Zhu YC, Wei WR, Li YZ, Yang J, Li YT, Li DM, Wang J, Zeng H. The results of transperineal versus transrectal prostate biopsy: a systematic review and meta-analysis. Asian J Androl. 2012; 14:310–15.
18. Miller J, Perumalla C, Heap G. Complications of transrectal versus transperineal prostate biopsy. ANZ J Surg. 2005; 75:48–50.
19. Cerruto MA, Vianello F, D’Elia C, Artibani W, Novella G. Transrectal versus transperineal 14-core prostate biopsy in detection of prostate cancer: a comparative evaluation at the same institution. Arch Ital Urol Androl. 2014; 86:284–87. 20. Miano R, De Nunzio C, Kim FJ, Rocco B, Gontero P, Vicentini
C, Micali S, Oderda M, Masciovecchio S, Asimakopoulos AD. Transperineal versus transrectal prostate biopsy for predicting the final laterality of prostate cancer: are they reliable enough to select patients for focal therapy? Results from a multicenter international study. Int Braz J Urol. 2014; 40:16–22. 21. Kawakami S, Yamamoto S, Numao N, Ishikawa Y, Kihara
K, Fukui I. Direct comparison between transrectal and transperineal extended prostate biopsy for the detection of cancer. Int J Urol. 2007; 14:719–24.
22. Watanabe M, Hayashi T, Tsushima T, Irie S, Kaneshige T, Kumon H. Extensive biopsy using a combined transperineal and transrectal approach to improve prostate cancer detection. Int J Urol. 2005; 12:959–63.
23. Hossack T, Patel MI, Huo A, Brenner P, Yuen C, Spernat D, Mathews J, Haynes AM, Sutherland R, del Prado W, Stricker P. Location and pathological characteristics of cancers in radical prostatectomy specimens identified by transperineal biopsy compared to transrectal biopsy. J Urol. 2012; 188:781–85.
24. Abdollah F, Novara G, Briganti A, Scattoni V, Raber M, Roscigno M, Suardi N, Gallina A, Artibani W, Ficarra V, Cestari A, Guazzoni G, Rigatti P, Montorsi F. Trans-rectal versus trans-perineal saturation rebiopsy of the prostate: is there a difference in cancer detection rate? Urology. 2011; 77:921–25.
25. Yuan LR, Zhang CG, Lu LX, Ruan L, Lan JH, Feng SQ, Luo JD. [Comparison of ultrasound-guided transrectal and transperineal prostate biopsies in clinical application]. Zhonghua Nan Ke Xue. 2014; 20:1004–07. Comparison of ultrasound-guided transrectal and transperineal prostate biopsies in clinical application
26. Scattoni V, Maccagnano C, Capitanio U, Gallina A, Briganti A, Montorsi F. Random biopsy: when, how many and where to take the cores? World J Urol. 2014; 32:859–69. 27. Carter HB. American Urological Association (AUA)
guideline on prostate cancer detection: process and rationale. BJU Int. 2013; 112:543–47.
28. Nakaoka H, Inoue I. Meta-analysis of genetic association studies: methodologies, between-study heterogeneity and winner’s curse. J Hum Genet. 2009; 54:615–23.
29. Steensels D, Slabbaert K, De Wever L, Vermeersch P, Van Poppel H, Verhaegen J. Fluoroquinolone-resistant E. coli in intestinal flora of patients undergoing transrectal ultrasound-guided prostate biopsy—should we reassess our practices for antibiotic prophylaxis? Clin Microbiol Infect. 2012; 18:575–81.
30. Chang DT, Challacombe B, Lawrentschuk N. Transperineal biopsy of the prostate—is this the future? Nat Rev Urol. 2013; 10:690–702.
31. Imberger G, Wetterslev J, Gluud C. Trial sequential analysis has the potential to improve the reliability of conclusions in meta-analysis. Contemp Clin Trials. 2013; 36:254–55. 32. Wetterslev J, Thorlund K, Brok J, Gluud C. Trial sequential
analysis may establish when firm evidence is reached in cumulative meta-analysis. J Clin Epidemiol. 2008; 61:64–75. 33. Brok J, Thorlund K, Gluud C, Wetterslev J. Trial sequential analysis reveals insufficient information size and potentially false positive results in many meta-analyses. J Clin Epidemiol. 2008; 61:763–69.
34. Devereaux PJ, Beattie WS, Choi PT, Badner NH, Guyatt GH, Villar JC, Cinà CS, Leslie K, Jacka MJ, Montori
VM, Bhandari M, Avezum A, Cavalcanti AB, et al. How strong is the evidence for the use of perioperative beta blockers in non-cardiac surgery? Systematic review and meta-analysis of randomised controlled trials. BMJ. 2005; 331:313–21.
35. Pogue JM, Yusuf S. Cumulating evidence from randomized trials: utilizing sequential monitoring boundaries for cumulative meta-analysis. Control Clin Trials. 1997; 18:580–93.
36. Pogue J, Yusuf S. Overcoming the limitations of current meta-analysis of randomised controlled trials. Lancet. 1998; 351:47–52.
37. Brok J, Thorlund K, Wetterslev J, Gluud C. Apparently conclusive meta-analyses may be inconclusive—Trial sequential analysis adjustment of random error risk due to repetitive testing of accumulating data in apparently conclusive neonatal meta-analyses. Int J Epidemiol. 2009; 38:287–98.
38. Gluud LL. Bias in clinical intervention research. Am J Epidemiol. 2006; 163:493–501.
39. Alderson P. Absence of evidence is not evidence of absence. BMJ. 2004; 328:476–77.
40. Egger M, Davey Smith G, Schneider M, Minder C. Bias in meta-analysis detected by a simple, graphical test. BMJ. 1997; 315:629–34.
41. Thorlund K, Devereaux PJ, Wetterslev J, Guyatt G, Ioannidis JP, Thabane L, Gluud LL, Als-Nielsen B, Gluud C. Can trial sequential monitoring boundaries reduce spurious inferences from meta-analyses? Int J Epidemiol. 2009; 38:276–86.
42. Turner RM, Bird SM, Higgins JP. The impact of study size on meta-analyses: examination of underpowered studies in Cochrane reviews. PLoS One. 2013; 8:e59202.
43. Zhang S, Tang Q, Wu W, Yuan B, Lu C, Xia Y, Ding H, Hu L, Chen D, Sha J, Wang X. Association between DAZL polymorphisms and susceptibility to male infertility: systematic review with meta-analysis and trial sequential analysis. Sci Rep. 2014; 4:4642.
44. Wetterslev J, Thorlund K, Brok J, Gluud C. Estimating required information size by quantifying diversity in random-effects model meta-analyses. BMC Med Res Methodol. 2009; 9:86.