The seroepidemiology of
Bordetella pertussis
infection in
Western Europe
R. G. P E B O D Y1*, N. J. G A Y1, A. G I A M M A N C O2, S. B A R O N3, J. S C H E L L E K E N S4,
A. T I S C H E R5, R.-M. O¨ L A N D E R6, N. J. A N D R E W S1, W. J. E D M U N D S1,
H. L E C O E U R7, D. L E´ V Y - B R U H L3, P. A. C. M A P L E8, H. D E M E L K E R4,
A. N A R D O N E1, M. C. R O T A9, S. S A L M A S O9, M. A. E. C O N Y N - V A N
S P A E N D O N C K4
, S. S W I D S I N S K I10
A N D E. M I L L E R1
1Immunisation Department, Health Protection Agency(HPA)Communicable Disease Surveillance Centre, London, UK
2
Department of Hygiene and Microbiology, University of Palermo, Palermo, Italy 3Institut de Veille Sanitaire(InVS), Paris, France
4
Rijksinstituut voor Volksgezondheid en Milieu(RIVM), Bilthoven, The Netherlands 5Robert-Koch Institut(RKI), Berlin, Germany
6
Kansanterveyslaitos(KTL), Helsinki, Finland 7Socie´te´ Medilog, Roissy-CDG, France
8HPA Specialist & Reference Microbioloy Division(SRMD), London, UK 9Istituto Superiore di Sanita`(ISS), Rome, Italy
10Microbiological Laboratory, Friedrichshain Hospital, Berlin, Germany
(Accepted 19 July 2004)
S U M M A R Y
High titres of pertussis toxin (PT) antibody have been shown to be predictive of recent infection withBordetella pertussis. The seroprevalence of standardized anti-PT antibody was determined in six Western European countries between 1994 and 1998 and related to historical surveillance and vaccine programme data. Standardized anti-PT titres were calculated for a series of whole-cell and
acellular pertussis vaccine trials. For the serological surveys, high-titre sera (>125 units/ml) were
distributed throughout all age groups in both high- (>90 %) and low-coverage (<90 %) countries.
High-titre sera were more likely in infants in countries using high-titre-producing vaccines in their primary programme (Italy, 11.5 % ; Western Germany, 13.3 % ; France, 4.3 % ; Eastern Germany, 4.0 %) compared to other countries (The Netherlands, 0.5 % ; Finland, 0 %). Recent infection was significantly more likely in adolescents (10–19 years old) and adults in high-coverage countries (Finland, The Netherlands, France, East Germany), whereas infection was more likely in children
(3–9 years old) than adolescents in low-coverage (<90 % ; Italy, West Germany, United Kingdom)
countries. The impact and role of programmatic changes introduced after these surveys aimed at protecting infants from severe disease by accelerating the primary schedule or vaccinating older children and adolescents with booster doses can be evaluated with this approach.
I N T R O D U C T I O N
Despite the availability of effective vaccines for several decades, pertussis continues to be a public
health problem in many European countries ; circu-lating widely in countries with low vaccine coverage and reportedly re-emerging in other highly vaccinated populations [1–6].
* Author for correspondence : Dr R. G. Pebody, Immunisation Department, Communicable Disease Surveillance Centre, Health Protection Agency, 61 Colindale Avenue, London, UK. (Email : Richard.Pebody@hpa.org.uk)
In the pre-vaccination era, the majority of the population was infected before 10 years of age, with significant morbidity and mortality particularly in in-fants and young children [7]. Most European countries introduced universal infant vaccination with whole-cell pertussis vaccines during the 1950s. By the 1970s, with concerns about vaccine safety, several countries ceased their pertussis control programmes (e.g. Sweden, West Germany), while others experienced a dramatic decline in coverage (e.g. the United Kingdom) [8]. These events stimulated the develop-ment of acellular vaccines, specific subcomponents of the bacterium with a better side-effect profile [9], that several countries have now introduced [10, 11].
The current epidemiology of pertussis in Europe relates to this historical diversity of control pro-grammes. There is a predictable, negative correlation between vaccine coverage and reported incidence of pertussis [8]. However, the reasons for the reappear-ance of pertussis in highly vaccinated populations (such as the United States, Finland and The Netherlands) [1–4] are less clear. Reported cases have often been in adolescents and adults who have been previously immunized or infected [1, 12, 13] and who present with atypical or mild clinical features. Two explanations have been put forward. First, that vac-cination protects against disease, but less well against infection and transmission and that pertussis con-tinues to circulate widely and ‘ silently ’ amongst adults in highly vaccinated populations [7, 14], with cyclical epidemics every 3–4 years as in the pre-vaccination era [15, 16]. The recent re-emergence of pertussis is thus explained by improved case ascertainment due to better diagnosis of disease in adults and reporting [13, 14]. An alternative explanation is provided by a more recent analysis which found an increase in the ob-served inter-epidemic period following mass vacci-nation, suggesting a reduction in transmission and a resultant increase in age of infection [16]. Other fac-tors, which could contribute to the re-emergence of pertussis in older populations, are waning protection after vaccination or infection [17] and to a lesser
ex-tent the emergence of antigenic variants ofBordetella
pertussis, resulting in increased susceptibility amongst previously vaccinated individuals [2, 3].
Whatever the explanation, infection in older per-sons does seem to be of public health importance. The extent of infection and the potential disease bur-den in these older age groups remains inadequately described and it is suggested that children and teen-agers can be involved in the spread of pertussis to
unprotected or partially protected infants resulting in significant morbidity [18–22]. Several countries have thus recently introduced acellular pertussis booster doses in an attempt to reduce pertussis circulation in older age groups [11, 23] and indirectly reduce trans-mission to infants. Others have accelerated their vac-cination schedules by delivering the primary schedule at an earlier age in infancy to provide direct protec-tion [24].
Surveillance tools are critical to monitor the impact of these interventions. However, routine pertussis surveillance data has well-recognized limitations re-lated to variations in clinical and surveillance practice and a lack of sufficiently sensitive diagnostic methods. There is a need for alternative, standardized tools to evaluate the effectiveness of new prevention strategies. Recently, de Melker and colleagues demonstrated that high titres of antibody to pertussis toxin (PT) can be a sensitive and specific indicator of recent infection [25]. In a longitudinal cohort of Dutch patients with clinically confirmed pertussis infection, the mean time
of persistence of immunoglobulin-G (IgG) PT>100
Dutch units/ml amounted to 4.5 months. Antibody
titres declined to <100 Dutch units in almost all
patients after a period of 12 months, independent of age and vaccination status. Monitoring the distri-bution of high-titre sera as a marker for the incidence of infection in the general population could be a tool to understand the impact of vaccination and to po-tentially evaluate programme performance. However, the age-specific distribution of high-titre sera depends upon exposure to both natural pertussis infection and pertussis immunization ; these two factors can only be disentangled through knowledge of the anti-PT IgG antibody response to both vaccination and infection.
In this paper, we document the prevalence of high titres of anti-PT IgG antibody in large, comparable serological surveys from six Western Europe countries with various pertussis immunization programmes. The anti-PT antibody results from each country have been statistically standardized against a reference laboratory [26] and the results interpreted together with standardized immunogenicity data from a variety of vaccine trials, with knowledge of the country-specific historical vaccine schedules, the types of vac-cines used and the reported vaccine coverage. This provides a unique opportunity to better understand the true extent of infection across the population in each country and to compare the impact of a variety of intervention strategies.
M E T H O D S
Vaccine programme history and performance
A questionnaire was distributed to the participating countries in the European Sero-Epidemiology Net-work (ESEN) in 1997 to gather data on pertussis vaccine programmes (including type of vaccine, num-ber of doses and age of administration). Surveillance practice including pertussis case definitions, historical vaccine coverage and the number of pertussis cases reported by age group were collected. Some results have previously been reported [10]. Countries were
divided into two groups [‘ high coverage ’ (>90 %) and
‘ low coverage ’ (<90 %)] based on mean reported
coverage in the 15–20 years prior to the serosurvey. Pertussis incidence rates were calculated based on official notifications of pertussis infection and annual population data. Secular trends in pertussis incidence were examined to identify epidemic years and to esti-mate the inter-epidemic period. The proportion of reported cases older than 10 years of age in each epi-demic year was calculated.
Serum survey collection
Six countries (England & Wales, Finland, France, Germany, Italy, The Netherlands) undertook collec-tion and testing of large serum banks for anti-PT IgG antibody between 1994 and 1998. Details of the sources of sera and methods of collection have been described previously [27]. A minimum number of sera to be collected in each age group was established, with equal numbers by gender in each age group. The total numbers of sera tested by each country ranged from 2606 to 7755 (see Appendix). Briefly, two sampling methods were used : population-based sampling (The Netherlands) or residual sera submitted to laboratories for other purposes (the remaining five countries). The sera were collected from geographi-cally diverse sites in each country to provide a reason-ably representative estimate of the general population experience.
Information collected on each sample included : age, gender, date of sampling and geographical infor-mation. The latter enabled the identification of sera from former East and West Germany.
Standardization : panel distribution and testing
To achieve quantitative comparability of assay results between countries, the results were standardized using a previously described methodology [26]. Briefly,
the process involved the creation of a panel of 150
samples : 50 negative sera (<5 ESEN units/ml), 12
low positive (5–10 ESEN units/ml) and 88 positive
(>10 ESEN units/ml) sera for PT IgG antibody
by the reference laboratory (University of Palermo, Italy). Forty-two of these sera were considered to be
high-titre positive (>125 ESEN units/ml).
The reference panel was distributed to the national laboratory in each participating country, to be tested with their usual quantitative method (enzyme im-munoassay) for serum anti-PT IgG antibody. All laboratories (except The Netherlands) used the US Food and Drug Administration (FDA) standard serum (lot HRP3) as an external control to calibrate their test assays. The panels were tested twice : once before main serum bank testing to evaluate test per-formance and again during main serum bank testing. Country-specific standardization equations were cal-culated by regressing the local results of panel testing against those of the reference laboratory.
Main serum survey testing
Each main national serum survey was tested using the same validated assay method as the reference panel. The country-specific standardization equations were used to convert local quantitative results of serum sur-vey into standardized reference laboratory unitage. Details of the country-specific assays and standardiz-ation methodology have been described recently [26]. The reference laboratory cut-offs were used to classify standardized results. The minimum limit of detection (MLD) was defined as 5 units/ml. The cut-off chosen to indicate likelihood of recent infection
was 125+ESEN units/ml (equivalent to 100 Dutch
units/ml). This has been shown to indicate with high probability, infection from within 4 weeks of disease onset up to 1 year after [25, 26]. A further cut-off of 62.5 ESEN units (equivalent to 50 Dutch units) was also used, which shows infection in the previous 12 months with high probability [25, 26].
High-titre re-testing
A subsample of 100 high-titre sera (mostly >62.5
ESEN units) was selected from the main serosurvey in each country for re-testing by the Italian reference laboratory. These were used to validate the country-specific standardization equations obtained from testing the main reference panel and to provide more information for the quantitative inter-country
comparisons. These results have been previously described [26]. In this paper, the German high-titre re-tests suggested the standardized titres should have been even higher, and that the proportion of high-titre sera described in the current paper are probably an underestimate.
PT antibody levels post-vaccination
High PT titres are produced by natural infection for which we use a cut-off of 125 ESEN units. To deter-mine whether such high titres could be produced by vaccination, we re-analysed data from four trials of a variety of whole-cell and acellular vaccines in the United Kingdom and standardized the results into comparable ESEN unitage [24, 28–30]. These allowed a direct comparison with the results of the present serosurvey, and thus, determine if anti-PT antibody levels due to vaccination were similar to those due to natural infection.
In a study by Miller [28], a phase II randomized clinical trial was undertaken to compare the immuno-genicity of three acellular vaccines [manufactured by Wyeth-Lederle (Maidenhead, Berks, UK), Connaught (Willowdale, ON, Canada), Aventis-Pasteur (Maiden-head, Berks, UK)] and a whole cell vaccine (Well-come). Sera were sampled 4–6 weeks and 12–18 months after completion of a three-dose primary course in infancy. In a second study by Bell [29], the immunogenicity of a whole-cell vaccine (Pasteur-Me´rieux, Wellcome, Beckenham, Kent, UK) was measured in 146 infants, 4–6 weeks following immu-nization. In a third study by Miller [30], the immuno-genicity of a booster dose of whole-cell vaccine (Wellcome) was measured in 96 children, aged 4–5 years, 6 weeks after vaccination. In a final study by Miller [24], the immunogenicity of a pre-school booster of four acellular vaccines was measured in 330 (Aventis-Pasteur), 134 (SmithKline Beecham, Welwyn Garden City, Herts, UK), 181 (Chiron Biocine CA, USA) and 116 (Wyeth-Lederle) children, aged 4–5 years with samples taken 4–6 weeks after vaccination.
The Centre for Applied Microbiology and
Research (CAMR), UK, assayed the sera from the four trials for anti-PT IgG antibodies, using enzyme-linked immunosorbent assay. A two-step standardiz-ation process was used. First, to convert CAMR units to UK units, a total of 387 sera were tested by both CAMR and the Central Public Health Laboratory (241 samples taken from the general population and 146 from individuals presenting with cough illness).
The standardization equation was derived using the technique described above (details available on request). Secondly the UK results were converted into ESEN equivalent units using the UK standardization equation derived from reference panel testing as part of the ESEN project [26].
Statistics
All data were entered and managed in Microsoft Excel (Version 7). Statistical analysis was undertaken in Epi-Info, version 6.04b (CDC, Atlanta, GA, USA) and STATA, version 7.0 (StataCorp, TX, USA).
Pro-portions were compared using thex2test or Fisher’s
exact test as appropriate. For inter-country com-parisons across age groups, direct standardization was undertaken using the European standard popu-lation [31].
R E S U L T S
Vaccine programme history
All six ESEN countries introduced pertussis vacci-nation with whole-cell vaccine during the 1950s and 1960s (Table 1). A variety of whole-cell vaccines were used : some produced by national centres (Finland, The Netherlands and East Germany until 1989), the remainder by a variety of commercial manufacturers. All six countries had three-dose primary pro-grammes at the time of the serosurvey : Finland, The Netherlands and Germany had a 3, 4, 5 months schedule ; Italy a 3, 5, 7 months schedule ; France and England & Wales, an accelerated schedule delivered at 2, 3, 4 months. Two countries (England & Wales, Italy) had no booster dose in their routine pro-gramme. The four remaining countries had a booster dose administered ranging from the age of 11 months (The Netherlands), 12–15 months (Germany), 18 months (France) to 24 months (Finland). France introduced a second booster dose for the 11–13 years age group in 1998, the year of the serosurvey.
For the primary course at the time of the sero-survey, four countries (Finland, England & Wales, France, The Netherlands) used solely whole-cell vaccine. In Finland and The Netherlands, the vac-cine was produced by national manufacturers ; in England & Wales by a variety of commercial manu-facturers (including Aventis-Pasteur, Wellcome-Evans and SmithKline Beecham) and in France by Aventis-Pasteur. The two other countries (Italy, Germany)
had introduced commercially produced acellular vaccines for the primary schedule (Lederle and Smith-Kline Beecham in Germany ; Chiron and SmithSmith-Kline Beecham in Italy). Germany was also still using whole-cell vaccine produced by Chiron and Aventis-Pasteur at the time of the serosurvey.
For the booster doses, Finland and The Nether-lands used nationally produced whole-cell vaccines. Germany and France used commercially produced acellular vaccines (Lederle and SmithKline Beecham in Germany ; Aventis-Pasteur and SmithKline Beech-am in France).
Reported vaccine coverage levels
Reported vaccine coverage levels for the third dose of pertussis vaccine (DPT3) measured between 12 and 24 months of age varied dramatically over time and between country (Figs 1 and 2, Table 2). High
(>90 %) coverage levels have been maintained for
more than 20 years in Finland, The Netherlands, France and East Germany until reunification in 1990 (Table 2).
In West Germany and England & Wales, coverage levels dropped substantially during the 1970s and 1980s [32] (Fig. 2). The programme was ceased in West Germany in 1975 and only recommenced fol-lowing reunification in 1990. Coverage levels in the
United Kingdom recovered steadily during the 1990s to reach 94 % by 1995, the year of the serosurvey. In Italy, reported coverage was low with considerable regional variation in uptake (8–71 % in 1991), but with a recent increase of up to 88 % by 1996 [33].
Reported incidence of pertussis
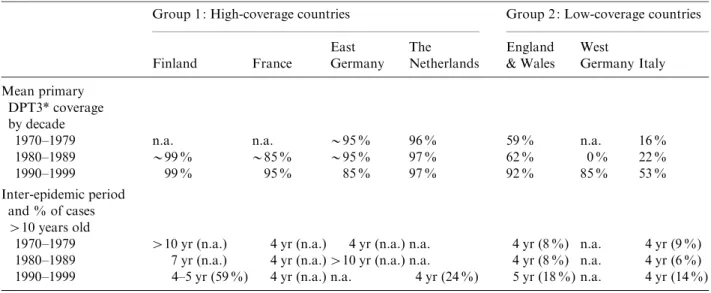
The inter-epidemic period and the age distribution of cases each epidemic year are outlined in Table 2. Finland, France and Italy had epidemic years in the 12 months before the survey was conducted, unlike The Netherlands or United Kingdom. No recent dis-ease surveillance data was available from united Germany.
In two of the four historically high-coverage countries (Finland and the former East Germany), during the 1970s and early 1980s, a long inter-epidemic period was observed (up to 10 years) (Table 2). During the 1990s, regular epidemics were observed in France, Finland and The Netherlands at 4–5 yearly intervals. In Finland nearly 60 % of reported cases were older than 10 years of age, as were 24 % of reported cases in The Netherlands.
In the two historically low-coverage countries (England & Wales, Italy) for which surveillance data is available, the inter-epidemic period remained at 4–5 yearly intervals over the past three decades. In both
Table 1. History of pertussis vaccination programme in six ESEN countries
Country
Type of
pertussis-containing vaccine
Year of introduction and cessation
Age of primary course
Age of booster doses
Finland DTP whole cell 1957– 3, 4, 5 mo. 24 mo.
France DTP whole cell 1959– 2, 3, 4 mo. 16–18 mo. until 1998
DTaP acellular 1998– 18 mo., 11–13 yr
West Germany DTP whole cell 1964–76 3, 4, 5 mo. 12–15 mo.
East Germany DTP whole cell 1963–90 3, 4, 5 mo. 3 yr
Germany DTP whole cell 1991–97 3, 4, 5 mo. 12–15 mo.
DTaP acellular 1995– 3, 4, 5 mo. 12–15 mo.
DTaP acellular* 2000– 11–18 yr
Italy DTP whole cell 1964– 3, 5, 7 mo.
DTaP acellular 1995–99 3, 5, 7 mo.
DTaP acellular* 1999– 3, 5, 11 mo. 5–6 yr
The Netherlands DTP whole cell 1952–99 3, 4, 5 mo. 11 mo.
DTP whole cell* 1999– 2, 3, 4 mo. 11 mo.
DTaP acellular* 2001– 4 yr
United Kingdom DTP whole cell 1957–91 3, 5, 10 mo.
DTP whole cell 1991– 2, 3, 4 mo.
DTaP acellular* 2001 4–5 yr
countries, the proportion of cases older than 10 years of age increased from 6–9 % in the period from 1970
to the 1980s to>14 % in the 1990s.
PT antibody levels post-vaccination
In infancy, 4–6 weeks after the primary course of the two whole-cell and all three acellular vaccines, the standardized geometric mean titres (GMTs) were well below the 125 ESEN units/ml cut-off (Table 3). However, for the whole-cell and the acellular vaccines produced by Aventis-Pasteur, the estimated pro-portion of vaccinees with GMTs above 125 units/ml was 26 % and 11 % respectively. Twelve to eighteen months after vaccination, the proportion of vaccinees
estimated to have titres >125 units/ml had declined
to>2 % for all four vaccines examined.
At age 4–5 years, 4–6 weeks after a booster dose of the Wellcome whole-cell vaccine, the estimated pro-portion of vaccinees with titres above 125 units/ml was 1 %. For the four acellular vaccines, the estimated proportion of vaccinees with high-titre antibody
levels ranged from 4 % (Wyeth-Lederle) to over 30 % (Chiron Biocine).
Prevalence of anti-PT titre by age
Figures 1 and 2 show the distribution of anti-PT titres by age group, together with the reported DPT3 coverage and the vaccine exposure of each age cohort in the 12 months prior to the serosurvey. Several points can be noted : first, high titres of PT
anti-body (both>62.5 and>125 units/ml) (Figs 1–3) were
found in all age groups and in each country.
Second, the three countries using high-titre-producing vaccines (Chiron acellular vaccine or Aventis-Pasteur whole-cell vaccine) in their primary schedule had a significantly higher proportion of high-titre sera (125 units/ml) in infants (Italy, 11.5 % ; West Germany, 13.3 % ; East Germany, 4 % ; France, 4.3 %) compared to the two high-coverage countries using other whole-cell vaccines (reference Italy) : The
Netherlands (0.5 %, P<0.001), Finland (0 %, P=
0.007). Finland
The Netherlands
0 5 10 15 20 25
0–2 3–4 5–9
10–14 15–19 20–24 25–34 35–44 45–64
65+
0–2 3–4 5–9
10–14 15–19 20–24 25–34 35–44 45–64 65+ Age group (years)
Age group (years)
% Population with high titre
0 5 10 15 20 25
% Population with high titre
0 20 40 60 80 100
% Population vaccinated
0 20 40 60 80 100
% Population vaccinated
East Germany
AcP/Wc
AcP/Wc
France
0–2 3–4 5–9
10–14 15–19 20–24 25–34 35–44 45–64 65+ 0–2 3–4 5–9
10–14 15–19 20–24 25–34 35–44 45–64 65+
Age group (years) Age group (years)
0 5 10 15 20 25
% Population with high titre
0 5 10 15 20 25
% of Population with high titre
0 20 40 60 80 100
% Population vaccinated
0 20 40 60 80 100
% Population vaccinated
WcP
WcP
Fig. 1.Age-specific distribution of PT high IgG titres and historical reported DTP3 coverage in four high coverage ESEN countries.%,>125 units/ml ; , 62.5–125 units/ml ; , vaccinated.
Third, children and adolescents (<20 years of age) were more likely to have high anti-PT titres than adults. The standardized relative prevalence of
high-titre sera in each country for those <20 years old
compared to those >20 years was 1.4 for The
Netherlands, 1.5 for Finland, 1.7 for East Germany, 2.3 for France, 3.0 for West Germany, 5.0 for United Kingdom and 6.5 for Italy.
Fourth, the age-standardized proportion of high-titre sera occurring in age groups older than 10 years
was higher in high-coverage countries compared to low. Thus, Finland (92 % of all high-titre sera), The Netherlands (89 %), France (84 %) and East Germany (72 %) were higher than United Kingdom (65 %), West Germany (60 %) and Italy (55 %).
Fifth, the prevalence of high-titre sera was higher in adolescents (10–19 years) compared to children (3–9 years) in the high-coverage countries. Thus in Finland
(7.1 % in adolescentsvs. 2.4 % in children,P<0.001),
France (4.8 %vs. 1.3 %,P<0.001), The Netherlands
(1.7 % vs. 0.9 %, P=0.09), East Germany (5.8 %vs.
2.7 %, Fisher’s exactP=0.4). The reverse trend was
observed in the low-coverage countries : England &
Wales (2.6 % in adolescents vs. 3.2 % in children,
P=0.54), West Germany (3 %vs. 4.8 %,P=0.09) and
Italy (5.7 %vs. 8.8 %,P=0.02).
Finally, there were a significantly larger proportion of high-titre sera in the age-standardized total popu-lation in those countries undertaking serosurveys in the 12 months following an epidemic year compared to those countries with no recent epidemic. The stan-dardized prevalence of high-titre sera in countries with recent epidemics was 2.1 % in France, 3.2 % in Italy and 3.4 % in Finland compared to 0.9 % in the non-epidemic Netherlands and 1.2 % in the United Kingdom. No surveillance data was available from Germany to determine the epidemic year.
D I S C U S S I O N
This article is the first to compare the seroepidemi-ology of pertussis infection in several European countries. The approach outlined allows the quantifi-cation and comparison of the extent of pertussis infection in a variety of populations with very differ-ent historical exposure to both vaccine and infection. The results show that overall there are significant le-vels of high titres of anti-PT antibody in all age groups in all the study populations, but with evidence of both age- and country-specific differences. By col-lating data on coverage levels, vaccine types and schedules, a better understanding of the reasons be-hind these inter- and intra-country differences can be developed.
One of the main objectives of the ESEN project was to standardize the methodology for serum bank col-lection and testing [34]. Each country continued to use their usual ELISA method to detect PT antibody, which have been shown to differ in several aspects resulting in potential problems of comparison [26]. The distribution and testing of a reference panel of England & Wales
0 5 10 15 20 25
0–2 5–9
10–14
3–4
15–19 20–24 25–34 35–44 45–64 65+ Age group (years)
0–2 5–9
10–14
3–4
15–19 20–24 25–34 35–44 45–64 65+ Age group (years)
0–2 5–9
10–14
3–4
15–19 20–24 25–34 35–44 45–64
65+
Age group (years)
% Population with high titre
0 5 10 15 20 25
% Population with high titre
0 5 10 15 20 25
% Population with high titre
0 20 40 60 80 100
% Population vaccinated
0 20 40 60 80 100
% Population vaccinated
0 20 40 60 80 100
% Population vaccinated
WcP
Italy
AcP
West Germany
AcP/Wc
Fig. 2. Age-specific distribution of PT high IgG titres and historical reported DTP3 coverage in three low coverage ESEN countries.%,>125 units/ml ; , 62.5–125 units/ml ;
sera allowed a process of statistical standardization into a common unitage. As outlined earlier, standard-ization was noted to be problematical for two part-ners (The Netherlands, Germany). This suggests that the levels of high titre presented in this paper may represent an underestimate of the true situation for these two countries and these results should be inter-preted cautiously [26]. Bearing in mind these caveats,
on interpreting the data in relation to other data sources, observed differences in the age-specific distri-bution of titres do seem to represent real epidemi-ological differences.
A high titre of anti-PT IgG antibody (>125 ESEN
units/ml) may be due to either recent infection and/or exposure to a specific vaccine. The standardized results from the clinical trials of a variety of acellular
Table 3. Post-vaccination PT IgG titres in ESEN units* for a variety of acellular and whole-cell vaccines and
estimated proportion of vaccines with PT IgG titres>125 ESEN units(adapted from Miller et al., Bell et al. [24, 28–30]).
Type of
vaccine Manufacturer
Primary course Booster course
Age (mo.)
PT GMT after 4–6 weeks (estimated % >125 units)
PT GMT after 12–18 mo. (estimated % >125 units)
Age (yr)
PT GMT after 4–6 weeks (estimated % >125 units)
Whole cell Wellcome 2, 3, 4 0.8 (0.9 %) [28] 0.3 (0 %) [28]
Whole cell Pasteur-Merieux 2, 3, 4 35.4 (26.1 %) [29] —
Whole cell Wellcome 3, 5, 9 4–5 5.1 (1 %) [30]
Acellular Pasteur-Me´rieux (now Aventis-Pasteur)
2, 3, 4 33.9 (11 %) [28] 2.1 (0.3 %) [28] 4–5 28.1 (10.3 %) [24] Acellular Connaught 2, 3, 4 25.0 (1.8 %) [28] 0.7 (0 %) [28]
Acellular Lederle 3, 5, 9 3.9 (1.7 %) [28] 0.2 (1.6 %) [28]
Acellular SmithKline Beecham 2, 3, 4 4–5 20.9 (8.8 %) [24]
Acellular Chiron Biocine 2, 3, 4 4–5 83.8 (36.7 %) [24]
Acellular Wyeth-Lederle 2, 3, 4 4–5 11.1 (4.3 %) [24]
* All assay results measured in arbitrary units by the Centre for Applied Microbiology and Research (CAMR). These were converted to ESEN units.
Table 2. Vaccination programme performance, inter-epidemic period by decade and % of reported cases>10 years
of age in six ESEN countries
Group 1 : High-coverage countries Group 2 : Low-coverage countries
Finland France
East Germany
The Netherlands
England & Wales
West
Germany Italy Mean primary
DPT3* coverage by decade
1970–1979 n.a. n.a. y95 % 96 % 59 % n.a. 16 %
1980–1989 y99 % y85 % y95 % 97 % 62 % 0 % 22 %
1990–1999 99 % 95 % 85 % 97 % 92 % 85 % 53 %
Inter-epidemic period and % of cases >10 years old
1970–1979 >10 yr (n.a.) 4 yr (n.a.) 4 yr (n.a.) n.a. 4 yr (8 %) n.a. 4 yr (9 %) 1980–1989 7 yr (n.a.) 4 yr (n.a.)>10 yr (n.a.) n.a. 4 yr (8 %) n.a. 4 yr (6 %) 1990–1999 4–5 yr (59 %) 4 yr (n.a.) n.a. 4 yr (24 %) 5 yr (18 %) n.a. 4 yr (14 %) * Mean reported coverage of three doses of diphtheria-tetanus-pertussis (DPT) vaccine by 12–24 months of age.
and whole-cell vaccines showed that in all cases 12–18 months after the primary course (and in 3 out of 5 vaccines at the peak anti-PT antibody response by 4–6 weeks), the estimated proportion of vaccinees
with titres>125 units/ml was<2 %. Between 4 and 6
weeks after a booster dose of the whole-cell vaccine at 4–5 years of age, the estimated proportion of
vac-cinees with titres >125 units was 1 %, but much
higher for all four examined acellular vaccines. It seems probable that the proportion with titres above 125 units/ml will have declined to very low levels after 1–2 years. Several countries had a booster dose in the routine immunization programme in the second year of life at the time of the serosurvey, but none had a further booster dose for older age groups (the ado-lescent acellular booster in France only had an esti-mated coverage of only 3 %). Thus the observation of high-titre sera in age cohorts older than 2 years can be considered with high probability to indicate infection with pertussis in the previous 12 months. As demon-strated by de Melker, a significant proportion of these individuals will have had mild or asymptomatic infection compared to classical clinical symptoms of
pertussis [25]. For those under 2 years the situation is more complex, particularly in the case of those countries delivering acellular vaccines known to lead to high anti-PT titres (France, Germany, Italy). High-titre sera in these age groups could thus represent either recent infection or vaccination.
The observation that high-titre sera are more likely in older age groups in those countries with a history of high immunization coverage compared to low cover-age correlates with the cover-age distribution of clinical cases reported by the routine surveillance systems. This suggests that a more sensitive surveillance system due to improved diagnostic tools does not provide the sole explanation for the recent observed increase in reported pertussis cases in adolescents and adults in highly vaccinated populations. Rather this represents a real epidemiological observation, reflecting partly a reduction in transmission due to increasing vaccine coverage of age cohorts and partly waning immunity. Indeed, the finding of widespread circulation of pertussis in the various populations has several ex-planations. One is a failure to achieve adequate levels of coverage with the primary schedule, while others are primary vaccine failure (PVF) and secondary vaccine failure (SVF).
Role of low coverage
Italy and Germany had the highest proportion in the 0–2 years age group with high-titre sera compared to the other countries. Both countries had just intro-duced acellular vaccines into their routine program-mes, some of which produce a high anti-PT titre complicating the seroprofile interpretation. It is thus impossible to disentangle the proportion of high-titre sera due to recent infection and the proportion due to recent vaccination in this age group. However, older children were more likely to have high-titre sera compared to adolescents, which corresponds to the observed age distribution of cases in low-coverage countries. This suggests that the priority in these countries should be to strengthen delivery of the pri-mary vaccination programme, rather than introduce additional booster doses.
Role of PVF
Ongoing circulation in highly vaccinated populations can occur due to vaccine failure – which may be pri-mary or secondary. PVF represents a failure of initial seroconversion. Factors of relevance for pertussis vaccine PVF include the type of vaccine, the number 0
0 1 2
10–14 15–19
3–9
20–24 25–34 35–44 45–64 65+ 5
10 15 20 25
Age group (years)
0 1 2
10–14 15–19
3–9
20–24 25–34 35–44 45–64 65+ Age group (years)
Proportion of population
>125 units/ml
0 5 10 15 20 25
Proportion of population
>125 units/ml
Netherlands France East Germany Finland
England West Germany Italy
(a)
(b)
Fig. 3.Age-specific distribution of PT IgG high titres (>125 ESEN units) in (a) four high-coverage and (b) three low-coverage ESEN countries.
of doses (with three doses more immunogenic than two) and age at vaccination [35]. It is possible to
compare the impact of accelerated and
non-accelerated programmes. Both Finland and The Netherlands had achieved very high historical vacci-nation coverage levels with a non-accelerated whole-cell primary vaccine programme and a booster dose
for<2-year-olds. Both had the lowest observed
pro-portion of high-titre sera in <2-year-olds compared
to other countries. The protection imparted by the non-accelerated programme in The Netherlands is difficult to evaluate, as an epidemic occurred after the serosurvey was completed, however, the serosurvey was conducted in Finland following an epidemic year and minimal high-titre sera were evident in those
<2 years of age. Two counties had an accelerated
programme (United Kingdom, France). In France, high-titre sera were observed in infants, however as outlined a proportion may be vaccine-induced. In the United Kingdom, although the serosurvey took place after a prolonged non-epidemic period, high-titre sera (2 %) were observed in those 1–2 years of age, with no data available for those under 12 months old. This suggests that an accelerated programme may be less effective than a non-accelerated programme (due perhaps to a higher PVF rate). Comparisons of the impact of accelerated and non-accelerated primary schedules need to be further explored.
Role of SVF
SVF represents waning immunity after initial docu-mented seroconversion and could explain the recent observations of a resurgence of pertussis in the highly vaccinated populations of The Netherlands and Finland. Indeed our study confirms published evi-dence that vaccinated persons become increasingly susceptible to infection 5–10 years following vacci-nation [17, 36]. In Finland there has been high vaccine coverage with whole-cell vaccine for over 20 years, with a large reduction in reported incidence, and decreased opportunity for natural boosting. Our study demonstrates that a large proportion of teen-agers and adults in Finland were recently infected with pertussis ; an observation matched by the clinical surveillance system. Similar observations were also seen in France and East Germany – other countries that have had high pertussis vaccine coverage for several decades.
In the highly vaccinated Netherlands, although the majority of high-titre sera occurred in those older
than 10 years of age, the extent of observed circu-lation of pertussis in the popucircu-lation was considerably less than in Finland. The observed high-titre sero-profile represents the circulation of pertussis in only the previous 12 months, rather than the susceptibility of the population. The population immunity was presumably low, as a large pertussis outbreak did occur in The Netherlands in the months after the serosurvey was completed, with high attack rates particularly in infants [2]. One explanation proposed for the outbreak was the emergence of antigenic changes in circulating strains [2, 3], such that protec-tion induced by the Dutch whole-cell vaccine was reduced. Alternatively, anti-PT antibody levels have recently been shown to correlate with partial protec-tion against clinically typical pertussis infecprotec-tion [37, 38]. Indeed, the serosurvey demonstrates that the
highest proportion of those <2 years of age
sero-negative for anti-PT amongst all countries was in The Netherlands, suggesting reduced protection against clinically typical infection in the Dutch population. Variation in vaccine effectiveness for locally produced vaccines (particularly whole-cell vaccine) has been reported [39–41].
The present study also provides evidence of waning protection after natural infection, as all countries showed evidence of recent infection in those older than 40 years of age ; a group most likely to have acquired natural immunity during childhood. This observation agrees with previous studies in non-vaccinated populations, suggesting that adults can be susceptible to symptomatic re-infection approxi-mately 20 years after the first pertussis episode [13].
Burden of infection and role in transmission
We are unable to determine the clinical severity of these infections in this study. From a disease burden perspective, recent studies find that the majority of cases of adult infection result in mildly symptomatic disease [25]. However, infection in adults has been suggested to be of relevance in terms of transmission to younger age groups [42], particularly in areas with high vaccine coverage [21]. We were unable to esti-mate from this study the contribution of older in-dividuals with high titre to disease transmission. However, we did find that although all high-coverage countries had evidence of adult and adolescent infec-tion, in only one country (France) was a high pro-portion of high-titre sera found in infancy (and a large proportion of this may be due to the immunogenic
vaccine). Further comparative work, for example with hospitalization data, needs to be undertaken to better describe the burden of disease in infancy over time and the role of adults and adolescents in disease transmission.
Recent programmatic changes
Due to concerns about the reappearance of pertussis, programme changes have been implemented in many of the countries since the serosurveys were completed. To provide direct protection to infants at a younger age and narrow the window of risk, The Netherlands (in addition to France and the United Kingdom) introduced an accelerated schedule in 1999. In an at-tempt to tackle the perceived role of older children and adolescents in transmission of pertussis to younger age groups, several countries have introduced acellular booster doses for older age groups : four at pre-school age (Finland, Italy, The Netherlands, United Kingdom) and in adolescents in Germany. The methodology used in this paper will be a useful tool to compare the impact of these alternative vaccination strategies on pertussis circulation in the population.
In conclusion, this study demonstrates a novel approach to explore the epidemiology of pertussis infection and to evaluate the impact of a variety of interventions. The study found evidence of significant circulation of pertussis in all age groups in a wide selection of populations (from poorly to highly
vaccinated). There were large differences in the apparent effectiveness of national programmes with evidence of more circulation in older age groups in highly vaccinated populations. Programme effective-ness in higher coverage countries seems to be depen-dent on several factors including type of vaccine used, age of first vaccination and the presence of booster doses. It is unclear what will be the impact of the introduction of booster doses in older groups on transmission to younger at-risk age groups. These interventions will need to be evaluated closely and compared carefully with strategies that attempt to provide direct protection to the highest risk popu-lation – the young infant.
A C K N O W L E D G E M E N T S
The authors acknowledge the following individuals who kindly provided technical assistance : Finland : Kaija Vuontela, Pa¨ivi Paalanen. Germany : Ingrid Deitemeier, Ingrid Mrasek, and Veronika Wagner. Italy : Susanna Taormina. The Netherlands : Bert Elvers, Hans Boshuis. United Kingdom : Cerys Jones. France : Christine Blondeau and Pierre Saliou from Aventis-Pasteur who provided technical support free of charge consisting of titrations of the reference panel and the French bank of serum in a completely blinded manner. The ESEN project was funded by a grant from DG X11 of the European Union under project no. PL95-1039.
A P P E N D I X . Number of sera tested per country, year of testing and % of sera>125 units
Age (years)
Finland 1996
France 1998
West Germany 1995
East Germany 1995
Italy 1996
The Netherlands 1995
England & Wales 1996 No.
of sera
% >125 units
No. of sera
% >125 units
No. of sera
% >125 units
No. of sera
% >125 units
No. of sera
% >125 units
No. of sera
% >125 units
No. of sera
% >125 units
<1 100 0 70 4.3 45 13.3 50 4 78 11.5 202 0.5 0 —
<2 100 0 86 1.2 56 21 50 10 89 19.1 192 0 90 2.2
<3 81 1.2 88 8 58 8.6 31 0 89 10.1 158 0 87 2.3
3–9 674 2.4 600 1.3 587 4.8 111 2.7 628 8.8 921 0.9 682 3.2
10–14 497 6.4 386 6.5 396 2.5 103 2.9 476 6.5 578 2.4 449 2.7
15–19 471 7.9 469 3.4 428 3.5 69 10.1 509 5.1 453 0.9 155 2.6
20–24 200 4 265 4.2 201 5 42 4.8 243 3.7 339 1.2 27 0
25–34 400 3.3 403 1.7 380 2.9 42 0 367 1.1 810 1.2 239 0.4
35–44 352 2 312 1.6 286 2.4 19 0 302 0.7 981 0.5 360 0.6
45–64 388 3.3 494 1 346 0.3 17 0 399 0.5 2009 0.8 358 0.3
R E F E R E N C E S
1. Guris D, Strebel P, Bardenheier B, et al. Changing epi-demiology of pertussis in the United States : increased reported incidence among adolescents and adults, 1990–1996. Clin Infect Dis 1999 ;28: 1230–1237. 2. De Melker HE, Schellekens JF, Neppelenbroek SE,
Mooi FR, Rumk HC, Conyn-van Spaendonck MA. Re-emergence of pertussis in the highly vaccinated population of the Netherlands : observations on sur-veillance data. Emerg Infec Dis 2000 ;6: 348–357. 3. Mooi FR, He Q, van Oirschot H, Mertsola J. Variation
in the Bordetella pertussis virulence factors pertussis toxin and pertactin in vaccine strains and clinical iso-lates in Finland. Infect Immun 1999 ;67: 3133–3134. 4. Mink CAM, Sirota NM, Nugent S. Outbreak of
per-tussis in a fully immunised adolescent and adult popu-lation. Clin Infect Dis 1992 ;14: 464–471.
5. Baron S, N’jamkepo E, Grimpel E, et al. Epidemiology in French hospitals in 1993 and 1994 : 30 years after routine use of vaccination. Paediatr Infect Dis J 1998 ; 17: 412–418.
6. Skowronski DM, De Serres G, MacDonald H, et al. The changing age and seasonal profile of pertussis in Canada. J Infect Dis 2002 ;185: 1696.
7. Fine PEM, Clarkson JA. Distribution of immunity to pertussis in the population of England and Wales. J Hyg Camb 1984 ;92: 21–26.
8. Gangarosa EJ, Galazka AM, Wolfe CR, et al. Impact of anti-vaccine movements on pertussis control : the untold story. Lancet 1998 ;351: 356–361.
9. Galazka A. Update on acellular pertussis vaccine. Document WHO/EPI/GEN/88.4. Geneva : World Health Organisation, 1988.
10. Le´vy-Bruhl D, Pebody R, Veldhuijzen I, Valenciano M, Osborne K. European Sero-Epidemiological Network : a comparison of vaccination programmes – Part two : pertussis. Eurosurveillance 1998 ;3: 107–110.
11. Therre H, Baron S. Pertussis immunisation in Europe – the situation in late 1999. Eurosurveillance 2000 ;5: 6–10.
12. Rota MC, Ausiello CM, D’Amelio R, et al. Prevalence of markers of exposure to Bordetella pertussis amongst Italian young adults. Clin Infect Dis 1998 ;26: 297–302. 13. Wirsing von Konig CH, Postels-Multani S, Bock HL, Schmitt HJ. Pertussis in adults : frequency of trans-mission after household exposure. Lancet 1995 ; 346: 1326–1329.
14. Schmitt-Grohe S, Cherry J, Heininger U, Uberall MA, Pineda E, Stehr K. Pertussis in German adults. Clin Infect Dis 1995 ;21: 860–866.
15. Fine PEM, Clarkson JA. The recurrence of whooping cough : possible implications for assessment of vaccine efficacy. Lancet 1982 ; i : 666–669.
16. Rohani P, Earn D, Grenfell B. Impact of immunisation on pertussis transmission in England and Wales. Lancet 2000 ;355: 285–286.
17. Jenkinson D. Duration of effectiveness of pertussis vaccination : evidence from a 10 year community study. Br Med J 1988 ;296: 612–614.
18. Gan VN, Murphy TV. Pertussis in hospitalised chil-dren. Am J Dis Child 1989 ;143: 1199–1202.
19. Nelson JD. The changing epidemiology of pertussis in young infants : the role of adults as reservoirs of infec-tion. Am J Dis Child 1978 ;132: 371–373.
20. STIKO. Vaccination recommendations of the Standing Committee of the Robert Koch Institute, January 2000 [in German]. Epidemiol Bull 2000 ;2: 9–20.
21. Grimpel E, Baron S, Levy-Bruhl D, et al. Influence of vaccination coverage on pertussis transmission in France. Lancet 1999 ;354: 1699–1700.
22. Smith C, Vyas H. Pertussis is increasing in un-immunised infants : is a change of policy needed ? Arch Dis Child 1999 ;81: 460.
23. Decker MD, Edwards KM. Acellular pertussis vaccines. Paediatr Clin North Am 2000 ;47: 309–335. 24. Miller E, Waight P, Laurichesse H, et al.
Immuno-genicity and reactoImmuno-genicity of acellular diphtheria/ tetanus/pertussis vaccines given as a pre-school booster ; effect of simultaneous administration of MMR. Vaccine 2001 ;19: 3904–3911.
25. de Melker H, Versteegh FGA, Conyn van Spandonck MAE, et al. Specificity and sensitivity of high levels of immunoglobulin G antibodies against pertussis toxin in a single serum sample for diagnosis of infection with Bordetella pertussis. J Clin Microbiol 2000 ; 38: 800– 806.
26. Giammanco A, Maple PAC, Andrews N, et al. European Sero-Epidemiology Network : standardis-ation of the assay results for pertussis. Vaccine 2003 ; 22: 112–120.
27. Edmunds WJ, Pebody RG, Aggerback H, et al. The sero-epidemiology of diphtheria in Western Europe. Epidemiol Infect 2000 ;125: 113–125.
28. Miller E, Ashworth L, Redhead K, Thornton C, Waight P, Colemans D. Effect of schedule on re-actogenicity and antibody persistence of acellular and whole cell pertussis vaccines : value of laboratory tests as predictors of clinical performance. Vaccine 1997 ;15: 51–60.
29. Bell F, Martin A, Blondeau C, Thornton C, Chaplais J, Finn A. Combined diphtheria, tetanus, pertussis, and Haemophilus influenzae type b vaccines for primary immunisation. Arch Dis Child 1996 ;75: 298–303. 30. Miller E, Rush M, Ashworth L, et al. Antibody
re-sponses and reactions to the whole cell pertussis com-ponent of a combined diphtheria/tetanus/pertussis vaccine given at school entry. Vaccine 1995 ; 13: 1183–1186.
31. Doll R, Smith PG. Comparison between cancer re-gistries : age-standardised rates. In : Waterhose J, Shanmugaratnum K, Muir C, eds. Cancer incidence in five continents, vol. IV, Scientific Publications no. 42. Lyon : International Agency for Research on Cancer, chapter 11, 1982.
32. Windorfer A, Strutz R, Misera B. Childhood disease and vaccination [in German]. Der kinderarzt 1994 ;25: 275–280.
33. Salmaso S, Rota MC, Ciofi degli Atti ML, Tozzi AE, Kreidl P and the ICONA Study Group. Simultaneous
EPI cluster surveys to estimate regional infant immu-nisation coverage in Italy. WHO Bulletin 1999 ; 77: 843–885.
34. Osborne K, Weinberg J, Miller E. The European sero-epidemiological network. Eurosurveillance 1997 ; 2: 29–31.
35. Wilkins J, Chan L, Wehrle P. Age and dose interval as factors in agglutinin formation to pertussis vaccine. Vaccine 1987 ;5: 49–54.
36. Ramsay ME, Farrington CP, Miller E. Age-specific efficacy of pertussis vaccine during epidemic and non-epidemic periods. Epidemiol Infect 1993 ;11: 41–48. 37. Storsaeter J, Hallander H, Gustafsson L, Olin P. Levels
of anti-pertussis antibodies related to protection after household exposure to Bordetella pertussis. Vaccine 1998 ;16: 1907–1916.
38. Olin P, Hallander HO, Gustafsson L, Reizenstein E, Storsaeter J. How to make sense of pertussis
immunogenicity data. Clin Infect Dis 2001 ;33 (Suppl 4) : S288–S291.
39. Halperin SA, Bortolussi R, MacLean D, Chisholm N. Persistence of pertussis in an immunised population : results of Nova Scotia enhanced pertussis surveillance program. J Paediatr 1989 ;115: 686–693.
40. Strebel P, Hussey G, Metcalf C, Smith D, Hanslo D, Simpson J. An outbreak of whooping cough in a highly vaccinated urban community. J Trop Paediatr 1991 ; 37: 71–76.
41. Olin P, Rasmussen F, Gustafsen L, Hallander H, Heijbel H. Randomised controlled trial of two-com-ponent, three-comtwo-com-ponent, and five-component acellular pertussis vaccines compared with whole cell pertussis vaccine. Lancet 1998 ;350: 1564–1565.
42. Crowcroft NS, Booy R, Harrison T, et al. Severe and unrecognised : pertussis in UK infants. Arch Dis Child 2003 ;88: 802–806.