Table of Contents
1. EXECUTIVE SUMMARY ... 3
2. BACKGROUND ... 6
3. HEALTHCARE INDUSTRIAL AND OCCUPATIONAL OVERVIEW ... 8
3.1.HEALTHCARE INDUSTRY PROFILE... 8
3.1.1. Historical Trends ... 8
3.1.2. Healthcare Industry Mix ... 9
3.1.3. Occupational Mix in Healthcare ... 11
3.2.PROJECTED GROWTH OF HEALTHCARE EMPLOYMENT ... 12
3.2.1. Healthcare Industry Employment Projection ... 12
3.2.2. Healthcare Occupational Projection ... 13
4. ANALYSIS OF NURSE DEMAND AND SUPPLY ... 14
4.1.DETAILED ANALYSIS OF RNDEMAND ... 14
4.1.1. Demand for RN by Industry ... 14
4.1.2. RN Demand by Degree Award ... 14
4.2.TRAINING ALIGNMENT OF REGISTERED NURSES ... 15
4.2.1. Degree Awards in Registered Nursing ... 16
4.2.2 Training Concentration for Nurses ... 17
4.3.IMPLICATION FOR TRAINING PROVIDERS... 18
5. OTHER NURSING TRAINING ISSUES ... 20
5.1.CLINICAL ROTATION ... 20
5.2.REGIONAL SIMULATION EDUCATION CENTERS ... 20
1. Executive Summary
The primary region for analysis in this report, the Hampton Roads study area,1 covers the localities serviced by the Hampton Roads (area 16) and Virginia Peninsula (area 14) Workforce Investment Boards (WIBs). This report primarily examines the current and future demand for nurses in the area. The key points are summarized below:
x The healthcare industry has experienced faster growth than other industries in the region.
o The broad healthcare industry in this study is defined as industries with a two-digit North American Industrial Classification System (NAICS) code of 62—healthcare and social assistance.
o From 2002 through the first quarter of 2014, overall employment in the Hampton Roads study area averaged 0.1% annualized employment growth.
o The healthcare industry expanded at a much faster rate of 2.7% per year for the same period.
o Average wages in the healthcare industry are higher than the regional average but with large disparities. This sector employs both highly-paid physicians and low-paying home healthcare workers.
x The region’s healthcare infrastructure is well-balanced, and provides a variety of healthcare services to regional residents.2
o In 2014, more than one in every four healthcare workers in the region worked in regional hospitals.
o The two largest occupation groups in the healthcare industry are 1. healthcare practitioners and technical occupations (SOC 29-0000) and 2. healthcare support occupations (SOC 31-0000).
o The sector also utilizes other occupations such as business management and office support workers.
x The healthcare industry and employment in healthcare-related occupations in the Hampton Roads study area are both projected to continue growing.
o Over the next ten years, overall employment in the region is expected to increase an average 0.6% per year.
o Healthcare sector employment is projected to grow much faster, at 2.1% per year.
o The largest number of new jobs is expected in the individual and family services and home healthcare services sub-industries. Employment in two industries—vocational rehabilitation
1 Please see Section 2.3 for a list of cities and counties included in the Hampton Roads study area.
2 Veterans or military based health care providers, such as Naval Medical Center Portsmouth, and Hampton Road Veterans Affairs (VA) Hospital are included in this analysis, such as occupation demand and occupation gaps.
services and psychiatric and substance abuse hospitals—is projected to decline modestly over the next 10 years.
o The top two occupations with the highest demand are both nursing professions. The largest demand—at 436 per year—is for registered nurses (RN); this is followed by licensed practical or vocational nurses (LPN) at 159 per year.
x Analysis of RN demand points to a trend of upskilling in the profession.
o Based on staffing patterns, it is projected that more than half of the demand for registered nurses (i.e., more than 200 per year) will come from regional hospitals. Offices of physicians, home healthcare services, and nursing care facilities will need dozens of registered nurses each year.
o Top healthcare employers in the region are Sentara Healthcare, Riverside Health System, Naval Medical Center Portsmouth, Bon Secours Hampton Roads Health System, Chesapeake Regional Medical Center, Children’s Hospital of the King’s Daughters, Eastern Virginia Medical School and
Hampton Veteran’s Affairs Medical Center.
o The majority of registered nurses have one of two types of degrees: Associate of Science in Nursing (ASN) and Bachelor of Science in Nursing (BSN). Based on the current educational attainment of nurses and annual demand of 436 for registered nurses, the demand for nurses with BSN degrees was estimated to be 201, while demand for nurses with ASN degrees was estimated to be 189.
o In the past, an associate degree was the primary qualification for an RN, but more hospitals are leaning toward hiring only RNs with BSN degrees. This trend is evident in the Hampton Roads study area, and will generate demand for “RN to BSN” programs.
x The region has sufficient training capacity for registered nurses.
o In the 2011-12 academic year, there were 12 institutions in the Hampton Roads study area that offered training programs in registered nursing. Those institutions awarded 652 associate’s
degrees or non-degree certificates, 362 four-year degrees, and 92 graduate degrees in nursing.
o Based on training concentration,3 there appears to be no shortage of training capacity for RNs overall (117% training concentration). However, using current staffing ratios, the adequacy of training capacity differs by RN education level with an apparent surplus of ASN, some surplus of BSN, which is of less concern due to upskilling trend in RN profession, and a shortage of post-graduate RN training.
3 Training concentration is defined as the ratio of the regional postsecondary award per employment for an occupation with respect to the national rate of postsecondary awards per employment. For example, if a region’s training concentration for a given occupation is 100%, it is producing awards at the same rate as the nation for that occupation; if a region’s training
o The study area has a particularly high output of awards for licensed practical and licensed vocational nurses at close to three times higher than the national average.
o Considering the upskilling trend in the profession, the area has a training shortage in nurse practitioners.
x Focus groups participants expressed concerns about other issues.
o Clinical training is a critical part of an RN’s education, providing hands-on opportunities in a real-world setting. Existing clinical capacity in the region may be sufficient for the current number of nursing students. However, if the number of students in BSN programs expands in the future to keep up with expected increased demand, there may not be enough clinical spaces available in the region.
o The use of simulators may help alleviate the potential clinical training capacity shortage. Using simulation to supplement clinical experience may help local nursing programs increase enrollment and help the region keep up with projected increased demand for RNs with BSN degrees. Nursing leaders, state medical schools, and other interested parties may need to consider lobbying the Virginia Board of Nursing to expand the amount of patient care hours permitted in simulations. x The following recommendations or planned actions were made for regional training providers to
better align with the changing demand for RNs.
o The unmistaken trend of upskilling in nursing professions points to several opportunities for regional healthcare training providers, especially four-year institutions. Opportunities include starting training programs—such as RN to BSN—as they become popular for existing RNs with an
associate’s degree who desire to stay in the hospital setting while obtaining a bachelors’ degree. o There is significant demand at area four-year institutions for nurse practitioner programs, yet there
are currently limited offerings of such programs in the region.
o Two-year institutions will face challenges because demand growth for RNs with associate’s
degrees or LPNs may slow in the future. These institutions could partner with four-year institutions to start 2+2 types of programs for BSN degrees. Two-year institutions can also partner with nursing care and home care providers to upskill their LPNs for RNs with ASN degrees, starting “LPN to RN”
2. Background
In 2014, Chmura Economics & Analytics (Chmura) completed a workforce study for the Hampton Roads area of Virginia, which analyzed overall workforce trends and key issues.4 In addition to that report, an in-depth analysis of registered nurses (RNs) was requested. Recent trends indicate a strong demand for upskilling within the nursing profession, which could have significant implications for regional training providers. For this reason, Opportunity, Inc. of Hampton Roads is seeking to identify the future occupational demand for RN occupations in order to discuss important training issues such as clinical rotation and simulation practices.
The information in this report can be used to support strategic decisions and tactical efforts ensuring that the
region’s healthcare industry and training providers are prepared for upcoming changes in this profession. In addition, existing and future workers in RN occupations can obtain necessary skills for career success. As such, individuals who can benefit from this information include job seekers, economic development practitioners, career counselors, curriculum designers, human resource managers, trainers, and educators.
This study utilizes long-term projections (10-year forecasts) as the basis for determining the trends, gaps, and supply and demand dynamics for RN occupations. More specifically, it identifies:
x Regional demand for RNs in general, and those with bachelor’s degrees (BSN) in particular x Regional capacity to train BSNs and how that capacity compares to demand
x Major healthcare providers and their plans to address trends in RN demand x Demand and capacity for clinical rotations for healthcare workers and nurses
x Extent of simulation use in clinical training, and demand for a simulation center in the region
The primary region for analysis in this study is similar to the geographic region of the Virginia Beach-Norfolk-Newport News, Virginia-North Carolina metropolitan statistical area (MSA). For this study, however, Chmura omitted the North Carolina county of Currituck and Virginia’s Mathews County. Per the request of Opportunity Inc.,
Chmura included Southampton County. The resulting localities represent the Hampton Roads (area 16) and Virginia Peninsula (area 14) WIBs. The combined region, which is made up of the following localities, is referred to as the Hampton Roads study area:
x Gloucester County x Isle of Wight County x James City County x Southampton County x Surry County x York County x City of Chesapeake x City of Franklin x City of Hampton x City of Newport News x City of Norfolk x City of Poquoson
4Please see the full study for a discussion of broad workforce trends in the region: “Workforce and Occupational Demand Trends-Hampton Roads Study Area,” prepared for Opportunity Inc., by Chmura Economics & Analytics, September 2014.
x City of Portsmouth x City of Suffolk x City of Virginia Beach x City of Williamsburg
Chmura used both secondary and primary data to address the above issues. Employment and wage data for the healthcare industry used in this report were derived from JobsEQ®,5Chmura’s proprietary database and economic analysis system. These employment and wage data are primarily based upon the Quarterly Census of Employment and Wages (QCEW) from the Bureau of Labor Statistics (BLS). Where necessary, data were imputed by the JobsEQ technology platform. Occupation data were crossed over from industry data using the JobsEQ
industry/occupation crosswalk, a variation on the national industry/occupation crosswalk from BLS. Occupation and employment figures are based upon a four-quarter moving average as of the latest industry data (2014 quarter 1). Wage data are from the Occupation Employment Statistics program and are current as of 2013.
Training programs related to nursing occupations are classified according to the Classification of Instructional Programs (CIP codes). Data on current completion and awards are from the National Center for Education Statistics. While this is helpful for estimating occupation production from training program awards data, the crosswalk is neither perfect nor comprehensive.
For primary data collection, Chmura participated in a Hampton Roads Healthcare Workforce focus group held on April 24, 2014. This focus group was attended by major healthcare providers. Information gathered from this focus group supplement the secondary data and is the main information source regarding clinical rotation and training simulation issues.
5 JobsEQ® is Copyright© 2014, Chmura Economics & Analytics. All Rights Reserved. JobsEQ is protected by U.S. Patent 7,480,659.
3. Healthcare Industrial and Occupational Overview
This section provides details on the healthcare sector and key occupations in the Hampton Roads study area. The broad healthcare sector is defined as industries with a two-digit North American Industrial Classification System (NAICS) code of 62—healthcare and social assistance.
3.1. Healthcare Industry Profile
3.1.1. Historical Trends
In the first quarter of 2014, the healthcare sector in the Hampton Roads study area employed a total of 98,400 workers (four-quarter average), accounting for 13.7% of the overall regional workforce. In terms of employment, this is the second-largest industry sector, after professional and business services. Compared with total employment, the healthcare sector in the Hampton Roads study area has enjoyed sustained growth, despite the severe recession of 2007-2009. Over the past twelve years (from the first quarter of 2002 to the first quarter of 2014), employment in the regional healthcare sector expanded 2.7% per year—a sharp contrast with the tepid 0.1% annualized employment growth for overall employment in the region (Figure 3.1).
This pattern is consistent with the national trend of the healthcare sector, which was the only industry that continued to expand during the recession. The growing elderly population coupled with the aging of retiring baby boomers ensured sustained demand for healthcare services even during the recession. As the regional and
national economies climbed out of the recession, the federal government instituted drastic budget cuts in 2011, with half of those budget cuts in defense.6 With the implementation of the Affordable Care Act in 2014, however, many previously uninsured individuals have gained health insurance. This development is expected to boost demand for
6 Please see “Assessing the Impact of Federal Budget Cuts on the Virginia Economy,” prepared by George Mason University and Chmura Economics & Analytics, October 2012.
60.0 70.0 80.0 90.0 100.0 110.0 120.0 130.0 140.0 150.0
2002 2003 2004 2005 2006 2007 2008 2009 2010 2011 2012 2013 2014
Figure 3.1: Employment in Heathcare Sector, Four-Quarter Moving Average,
2002Q1=100
Recession HealthCare Regional Overall
Note: Shaded area represents recession Source: JobsEQ
healthcare services in the region. As a result, healthcare sector employment will continue to outperform the regional average in the near future.
As of the first quarter of 2014, the average annual salary per worker in the Hampton Roads study area healthcare sector was $45,085, higher than the regional average of $43,036. Annual average wages per worker in the regional healthcare sector have grown fairly steadily from 2002 to the first quarter of 2014, though the pace slowed
somewhat during and after the past recession (Figure 3.2). Over the twelve years ending with the first quarter of 2014, annual average wages grew 2.8% in the healthcare sector, close to the regional average of 3.0% during the same period. Despite the fact that employment in this industry grew much faster than employment in other
industries in the region, wage growth has not increased at the same pace. A possible explanation is that, within the healthcare industry, low-skilled occupations have been expanding faster than high-skilled occupations helping to bring down overall wage growth. For example, over the past five years, employment growth in lowering paying healthcare support occupations (SOC 31-0000) averaged 2.1% per year, versus 1.5% annual growth for higher paying healthcare practitioners and technicians occupations (SOC 29-0000).
3.1.2. Healthcare Industry Mix
This section examines the various healthcare sector sub-industries in the Hampton Roads study area, based on four-digit NAICS codes. Healthcare is the second-largest sector in the region. The composition of the healthcare industry in the study area is similar to that of the state and nation as a whole, indicating that the regional healthcare infrastructure can meet the needs of its residents. Overall, the healthcare industry is fairly balanced, considering that different types of healthcare services are well-represented in the region.
In the healthcare sector, 26% of jobs (25,500) were in hospitals (for the year ending in the second quarter of 2014). This was followed by those working in the offices of physicians (15,500), and individual and family services (9,400). While overall wages in the sector were slightly higher than the regional average, wages at the four-digit NAICS level vary greatly. The highest average wages were for offices of physicians ($82,500 for the year ending in the second quarter of 2014). In contrast, average wages for child day care services was $16,700 per year. Other industries such as home healthcare services and vocational rehabilitation services have annual wages slightly over $20,000 per year.
$20,000 $25,000 $30,000 $35,000 $40,000 $45,000 $50,000
2002 2003 2004 2005 2006 2007 2008 2009 2010 2011 2012 2013 2014
Figure 3.2: Average Annual Average Wage Per Worker
Recession Healthcare Regional Overall
Note: Shaded area represents recession Source: JobsEQ
Table 3.1: Employment Mix by Sector, Year Ending First Quarter 2014 Employment Average Annual
Wages Percentage of Employment Hampton Roads
Study Area
Hampton Roads Study Area
Hampton Roads
Study Area VA USA
Offices of Physicians 15,500 $82,500 15.7% 14.3% 12.7%
Offices of Dentists 5,100 $51,400 5.2% 5.1% 4.5%
Offices of Other Health Practitioners 4,200 $41,300 4.2% 4.1% 3.9%
Outpatient Care Centers 3,500 $45,800 3.5% 3.5% 3.8%
Medical and Diagnostic Laboratories 1,100 $40,100 1.1% 1.7% 1.2%
Home Health Care Services 6,900 $20,800 7.0% 5.7% 6.4%
Other Ambulatory Health Care Services 2,300 $45,900 2.3% 1.6% 1.5%
General Medical and Surgical Hospitals 25,500 $49,300 25.9% 25.4% 28.5%
Psychiatric and Substance Abuse Hospitals 1,000 $40,500 1.0% 1.0% 1.2%
Specialty (except Psychiatric & Substance Abuse) Hospitals 400 $53,700 0.4% 0.5% 1.2%
Nursing Care Facilities (Skilled Nursing Facilities) 7,200 $30,600 7.3% 7.3% 8.8%
Residential Intellectual and Developmental Disability,
Mental Health, and Substance Abuse Facilities 3,400 $25,900 3.4% 3.3% 3.6%
Continuing Care Retirement Communities and Assisted
Living Facilities for the Elderly 5,100 $23,300 5.2% 6.0% 4.3%
Other Residential Care Facilities 600 $24,700 0.7% 1.0% 0.9%
Individual and Family Services 9,400 $28,400 9.6% 11.6% 10.8%
Community Food and Housing, and Emergency and Other
Relief Services 700 $33,900 0.7% 0.8% 0.8%
Vocational Rehabilitation Services 2,700 $21,700 2.8% 2.2% 1.8%
Child Day Care Services 4,100 $16,700 4.1% 4.9% 4.2%
Total 98,700 $45,400 100.0% 100.0% 100.0
% Note: Numbers may not sum due to rounding
Source: JobsEQ
Table 3.2 presents the top healthcare employers in the region and employment range. They are Sentara Healthcare, Riverside Health System, Naval Medical Center Portsmouth, Bon Secours Hampton Roads Health
System, Chesapeake Regional Medical Center, Children’s Health System (Children’s Hospital of the King’s
Daughters), Eastern Virginia Medical School and Hampton Veteran’s Affairs Medical Center (Table 3.2). Those top eight employers have over 40% of all healthcare workforce in the Hampton Roads Study Area.
Table 3.2: Top Healthcare Employers in Hampton Roads Study Area
Employers Employment
Sentara Healthcare 20,000
Riverside Health System 7,050
Naval Medical Center Portsmouth 5,400
Bon Secours Hampton Roads Health System 3,000
Chesapeake Regional Medical Center 2,400
Children's Health System (Children’s Hospital of the King’s Daughters) 1,900
Eastern Virginia Medical School 1,500
Hampton Veteran’s Affairs Medical Center 1,200
3.1.3. Occupational Mix in Healthcare
The mix of healthcare occupations in the Hampton Roads study area is listed in Table 3.2. Occupations are defined
according to the Standard Occupational Classification (SOC) with “major groups” corresponding to the first two
digits of the SOC code.
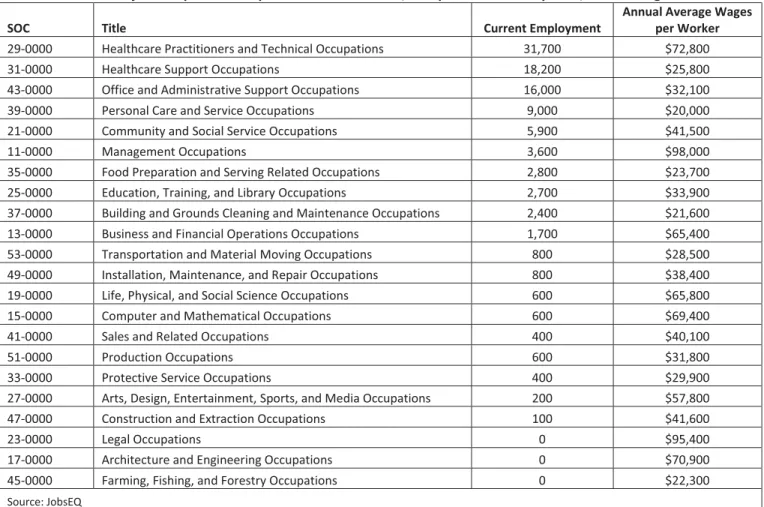
The healthcare industry employs a wide range of occupations. Not surprisingly, the two largest occupation groups are healthcare practitioners and technical occupations (31,700) and healthcare support occupations (18,200). These two occupation groups accounted for half of all workers in the healthcare sector. This sector also employed a large number of workers in office and administrative support, and personal care and service occupations. The healthcare sector also employed 3,600 management-related occupations, which were paid much higher wages than the industry average.
Table 3.3: Major Occupation Groups in Healthcare Sector, Hampton Roads Study Area, Year Ending 2014Q2
SOC Title Current Employment
Annual Average Wages per Worker
29-0000 Healthcare Practitioners and Technical Occupations 31,700 $72,800
31-0000 Healthcare Support Occupations 18,200 $25,800
43-0000 Office and Administrative Support Occupations 16,000 $32,100
39-0000 Personal Care and Service Occupations 9,000 $20,000
21-0000 Community and Social Service Occupations 5,900 $41,500
11-0000 Management Occupations 3,600 $98,000
35-0000 Food Preparation and Serving Related Occupations 2,800 $23,700
25-0000 Education, Training, and Library Occupations 2,700 $33,900
37-0000 Building and Grounds Cleaning and Maintenance Occupations 2,400 $21,600
13-0000 Business and Financial Operations Occupations 1,700 $65,400
53-0000 Transportation and Material Moving Occupations 800 $28,500
49-0000 Installation, Maintenance, and Repair Occupations 800 $38,400
19-0000 Life, Physical, and Social Science Occupations 600 $65,800
15-0000 Computer and Mathematical Occupations 600 $69,400
41-0000 Sales and Related Occupations 400 $40,100
51-0000 Production Occupations 600 $31,800
33-0000 Protective Service Occupations 400 $29,900
27-0000 Arts, Design, Entertainment, Sports, and Media Occupations 200 $57,800
47-0000 Construction and Extraction Occupations 100 $41,600
23-0000 Legal Occupations 0 $95,400
17-0000 Architecture and Engineering Occupations 0 $70,900
45-0000 Farming, Fishing, and Forestry Occupations 0 $22,300
3.2. Projected Growth of Healthcare Employment
3.2.1. Healthcare Industry Employment Projection
Overall, employment in the Hampton Roads study area is projected to expand 0.6% per year over the next ten years (2014Q2 to 2024Q2). Employment in the healthcare sector is projected to grow much faster, at 2.1% per year.7 The sector is expected to add a total of 23,358 jobs in the next 10 years. The largest number of new jobs will be added in individual and family services (+4,612 jobs), followed by home healthcare services (+3,876 jobs). These two industries employ a large number of basic skill workers who earn relatively low wages. Jobs in the study
area’s hospitals and offices of physicians are projected to increase by 1,847 and 3,499, respectively. While the overall healthcare sector is expected to experience robust growth, employment in two industries—vocational rehabilitation services and psychiatric and substance abuse hospitals—are projected to decline modestly over the next 10 years.
The above projection is not meant to be an exact prediction of future events, but rather a baseline scenario that offers a reasonable model for future employment changes in the healthcare industry. A variety of events may occur that would significantly alter future employment changes. For Virginia’s healthcare industry, one of the largest unknowns is related to the implementation of the Affordable Care Act. Virginia has not expanded Medicaid, even
7 These projections, as summarized in Figure 3.9, do not include replacement demand, but rather employment growth alone.
-85 -73 101 134 191 303 624 625 737 981 1,181 1,521 1,643 1,672 1,847 3,499 3,876 4,612
-1,000 0 1,000 2,000 3,000 4,000 5,000
Vocational Rehabilitation Services Psychiatric and Substance Abuse Hospitals Community Food and Housing, and Emergency and Other…
Other Residential Care Facilities Specialty (except Psychiatric and Substance Abuse)…
Medical and Diagnostic Laboratories Residential Intellectual and Developmental Disability,…
Other Ambulatory Health Care Services Child Day Care Services Nursing Care Facilities (Skilled Nursing Facilities) Offices of Dentists Continuing Care Retirement Communities and Assisted…
Offices of Other Health Practitioners Outpatient Care Centers General Medical and Surgical Hospitals Offices of Physicians Home Health Care Services Individual and Family Services
Figure 3.3: Ten-Year Projected Employment Growth in the Healthcare Sector 2014Q2-2024Q2
though Governor McAuliffe is pushing for this expansion to provide health insurance for 400,000 individuals.8 It is expected that the debate on Medicaid expansion will continue; and if it is expanded, demand for healthcare service in Virginia will rise significantly.
3.2.2. Healthcare Occupational Projection
Chmura examines the occupation projection for over 60 healthcare practitioner and technical occupations (those with SOC codes beginning with “29”). Figure 3.3 presents the top 20 most in-demand occupations. Demand is defined in terms of both growth demand and replacement demand—which is the replacement needs within an occupation due to retirements and workers moving from one occupation to another.9
The top two occupations with the highest demand are nursing. Registered nurses (RNs) have the largest annual demand with a need for 436 registered nurses per year—248 to replace nurses who retire or leave the profession, and 188 to meet the demand of industry growth. The demand for licensed practical or vocational nurses (LPNs) is expected to average 159 per year to accommodate for attrition and meet new growth. There is also strong demand for the highly-skilled and highly-paid occupation: physicians and surgeons, all other.
8 Source:
http://www.nytimes.com/2014/09/09/us/after-first-plan-is-blocked-virginia-governor-terry-mcauliffe-reduces-medicaid-expansion-goals.html?_r=0
9Replacement needs are calculated via “replacement rates” from the Bureau of Labor Statistics. Based on their methodologies, these rates understate total demand and should be taken as a minimum measure of training needs due to replacements.
0 100 200 300 400 500
Veterinary Technologists and Technicians Opticians, Dispensing Occupational Therapists Speech-Language Pathologists Physician Assistants Medical and Clinical Laboratory Technologists Family and General Practitioners Dentists, General Radiologic Technologists Nurse Practitioners Medical and Clinical Laboratory Technicians Medical Records and Health Information Technicians Pharmacy Technicians Pharmacists Physical Therapists Dental Hygienists Emergency Medical Technicians and Paramedics Physicians and Surgeons, All Other Licensed Practical and Licensed Vocational Nurses Registered Nurses
Figure 3.3: Annual Demand in Healthcare Occupations (2014-2024)
Replacement
Growth
4. Analysis of Nurse Demand and Supply
4.1. Detailed Analysis of RN Demand
In this section, Chmura specifically analyzes the demand for registered nurses. While section 3.2 presents the overall 10-year demand for nurses, this section provides further information on the demand for nurses from each industry, as well as demand for RNs with different degrees or certificates.
4.1.1. Demand for RN by Industry
Chmura uses the current industry staffing pattern of registered nurses to estimate demand for nurses from each industry. Hospitals will continue to have the largest demand for registered nurses. The current data indicate that 57% of the nurses in the Hampton Roads study area were employed in general medical and surgical hospitals. As a result, of the annual demand of 436 (Table 4.1), 249 nurses are expected to be hired to work in regional
hospitals. After that, offices of physicians, home healthcare services, and nursing care facilities will need dozens of registered nurses each year. Other industries hiring nurses include outpatient care centers and public schools.
Table 4.1: Registered Nurse Demand by Industry
Industry (Four-Digit NAICS) % in Industry Annual Demand (2014-2024)
General Medical and Surgical Hospitals 57.1% 249
Offices of Physicians 8.5% 37
Home Health Care Services 7.7% 34
Nursing Care Facilities 4.7% 20
Outpatient Care Centers 3.9% 17
All Other Industries 18.1% 79
Total 436
Source: JobsEQ
The above results were confirmed by participants of the Hampton Roads Healthcare Workforce focus group. For example, the region received a $5 million H1B grant for workforce training for the healthcare industry. During the focus group, Opportunity Inc. One-Stop Workforce Center reported that the top five employers for their program participants are all hospitals and physicians’ offices—Sentara Health System, Bon Secours Health System,
Children’s Hospital of the King’s Daughters, Southampton Memorial Hospital, and Bayview Physicians Group.
Similarly, the Peninsula Worklink One-Stop Career Center reported that the top five employers are: Riverside
Health System, Sentara Health System, Bon Secours Health System, Children’s Hospital of the King’s Daughters,
and Tidewater Physicians Multispecialty Group.
4.1.2. RN Demand by Degree Award
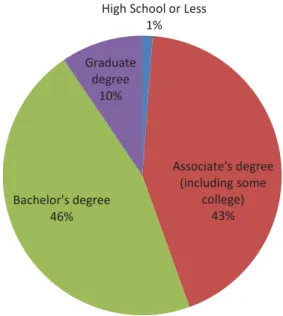
The majority of registered nurses have one of two types of degrees—Associate of Science in Nursing (ASN) or Bachelor of Science in Nursing (BSN). Chmura used the current degree profile of registered nurses in the region to estimate the demand for nurses with each degree. The current data indicate close to half (46%) of current RNs have bachelor’s degrees, 43% of registered nurses have associate’s degrees, and 10% have graduate degrees. As a result, of the annual demand of 436 for registered nurses, the demand for RNs with BSN degrees was estimated to be 201, while demand for RNs with ASN degrees was estimated to be 189.
In the past, an associate’s degree was the primary qualification of RNs. However, more RNs in the region now have
bachelor’s degrees, and this trend is expected to continue. Hospitals around the country are phasing out LPNs in
favor of registered nurses with a bachelor’s degree in nursing.10 Participants in the Hampton Roads Healthcare Workforce focus group confirmed that regional hospitals are moving in the same direction.11 One regional hospital has indicated that it will require all of its newly-hired RNs without BSN degrees to start a BSN program within two years of hire, and complete the program within five years. This is based on research that employing nurses with
bachelor’s degrees result in better patient outcomes. If this trend continues and is adopted by other hospitals, graduates from LPN programs or RNs with associate’s degrees will see their career options limited in regional hospitals. Yet, the demand for LPNs will still be robust, as healthcare providers such as nursing care facilities, assisted living facilities, or home healthcare services continue to grow in the region. Demand for nurses with graduate degrees (nurse practitioners) will also increase.
Implementation of the Affordable Care Act will create an influx of newly-insured patients, creating time constraints
to physicians’ schedules. This will present an opportunity for nurse practitioners to assume an increased patient load, which will increase nurse practitioner demand. This upskilling trend in the nursing profession will create an opportunity for training providers in the region, which is discussed in the next section.
4.2. Training Alignment of Registered Nurses
This section provides an analysis of the training alignment of the Hampton Roads study area for registered nurses. First, the current training providers and their degree awards in nursing are reported. This is followed by an
10 For an example, please see http://www.nytimes.com/2012/06/24/education/changing-requirements-send-nurses-back-to-school.html?pagewanted=all
11 The focus group was held on April 24, 2014.
High School or Less 1%
Associate's degree (including some
college) 43% Bachelor's degree
46%
Graduate degree
10%
Figure 4.1: Educational Attainment of RNs in the Study Area
assessment of whether the capacity surpasses or falls short of demand using a metric created by Chmura called training concentration.12
4.2.1. Degree Awards in Registered Nursing
Based on data from the National Center for Education Statistics (NCES) for the 2011-12 academic year, there were 12 institutions in the Hampton Roads study area that offered training programs in registered nursing (Table 4.2). Those institutions vary, including public four-year universities (Old Dominion, Norfolk State), two-year community colleges (Tidewater, Thomas Nelson, and Paul D. Camp), private for-profit colleges (ECPI, ITT Technical Institute, and South University), and training schools affiliated with major healthcare systems (Riverside and Sentara). Among those 12 institutions, 8 of them offered certificates or associate’s degrees (ASN), six offered BSN degrees, and two offered graduate degrees in nursing.13
Table 4.2: Degree Awards in Registered Nursing (2011-12 Academic Year)
Institutions
Certificate and Associates Degrees
4-Year Degrees
Postgraduate Degrees
ECPI-Virginia Beach/Norfolk 235 15 0
Fortis College-Norfolk 37 0 0
Hampton University 0 81 14
ITT Technical Institute-Norfolk 17 0 0
Norfolk State University 70 72 0
Old Dominion University 0 158 78
Paul D Camp Community College 38 0 0
Riverside School of Health Careers 68 0 0
Sentara College of Health Sciences 0 34 0
South University–Virginia Beach 0 2 0
Thomas Nelson Community College 96 0 0
Tidewater Community College 91 0 0
Total 652 362 92
Source: National Center for Education Statistics
In the 2011-12 academic year at these institutions, 652 students earned awards at the associate’s degree or certificate level, 362 earned a four-year degree, and 92 earned a graduate degree in nursing. At first glance, the number of degree awards seems to be larger than the regional demand, especially at the associate’s degree level. The demand for nurses with BSN degrees was estimated to be 201, while demand for nurses with ASN degrees
12 Training concentration is defined as the ratio of the regional postsecondary award per employment for an occupation with respect to the national rate of postsecondary awards per employment. For example, if a region’s training concentration for a given occupation is 100%, it is producing awards at the same rate as the nation for that occupation; if a region’s training
concentration is 50%, it is producing awards at half the national pace for that occupation.
was estimated to be 189. Although regional awards in both degrees surpassed regional demand, the surplus in ASN degrees production was larger.
Surplus training of BSN degree nurse is less of a concern for a number of reasons. First, as mentioned above, regional hospitals increasingly prefer RNs with BSN degrees, and the current estimate may understate this demand. Additionally, students with BSN degrees are more mobile, and many of them may seek employment outside the region. Colleges in Hampton Roads have a large number of students from both the Northern Neck and the Southside areas of Virginia because these regions lack four-year institutions. Students obtaining BSN degrees in Hampton Roads may decide to leave the region to seek employment. Those upskilling trends could increase the demand for BSN in future years.
On the other hand, there appears to be some surplus in training capacity at both the associate’s and certificate levels for RNs. There are community colleges all over Virginia, and most of these students tend to remain in the region served by their community college after graduation. Similarly, many students attending for-profit colleges are working adults who tend to look for employment in the area. With an estimated 652 awards, the demand for
graduates with such degrees is less than 200 per year. Many of these graduates may downgrade their career aspirations. Instead of seeking employment in major hospitals, they may end up in doctors’ offices, with home healthcare service providers, or in nursing care facilities. Chmura’s training concentration analytic, explained in below, provides a more definite indicator of the balance between demand and supply for RNs.
4.2.2 Training Concentration for Nurses
Training concentration is defined as the award output measured against occupation demand. To analyze
occupation training, Chmura first translated the awards by training program into occupations and then calculated the rate of degree awards as a percentage of total employment. The national percentage of postsecondary awards in total employment (in a corresponding occupation) is used as the benchmark, and a regional rate is constructed as a percentage of the national benchmark percentage. This relative regional percentage is termed its “training concentration” for a given occupation. For example, if the nation produces one registered nurse graduate for every ten employed nurses, the one-to-ten ratio is the national standard. If a region such as Hampton Roads produces
one registered nurse graduate for every twelve employed nurses, then we conclude the region’s output for this
occupation is trailing the national rate of production.
In occupations where there exists substantial shortfalls in training concentration (about 75% or less), Chmura expects that industries struggle to find locally-available talent with requisite skills. These industries would also be expected to recruit applicants from outside the area—Virginia-wide or even out-of-state. The least favorable option is to hire individuals lacking the desired occupation-specific skills and background, which would require a longer initial training and orientation period.
The overall output of postsecondary awards for registered nurses is above-average in the study area (117% training concentration). This percentage implies that there is no shortage of training capacity for RNs (training concentration does not break out the awards by degree levels). Data in Section 4.2.1 indicate that there is not a shortage at the BSN level, and there might be some surplus at the ASN level. The study area has a particularly high output of awards for licensed practical and licensed vocational nurses at close to three times the national average pace.
Table 4.3: Hampton Roads Study Area Postsecondary Training Output
for "Highly-Educated" Healthcare Practitioner and Technical Occupations, 2011-12 Academic Year SOC Title
Estimated All
Awards Employment
Training Concentration
High-Growth
29-1141 Registered Nurses 1,148 12,994 117% √
29-2061 Licensed Practical and Licensed Vocational Nurses 865 3,517 292% √
29-2071 Medical Records and Health Information 138 918 92% √
29-2034 Radiologic Technologists 92 985 141% √
29-2021 Dental Hygienists 72 1,117 158% √
29-2055 Surgical Technologists 72 473 145% √
29-2052 Pharmacy Technicians 66 1,875 58% √
29-1123 Physical Therapists 58 1,007 111% √
29-1051 Pharmacists 57 1,469 79% √
29-1069 Physicians and Surgeons, All Other 56 1,842 88% √
29-2012 Medical and Clinical Laboratory Technicians 54 801 150% √
29-1071 Physician Assistants 53 504 138% √
29-1127 Speech-Language Pathologists 52 707 90% √
29-2041 Emergency Medical Technicians and Paramedics 49 1,381 34% √
29-2031 Cardiovascular Technologists and Technicians 22 246 119% √
29-2011 Medical and Clinical Laboratory Technologists 22 807 106%
29-1062 Family and General Practitioners 21 694 94% √
29-1171 Nurse Practitioners 20 611 31% √
29-1126 Respiratory Therapists 18 538 50% √
29-9091 Athletic Trainers 15 121 64% √
All Other Occupations 73 7,563
Source: JobsEQ
The area has a training shortage for nurse practitioners. Based on data from the 2011-2012 academic year, the Hampton Roads study area had a relatively low output of nurse practitioners. With a training concentration of only 31%, degree awards for this occupation are only 31% of the national norm. That means regional healthcare service providers will have to recruit nurse practitioners from outside the region, or even out-of-state. With increasing demand for this occupation, businesses either have to offer better compensation packages or other benefits to hire and retain these workers.
4.3. Implication for Training Providers
The unmistaken trend of upskilling in the nursing profession points to several opportunities for regional healthcare training providers, especially four-year institutions. There are opportunities for four-year institutions to start training programs such as “RN to BSN,” as they become popular for existing RNs without BSN degrees who desire to stay in hospitals and obtain a bachelor’s degree. These programs will target current RNs with ASN degrees. Many such programs have been set up in Virginia and throughout the country. The University of Virginia offers one such program that takes 21 months to complete on a part-time basis.14 RN to BSN programs are offered at a number of
regional schools including ECPI, Norfolk State, Old Dominion, and Hampton Universities, as well as Sentara College of Health Sciences.15
There is also significant demand for nurse practitioner programs from four-year institutions in the area but currently there are limited offerings in the region. The nurse practitioner program is a graduate-level degree program, and current four-year institutions such as ODU, Hampton University, and Norfolk State are well-suited to start or expand programs in this specialty.
Unfortunately, two-year institutions will face challenges if demand growth for RNs with associate’s degrees or LPNs slows in the future. These institutions could partner with four-year institutions to start 2+2 programs for BSN
degrees. A student may start an ASN nursing degree program in a two-year college, and then transfer to a four-year institution for a BSN degree, or even a graduate degree in nursing. Due to the “trickle-down” effect, many firms may require LPNs to obtain an ASN degree in registered nursing. This will also provide opportunities for two-year colleges. They can partner with nursing care and home care providers and upskill their LPNs to RNs with ASN degrees. Some regional schools have started such “LPN to RN” programs, including Tidewater and Thomas Nelson Community Colleges. In addition, Norfolk State and Hampton Universities have “LPN to BSN” programs, which
offer a direct pathway to a 4-year degree for licensed and practical nurses. Upskilling will affect the entire industry and both LPNs and RNs will need to gain additional training.
5. Other Nursing Training Issues
5.1. Clinical Rotation
Clinical training is a critical part of an RN’s education, providing hands-on opportunities in a real world setting. BSN programs require extensive clinical training in the range of 700-800 hours.16 While the existing clinical capacity in the region may be sufficient for the current number of nursing students, if the number of students in BSN programs expands in the future, there may not be enough clinical spaces available. According to one participant in the Hampton Roads Healthcare Workforce focus group, based on a workforce study their organization conducted, there is not enough clinical training space.
A recent report by the Association of American Medical Colleges revealed concerns from medical schools, nurse practitioner programs, and physician assistant programs across the country about the lack of clinical training space.17 According to the results of a 2013 survey, 96% of nurse practitioner programs reported concerns about the number of clinical training sites. In addition, 86% of respondents representing nurse practitioner programs said that it was harder to develop new clinical training sites in 2013 than it had been two years earlier. The report also said that 72% of nurse practitioner program respondents believed that the shortage of training sites was constraining enrollment capacity in their programs. While these survey results are specific to nurse practitioner programs, it is likely that RN programs nationwide are experiencing similar challenges.
In order to prepare for the projected increased demand for BSN degrees, the Hampton Roads study area needs to address the potential training capacity shortage. One possible alternative to alleviate this shortage would be to allow more clinical experience in a simulated environment.
5.2. Regional Simulation Education Centers
The use of simulators may help alleviate the capacity issues discussed above. Using simulation to supplement clinical experience may help local nursing programs increase enrollment and help the region keep up with the projected increased demand for RNs with BSN degrees. Many nursing schools, including the University of Pennsylvania School of Nursing and New York University College of Nursing, have successfully expanded enrollment because of their ability to supplement clinical training with simulation.18
The Virginia Board of Nursing allows a maximum of 20% of direct patient care hours to be completed through simulation.19 Some programs outside Virginia rely much more heavily on simulation. The School of Nursing at Texas Tech University, for example, recently opened a new facility which allows 50% of its students’ clinical
16 The Virginia Board of Nursing requires all RN nursing programs in Virginia to provide a minimum of 500 hours of direct client care supervised by qualified faculty. See Guidance Document 90-24, “The Use of Simulation in Nursing Education,” March 19,
2013, http://www.dhp.virginia.gov/nursing/nursing_guidelines.htm.
17 Source: https://members.aamc.org/eweb/upload/13-225%20WC%20Report%202%20update.pdf
18 Source:
http://www.nursezone.com/nursing-news-events/more-news/The-Current-State-of-Nursing-Education-Capacity-and-Demand_35044.aspx
19 See Guidance Document 90-24, “The Use of Simulation in Nursing Education,” March 19, 2013,
experiences to be simulated.20 Nursing leaders, state medical schools, and other interested parties may need to consider lobbying the Virginia Board of Nursing to expand the amount of patient care hours permitted in simulation. There has not been a movement to do so, however, possibly in part due to the high cost associated with simulation laboratories. One solution might be for a regional simulation laboratory to spread the cost of the center across several institutions.
20 Source:
6. Recommendations
The trend toward the need to upskill will present a constant challenge for area workforce development
professionals and the region’s education providers. Fortunately, regional education and training providers have
responded to such needs and expanded their capacities in high-demand occupations over the past two years. There are also ample training opportunities for the existing workforce, such as upskilling current RNs with associate’s degrees to bachelor’s degrees. For workforce development agencies, matching job candidates with demand is important to ensure the efficiency of the regional labor market.
The trend of upskilling in nursing professions points to several opportunities for regional healthcare training
providers. As a result of this trend, there is an opportunity for four-year institutions to start RN to BSN programs, as they become popular for RNs with an associate’s degree. This would allow registered nurses to continue working in
a hospital setting while obtaining a bachelor’s degree. Many such programs have been set up around the country and in Virginia at the University of Virginia, Old Dominion University, Virginia Commonwealth University, and Sentara College of Health Sciences.
There is also significant demand for nurse practitioner programs from four-year institutions in the area, but there are limited offerings in the region. A nurse practitioner program is at the graduate-level, and four-year institutions such as ODU and Norfolk State are well-suited to start or expand programs in this specialty.
Unfortunately, two-year institutions will face challenges in that demand growth for RNs with associate’s degrees or LPNs may slow in the future. These institutions could partner with four-year schools to start 2+2 programs for BSN degrees. Students could receive their ASN degree from a two-year college, then transfer to a four-year institution for a BSN degree, and if they desire, a graduate degree in nursing. They can also partner with nursing care and home care providers and upskill their LPN credentials to an RN with an ASN degree, starting “LPN to RN”
programs. Upskilling will affect the entire healthcare industry, and both LPNs and RNs will need to receive additional training.