c
Sharif University of Technology, December 2009 Research Note
Two-Pillar Risk Management (TPRM): A
Generic Project Risk Management Process
S.M. Seyedhoseini
1and M.A. Hate
1;Abstract. A conventional Risk Management Process (RMP) contains two main phases: (a) risk assessment that includes risk identication and risk analysis, and (b) risk response that decides what, if anything, should be done about the analyzed risks. Based on a traditional tendency, most studies in state-of-the art RMP have ample emphasis on risk assessment, but we can nd limited studies on the subject of risk response. This paper aims to oppose the mentioned traditional view. The paper introduces a generic RMP, namely Two-Pillar Risk Management (TPRM) that considers an equivalent importance for both risk assessment and risk response. The paper compares the TPRM with the last version of the RMP provided in the standard of PMBoK. Application of the proposed model in projects in the construction industry shows a tremendous total risk level improvement. We believe that applying the TPRM helps project managers in a most eective and ecient manner in dealing with their risk management programs.
Keywords: Risk Management Process (RMP); Project risk management; Risk response.
INTRODUCTION
Risk is an entity that appears in all aspects of a project. Therefore, the need for project risk management has been widely recognized. The purpose of project risk management is to improve project performance by sys-tematically identifying and assessing risks, developing strategies to reduce or avoid them and maximizing opportunities [1]. Regarding the subject of the Risk Management Process (RMP), since 1990, a large num-ber of RMPs have been generated to address the need for more eective risk management [2,3]. Within the research area of the present paper, we have studied and compared most RMP's such as RISKIT [4] in the software engineering context, PUMA [5] and MRMP [3] in the construction engineering context, RFRM [6] in the system engineering context, SHAMPU [1] and PMBoK [3] in the project management context, the standard of the AS/NZS 4360 [7] in the public appli-cation context etc.
There is a consensus that RMP is comprised of 1. Department of Industrial Engineering, Iran University of Science and Technology, Tehran, P.O. Box 16846-13114, Iran.
*. Corresponding author. E-mail: Hatema@yahoo.com Received 8 May 2007; received in revised form 13 September 2008; accepted 22 October 2008
two main phases. The rst phase is risk assessment, including risk identication and risk analysis. The second phase is risk response which decides what, if anything, should be done about the assessed risks. In the traditional view of risk management, the impor-tance of risk assessment overrides the imporimpor-tance of risk response. This subject has created a signicant shortage in risk response related research studies. Many researchers have stressed the mentioned short-age, which the following statements conrm it: \Yet risk response development is perhaps the
weakest part of RMP, and it is here that many orga-nizations fail to gain the full benets of RMP" [8]. \Few solutions have been proposed and there are no widely accepted processes, models or tools to support the cost-eective selection of risk re-sponses" [9].
\Risk response planning is far more likely to be inadequately dealt with, or overlooked entirely, in the management of project risk" [10].
\A few specic tools have been suggested in the literature for determining risk responses" [11]. \In the risk response process, less systematic and
According to the modern view of risk manage-ment, all RMP steps are equally important. This mod-ern view directs risk analysts towards a Critical Success Factor (CSF) of RMP, namely \Equilibrium" [12], which is expressed as follows:
\In RMP, risk assessment play a fundamental role and risk response play a throughout role, focusing on one and ignoring the other misleads RMP".
Regarding the CSF of \Equilibrium", this pa-per proposes a new RMP, namely Two-Pillar Risk Management (TPRM). The paper is organized in the following manner. First, we describe the key concepts and present the TPRM. Subsequently, within a typical project, some analytical results will be described. Then, the TPRM and the RMP provided in the standard of PMBoK [13] will be compared. Finally, some remarks regarding the applicability of our model will be discussed.
KEY CONCEPTS
In a general project environment, the key concepts are dened as follows:
Project Measures: They are the key criteria in a project, i.e. project time, project quality and project cost [14].
Project Scope: It is the target state of the project in terms of project measures (see Table 1).
Project Ultimacy: It is the ultimate state of the project in terms of project measures (see Table 1). Risk Event: It is a discrete event that, if occuring, would have a positive (opportunity) or negative (threat) eect on project measures. One risk event can aect one or some project measures.
Risk Measures: Risk events are phenomena that have several characteristics, namely risk measures, which could be used to characterize risk events, as described in Table 2.
Risk Class: It implies the typology of risk events. Response Action: It is a discrete activity that, when carried out, has a positive (ameliorator) or negative (deteriorator) eect on the risks measures. One response action can aect one or some risk measures of one or some risk events.
Response Measures: Similar to those of risk, there are some measures that are descriptive of response actions. Response measures are explained in Table 3. Response Class: It implies the typology of response actions.
Now, in the relationship between project risks, re-sponses and their measures, a complete scenario is a chain consisting of ve parts as follows:
A. Response Measures are used to characterize Re-sponse Actions;
B. Implementing Response Actions aects Risk Mea-sures;
C. Risk Measures are used to characterize Risk Events; D. Occurrence of Risk Events aects Project measures; E. Project Measures are used to characterize Project
Ultimacy.
TPRM FRAMEWORK
Figure 1 exhibits the proposed generic Two-Pillar RMP (TPRM) that has been particularized for project environments, and could also be adapted to the needs of other environments. The term \two-pillar" means that we have designed all elements of TPRM in respect to two main equivalent pillars, i.e. \risk" and \response". The word \generic" indicates that the risk analysts must consider the TPRM and generate a process to match their project properties. The TPRM is structured in several phases, stages and steps.
TPRM Start Up
The TPRM begins with the phase of \TPRM start up". In this phase, the project manager appoints the leader of risk management. Then, the most important tasks include establishing the organizational chart of risk management, constructing a team of risk management and training them.
Actuation
This phase is the planning section of the TPRM. Some of the major stages in this fundamental phase are determining the level of the project Work Breakdown
Table 1. Project measures.
Project Measure In Project Scope In Project Ultimacy Project time The project aim on time The project upshot on time Project quality The target state of specications
of the project output
The ultimate state of specications of the project output
Table 2. Risk measures.
Risk Measure Description
Risk impact When a risk event occurs, it impacts on project measures. If risk impact were a negative value, it would refer to a threat, otherwise it refers to an opportunity.
Risk probability A probability of occurrence of risk event [14]. Risk detection Degree of easiness of detection of risk event [6,15]. Risk manageability Degree of inuence on the controlling of risk event [16].
Risk eect delay Risk eect delay or risk impact delay [4] is the time of latency between the risk event occurrence time and its actual impacts [17].
Risk proximity Some risk events occur early in the project cycle and others late in the cycle. Risk proximity is the period of time within which the risk event is expected to occur.
Risk predictability This measure determines where and when in the project, the risk event might occur [16]. Risk growth The variation of risk measures along time, if it is left unattended.
Risk coupling It refers to the eect a risk would have on measures of other risks.
Risk uncertainty It refers to the lack of information about the nature of the probabilistic distribution function of risk measures.
Risk uniqueness Sometimes, when dealing with a special subject, a risk event may receive attention. For example, a special marketing situation guides the risk analysts to give higher weight to a risk event.
Table 3. Response measures.
Response Measure Description
Response impacts When a response action is applied, it impacts on risk measures.
Response resources The resources that a response action takes. The risk analysts may state this measure in terms of the implementation cost of the response action [9].
Response probability The likelihood of success of the response action.
Response capacity The availability of resources to implement the response action. This measure may rule out some eective response actions [4].
Response duration Similar to the project WBS elements, response actions also take time [4]. Response eect delay
The latency time between the implementation of a response action and the actual impacts of a response action. Indeed, this measure is the time period during which risk measures will be impacted by the response action.
Response urgency
A risk event should be addressed so as to have the desired eect. Response urgency or margin [4] is the measure of how imperative or critical it is to address the risk event.
According to PMI [13], the time-criticality of response actions may magnify the importance of a risk event.
Response uncertainty
It is about the lack of information about the nature of the probabilistic distribution function of response measures. This may cause the diculty of establishing appropriate performance measures [17].
Response uniqueness Sometimes, dealing with a special subject, a response action may receive priority. For instance, stakeholder views may inuence the priority of a response action [4,8].
Structure (WBS) to be applied, selecting required project/risk/response measures, determining possible classes of risks/responses, assigning weighted coe-cients to risk/response measures and classes, scaling the selected risk/response measures and assigning the
weighted factors for dierent levels of each selected measure, formulating risk/response level functions, clarifying essential conditions to begin the next round of the TPRM, and establishing the process success measurement indicators.
Figure 1. The TPRM framework.
Assessment of Project, Risks and Responses \Assessment" is an activity that contains two stages: \Identication" and \Analysis". There is a loop among three assessment activities in each round of the TPRM. In fact, risk assessment is the predecessor of response assessment, response assessment is the predecessor of project assessment and project assessment is the predecessor of risk assessment. It must be noted that the TPRM has encapsulated all conventional project-planning activities (creating project WBS, resources assignment, project scheduling etc.) into the stage of project assessment.
Risk and Response Identication
The TPRM stresses identication of all possible risks/responses. The TPRM denes the concept of the \risk sign", which states that a risk event may be threat (negative or downside risk) or opportunity (positive or upside risk). Regarding the two-pillar view, it denes the concept of a \response sign", which expresses that a response action may be a deteriorator
(downside or negative response) or an ameliorator (up-side or positive response). Deteriorator/ameliorator is a response action with undesirable/desirable eects on risk measures. So, not only negative risks/responses, but also positive ones should be identied. Besides, risk identication is needed for secondary risks/responses as well as primary ones. Risk events that arise as a direct result of implementing response actions are termed secondary risks [5,13]. Response actions that are candidates for a response to secondary risks are termed secondary responses.
Risk and Response Analysis
The stage of risk analysis includes four steps: risk measurement, risk classication, risk processing and risk priorization. Responses also are required to go through all the above four steps.
Risk and Response Measurement
Traditionally, most RMPs consider risk probability and risk impact to characterize risks. This is a
two-dimensional notion [18]. This means that other risk measures are not addressed at all. We believe that in order to have a complete simulation of risks/responses, risk analysts are required to consider not only these two measures, but also all pivotal risk/response measures, as shown in Tables 2 and 3. Risk/response mea-sures should be termed as qualitative or quantitative values. So, the selected measures are scaled in the risk/response scaling.
Risk and Response Classication
Hillson [19] states that risk identication often pro-duces nothing more than a long list of risks, which can be hard to understand or manage. The best way to deal with a large amount of data is to classify the information. This could be accessed through the classi-cation of data into dimensional structures. We believe that this structuring activity should be considered for both risks and responses. For one-dimensional classi-cation, the TPRM recommends the Event Taxonomy Structure (ETS) and the Action Taxonomy Structure (ATS), respectively, for risks and responses. For two-dimensional classication, the TPRM introduces the Event Structuring Matrix (ESM) and the Action Structuring Matrix (ASM), respectively, for risks and responses.
Risk and Response Processing
During risk measurement and risk classication, the risk analysts may do some processes on risks. The aim of risk processing is better risk analysis through decreasing complexity and size or increasing accuracy and precision. Risk analysts may do one or some processes, such as risk screening (removing risks), risk bundling (combining some risks to one), risk adding (adding new risks) and risk refracting (decomposing one risk to some risks) etc. Risk analysts can also consider processes similar to the above mentioned for responses, including response screening, response bundling, response adding, and response refracting.
Risk and Response Priorization
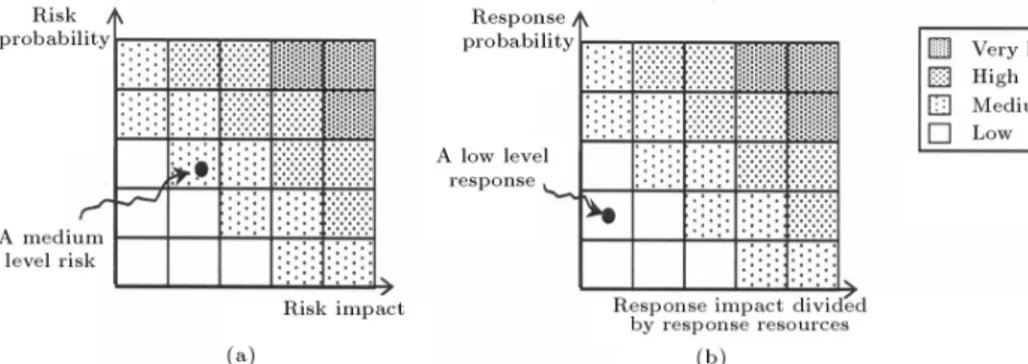
Risk level is an index that is used to determine the pri-ority of risks. A requirement for using most measures is to map them on a one-dimensional scale. Therefore, in the phase of actuation, risk analysts may establish a function for determining risk level. Traditionally, to determine risk level, risk analysts use two risk measures including risk probability and risk impact, as in Equation 1 (see Figure 2a). Regarding the two-pillar perspective, the response level is an index presenting a response magnitude (or its eciency) that could be applied to determine the priority of responses. Within a simple view, following Equation 1, we can determine response level as Equation 2 (see Figure 2b). It should be noted that a negative risk/response level refers to a threat/deteriorator, while a risk/response level of a positive value refers to an opportunity/ameliorator.
Risk level = Risk probability Risk impact; (1) Response level = (Response probability
Response impact)
= Response Resources: (2) In a comprehensive view, risk analysts can consider more risk measures to establish a function for determin-ing risk level. Based on the two-pillar idea, a function that includes more response measures could be used to specify the response level. Besides, the mentioned functions could be inuenced by weighted factors as-sociated with risk/response classes. Equations 3 and 4 show these functions, respectively.
Risk level =f(Risk measures;
Risk classes weighted factors); (3) Response level = f(Response measures;
Response classes weighted factors): (4)
Risk and Response Spectrum
Risk analysts can assume that the concepts of threat and opportunity could be integrated in a risk spectrum. By mapping the risk level in a risk spectrum as Figure 3a, risk analysts can determine whether or not a risk is downside or upside. By mapping the response level in the response spectrum, as in Figure 3b, they can also determine whether or not the response is dete-riorator or ameliorator. Naturally, downside responses are not favorable and must be crossed o the responses list.
Total Risk/Response Level
It is often desirable to combine the various identied and characterized risk elements into a single quan-titative project risk estimate. Indeed, risk analysts may also be interested in knowing the \total risk level" of their projects in order to compare dierent projects [20]. This estimate of overall project risk [21], which may be used as input for a decision about whether or not to execute a project, is dened by [21] as Equation 5. Regarding the two-pillar view, an estimate could be also dened to determine the overall project response or \total response level". This estimate may be used for determining the response power. Following Equation 5, the total response level could be dened as Equation 6.
Total risk level =XRisk level= Risks number; (5)
Total response level =X Response level
=Responses number: (6)
Implementation and Control
For an assumed round of the TPRM, the planned responses should be executed. To implement and con-trol risks, each risk/response must have an ownership. Risk/response control includes tracking and monitoring the risk/response statement. There have been several indexes and techniques to control risks/responses, such as Risk Reduction Leverage (RRL) [4], Net Value of Treatment option (NVT) [7] etc. Before starting
the next round, we are required to calculate success measurement indicators for the previous round.
TPRM Shut Down
This phase guarantees that the TPRM completes its mission. In the phase of TPRM shut down, rstly, it should be clear whether or not TPRM has been suc-cessful. Secondly, it requires recording all knowledge, experience and \lessons learned", which are earned during the TPRM periods [2]. This is a very useful input to the next projects and can be a channel to integrate knowledge management programs of the organization. Lastly, regarding the models of the Risk Maturity Model (RMM) [22], risk analysts can distinguish the level of RMM of the organization and can use it as a useful guideline for the next projects.
ANALYTICAL RESULTS
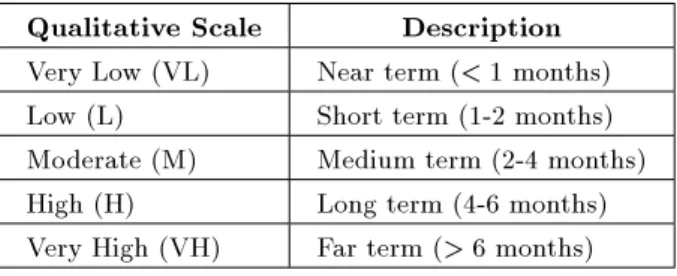
Now, we consider a project that is a real case taken from the construction industry. This project in-cludes the Engineering, Procurement and Construction (EPC) of the radial gates from a hydro-mechanical power plant. To clarify the procedure of the TPRM, we trace the results of the rst round of the process. In the actuation phase, risk analysts consider three risk measures, including risk probability, risk cost impact and risk eect delay. They also select two response measures, i.e. response implementation cost and re-sponse urgency. In the next step, the entire selected risk/response measures were qualitatively scaled in 5-level scaling tables. For instance, Tables 4 and 5 are the scaling tables of risk eect-delay and response urgency, respectively.
In the risk identication stage, as in Table 6, seven
Table 4. Scaling table of risk eect delay. Qualitative Scale Description Very Low (VL) Near term (< 1 months) Low (L) Short term (1-2 months) Moderate (M) Medium term (2-4 months) High (H) Long term (4-6 months) Very High (VH) Far term (> 6 months)
Table 5. Scaling table of response urgency. Qualitative Scale Description Very Low (VL) Can be addressed at a later stage
Low (L) Must be addressed in the near future
Moderate (M) Must be addressed immediately to avoid adjustments to the project plan
High (H) Must be addressed immediately but will require minor adjustment to the project plan Very High (VH) Must be addressed immediately but will require major adjustmentto the project plan
Table 6. The identied risk events (risk sign appears in the cost impact column).
Code Risk Event Probability Cost Impact Eect Delay E1 Weak designing of product components M -H L
E2 Opportunity of employing the autochthon labors H +M M
E3 Environmental problems in tting the gates VH -M VH
E4 Improvement of inspection activities L +L M
E5 Welding distortions L -M VH
E6 Delay in delivery of elevator equipment M -VH L
E7 Failure in supplying control equipment L -H L
risk events were identied. The risk measurement stage of the risk analysis phase includes determining the level of each selected risk measure for each identied risk event. The results have been presented in Table 6. For example, for the rst risk event, the \Weak designing of product components", probability is moderate, cost impact is high threat and eect delay is low. In the next stage of risk analysis, risk analysts classied risk events in a predened ESM, as in Table 7.
To prioritize risks, risk analysts dened the risk
Table 7. Event Structuring Matrix (ESM) for classifying risk events.
ESM Type
Technical Human Plan Weigh Factor 0.3 0.3 0.4
Project 0.6 E5 E4, E6
Category Consortium 0.2 E1 E7
External 0.2 E3 E2
level as 10,000 per product of risk probability, risk cost impact, risk eect delay, risk type and risk category. For the purpose of quantifying the qualitative values, the numbers 0.9, 0.7, 0.5, 0.2 and 0.02 replaced VH, H, M, L and VL, respectively. Consequently, the risk levels for E1 to E7 were calculated, respectively, as
42, 105, 243, 48, 162, 216 and 22:4. Using the absolute value of these numbers, the ranking of risks became E3> E6 > E5> E2> E4 > E1> E7. In the
stage of risk processing, risk analysts decided to remove risks E1, E4 and E7 (risk screening). Similar to those
of risks, the entire preceding activities were considered for responses. In fact, response actions were identied, measured and classied. Table 8 shows six identied response actions that are measured using two selected measures. Table 9 also exhibits a predened ASM in which the identied response actions are classied.
Risk analysts dened the response level as the product of response type and response category divided by implementation of the cost of response and response
Table 8. The identied response actions.
Code Response Action Implementation Cost Urgency A1 Using simulation [14] for the gates erection L M
A2 Employing an old hand erection expert as contractor M H
A3 Considering the safety budget for erection problems H H
A4 Hiring the extra vehicles M VH
A5 Providing the demonstration events [14] for deliveries VL M
Table 9. Action Structuring Matrix (ASM) for classifying response actions.
ASM Type
Mitigate/Enhance Avoid/Exploit Transfer/Share Accept
Weight Factor 0.6 0.2 0.15 0.05
Management 0.2 A5
Money 0.25 A3
Category Manpower 0.2 A2
Machinery 0.1 A4
Method 0.15 A1, A6
Material 0.1
urgency. Consequently, the response levels for A1 to
A6 were calculated, respectively, as 9000, 857, 1020,
444, 120000 and 5000. Thus, the ranking of responses became A5> A1> A6 > A3> A2> A4. In the stage
of response processing, based on Figure 4, risk analysts preferred to eliminate responses A2 and A4 (response
screening) and combine responses A1and A3(response
bundling).
At the end of the TPRM process, eight rounds were passed. By means of clarifying the eects of TPRM application in a typical project, Figure 5 represents the evolution of the total risk level variation through the TPRM rounds. For instance, in the rst round of the process, the total risk level was 76 (average of 42, 105, 243, 48, 162, 216 and 22:4). At the end of the TPRM process, the application of the TPRM showed some promising results, as the total project risk level was reduced by 36:84%(= (76% 48%)=(76%)). Figure 5 conrms that, in each round of the TPRM implementation, the value of the total risk level has gradually improved.
COMPARATIVE STUDY
In this section, Table 10 is introduced to compare the capability of the TPRM with the last version of the
RMP provided in the standard of PMBoK [13]. Some dierences and similarities in the structural objectives of both processes are presented.
DISCUSSION
We recall that the TPRM is a generic process. So, it does not guarantee providing details of tools and techniques. The designers of the TPRM believe that the question is not whether or not to use this or that tool, but to always perform a suitable and sound technique adapted to the needs of risk management and the risk analysts undertaking it.
However, several aspects of the TPRM are worth-while emphasizing. These aspects are discussed as follows:
(I) The TPRM stresses an identical importance for both \risk" and \response". As presented in Table 11, the TPRM considers two items for each issue; one for \risk" and the other for \response", for instance risk/response identica-tion, risk/response analysis, risk/response level, secondary risk/response etc. This is a hint to consider the CSF of \Equilibrium" for RMP [12]. (II) It is worth mentioning that many risk manage-ment researchers believe that the RMP should
Figure 4. Response spectrum in the rst round of the TPRM.
Table 10. Comparison of the TPRM and the RMP provided in the standard of PMBoK [13].
Item The PMBoK [13] The TPRM
Essence of Designing
The PMBoK has been formed based on a traditional view explained by Grey [23], in which risk management is a part of project management.
The TPRM has been designed based on a new notion explained by Grey [23], in which risk management should encompass all project management activities.
Risk Denition
The PMBoK denes project risk as \an uncertain event or condition that if occurring, has a positive or a negative eect on at least one of the project objectives, such as cost, time, scope or quality". Some risk practitioners like Hillson [8] disagree with the PMBoK denition of risk [24].
As indicated by many researchers like Kerzner [14], project scope encompasses cost, quality, and time. Thus, the TPRM denes risk event as \a discrete event that if occurring, would have a positive or negative eect on project measures". Risk Typology Risk Breakdown Structure (RBS) [19,13] Event Taxonomy Structure (ETS) Response Typology Not provided Action Taxonomy Structure (ATS) Risk/Response
Measures
The PMBoK considers risk probability and risk impact. Indeed, it is constructed based on a two-dimensional view [18]. It also considers the implementation cost of response actions.
All risk/response measures could be considered in the TPRM. Indeed, in this regard, it is constructed based on a multi-dimensional view.
Upside and Downside Issues
The PMBoK includes both opportunity and threat within its denition of risk. However, the RMP described in the PMBoK still tends to focus on management of threats [12]. Besides, this standard has not any systematic procedure to screen the responses.
The TPRM considers both upside and downside risk/response within a united perspective. It introduces the concepts of \ameliorator" and \deteriorator". It also introduces the concepts of \risk spectrum" and \response spectrum" to determine sign of risks and responses.
Secondary Issues The PMBoK considers secondary risk/response.
The TPRM considers secondary risk/response.
Kind of Process According to [2], the RMP provided in
the PMBoK is often too generic. The TPRM is a generic process.
Process Phases
(1) Risk management planning, (2) Risk identication,
(3) Qualitative risk analysis, (4) Quantitative risk analysis, (5) Risk response planning and (6) Risk monitoring and control. \Integrated change control" provides a feedback loop through the above phases.
(1) Start up, (2) Actuation, (3) Risk assessment, (4) Response assessment,
(5) Implementation and control and (6) Shut down.
\Project assessment" provides a feedback loop through the above phases.
Special Advantage
The PMBoK is a document of great relevance because it has been adopted as a standard by ANSI (American National Standards Institute) and IEEE (USA Institute of Electrical and Electronic Engineers) [13].
The TPRM is unique, in respect to existing in state-of-the art processes. The TPRM is the rst approach, which has been considered of equivalent importance for both \risk" and \response".
Table 11. Some aspects of the TPRM.
Risk Related Items Response Related Items
Risk event Response action
Risk assessment Response assessment
Risk identication and analysis Response identication and analysis
Downside and upside risk (threat & opportunity) Downside and upside response (Deteriorator & Ameliorator) Primary and secondary risk Primary and secondary response
Risk classication, processing, measurement and priorization
Response classication, processing, measurement and priorization
Risk screening, bundling, adding and refracting Response screening, bundling, adding and refracting Risk measure and risk class Response measure and response class
Risk probability, impact, eect delay, uncertainty etc. Response probability, impact, eect delay, uncertainty etc. Event Taxonomy Structure (ETS) Action Taxonomy Structure (ATS)
Event Structuring Matrix (ESM) Action Structuring Matrix (ASM) Risk level and risk priority Response level and response priority
Total risk level or overall project risk Total response level or overall project response Risk sign and risk spectrum Response sign and response spectrum
Risk ownership Response ownership
Risk control and risk tracking Response control and response tracking
be strongly integrated into the overall project plan [9,5]. In the TPRM, \project assessment" plays a central role in providing a feedback loop through the process phases.
(III) The skeleton of the TPRM is based on the view of the Plan-Do-Check-Action (PDCA) emphasized by Kleim and Ludin [25]. Indeed, the actuation phase is part of the \action", the risk and re-sponse assessment constitute part of the \plan", the phase of implementation and control is part of the \do", and the project assessment phase is part of the \check".
(V) Another key feature of TPRM is allowing, ex-plicitly, for the inclusion of several measures of risk and response to characterize them. This is an indispensable shift of traditional perspectives to a more comprehensive view, both for risk and response.
(IV) Some new denitions and concepts have been developed within the TPRM, for instance; ame-liorator, deteriorator, response probability, sponse uniqueness, risk/response measure, re-sponse bundling, risk/rere-sponse spectrum, total response level etc.
CONCLUSION
We started this paper to show that there is limited study on the subject of risk response in state-of-the art RMP. The main contribution of this paper is in
introducing a new expanded framework to organize RMP for the indispensable shifting of risk researcher's perspectives toward an equivalent importance for both \risk" and \response". The paper proposes a new generic process for project risk management, namely Two-Pillar Risk Management (TPRM). Application of TPRM was implemented in projects in the construction industry by which a considerable improvement in the project total risk level was shown. Besides, comparing TPRM with RMP, provided in the last version of the standard of PMBoK, showed some considerable advan-tages for TPRM. The paper concludes that TPRM can be used for risk management projects in the most eective and productive manner in real world problems. We believe that taking the two-pillar perspective can lead risk researchers to develop new techniques for project risk management, especially in the eld of risk response.
REFERENCES
1. Chapman, C.B. and Ward, S.C., Project Risk Man-agement, Processes, Techniques and Insights, 2nd Ed., John Wiley, Chichester, UK (2003).
2. Kwak, Y.A. and Stoddard, J. \Project risk man-agement: Lessons learned from software development environment", Technovation, 24, pp. 915-920 (2003). 3. Pipattanapiwong, J. \Development of multi-party risk
and uncertainty management process for an infras-tructure project", PhD Thesis, Kochi University of Technology, Kochi, Japan (2004).
4. Kontio, J. \Software engineering risk management: A method, improvement framework, and empirical eval-uation", Nokia Research Center, PhD Thesis, Helsinki University of Technology, Helsinki, Finland (2001). 5. Del Cano, A. and De La Cruz, M.P. \Integrated
methodology for project risk management", Journal of Construction Engineering and Management, 128(6), pp. 473-485 (2002).
6. Haimes, Y.Y., Kaplan, S. and Lambert, J.H. \Risk ltering, ranking and management framework using hierarchical holographic modeling", Risk Analysis, 22(2), pp. 381-395 (2002).
7. Cooper, D., Tutorial Notes: The Australian and New Zealand Standard on Risk Management (AS/NZS 460), Retrieved May 2004 from http://www.broadleaf.com.
8. Hillson, D. \Developing eective risk response", 30th Annual PMI Seminars and Symposium, Philadelphia, PA, USA (1999).
9. Ben, D. and Raz, T. \An integrated approach for risk response development in project planning", Op-erational Research. Society, 52, pp. 14-25 (2001). 10. Gillanders, C. \When risk management turns into
cri-sis management", AIPM National Conference, Sydney, Australia (2003).
11. Saari, H.L., Risk Management in Drug Development Projects, A Report by Helsinki University of Technol-ogy, Laboratory of Industrial Management, Helsinki, Finland (2004).
12. Seyedhosseini, S.M., Noori, S. and Hate, M.A. \A gap analysis on the project risk management processes", Kuwait Journal of Science and Engineering, 35(1B), pp. 217-234 (2008).
13. PMI (Project Management Institute), A Guide to the Project Management Body of Knowledge (PMBoK), Newtown Square, Pennsylvania, USA (2004).
14. Kerzner, H., Project Management: A Systems Ap-proach to Planning, Scheduling, and Controlling, 8th Ed., Wiley, USA (2003).
15. Santos, S.D.F.R. and Cabral, S. \FMEA and PMBoK applied to project risk management", International Conference on Management of Technology, Vienna, Austria (2005).
16. Charette, R., Software Engineering Risk Analysis and Management, McGraw Hill, NY, USA (1989). 17. Sandy, M., Aven, T. and Ford, D. \On integrating risk
perspectives in project management", Risk Manage-ment: An International Journal, 7(4), pp. 7-21 (2005). 18. Williams, T.M. \The two-dimensionality of project risk", International Journal of Project Management, 14(3), pp. 185-186 (1996).
19. Hillson, D. \The risk breakdown structure (RBS) as an aid to eective risk management", Fifth Euro-pean Project Management Conference, PMI Europe. Cannes, France (2002).
20. U.S. DOE (Department of Energy), The Owner's Role in Project Risk Management, National Academy of Sciences, NY, USA (2005).
21. Fiona, D.P. and Kevin N. \A risk-register database system to aid the management of project risk", In-ternational Journal of Project Management, 20, pp. 365-374 (2002).
22. Hillson, D. \Towards a risk maturity model", Interna-tional Journal of Project and Business Risk, Spring, pp. 35-46 (1997).
23. Grey, S., Practical Risk Assessment for Project Man-agement, John Wiley & Sons, Chichester, USA (1995). 24. Jacobs, D. \It is not about bankruptcy", Risk Man-agement Newsletter, Chapter 11, 4(4), pp. 6-9 (2002). 25. Kleim, R.L. and Ludin, S., Reducing Project Risk.,


![Table 10. Comparison of the TPRM and the RMP provided in the standard of PMBoK [13].](https://thumb-us.123doks.com/thumbv2/123dok_us/8398139.2231277/9.892.84.793.163.1157/table-comparison-tprm-rmp-provided-standard-pmbok.webp)

